and a New Glass-Melt Constitutive Model
DAVIDE S. A. DE FOCATIIS,1yJOHN EMBERY,2zC. PAUL BUCKLEY1 1
Department of Engineering Science, University of Oxford, United Kingdom 2
School of Physics and Astronomy, University of Leeds, United Kingdom
Received 24 November 2009; revised 16 March 2010; accepted 27 March 2010 DOI: 10.1002/polb.22028
Published online 26 May 2010 in Wiley InterScience (www.interscience.wiley.com).
ABSTRACT:An experimental study was made of the effects of prior molecular orientation on large tensile deformations of polystyrene in the glassy state. A new hybrid glass-melt con-stitutive model is proposed for describing and understanding the results, achieved by parallel coupling of the ROLIEPOLY molecularly-based melt model with a model previously pro-posed for polymer glasses. Monodisperse and polydisperse grades of polystyrene are considered. Comparisons between experimental results and simulations illustrate that the model captures characteristic features of both the melt and glassy states. Polystyrene was stretched in the melt state and quenched to below Tg, and then tensile tested parallel to the orientation direction near the glass transition. The degree of strain-hardening was observed to increase with
increasing prior stretch of molecules within their entangle-ment tubes, as predicted by the constitutive model. This was explored for varying temperature of stretching, degree of stretching, and dwell time before quenching. The model in its current form, however, lacks awareness of processes of subentanglement chain orientation. Therefore, it under-predicts the orientation-direction strain hardening and yield stress increase, when stretching occurs at the lowest temperatures and shortest times, where it is dominated by subentanglement orientation. VC 2010 Wiley Periodicals, Inc. J Polym Sci Part B: Polym Phys 48: 1449–1463, 2010
KEYWORDS:constitutive model; glass transition; orientation; polystyrene; rheology; ROLIEPOLY; simulations
INTRODUCTION As demonstrated by a wide range of poly-mer products, molecular orientation is one of the fundamen-tal parameters that determine the mechanical response of a melt processed, thermoplastic polymer.1The degree of orien-tation present within a particular product is a complex func-tion of its rheology and the process parameters employed. The rheological behavior itself is intrinsically linked to the molecular weight and its distribution, and the chain architec-ture, as well as the presence of any additives. Consequently, as industrial polymer processing engineers have long known, mechanical properties of practical importance such as Young’s modulus, yield stress, and fracture toughness in any given direction are highly sensitive to the grade of polymer employed and the flow history encountered during process-ing.2–9 Therefore, it is of great practical interest to under-stand better the development of frozen-in molecular orienta-tion during melt processing, and the relaorienta-tionships between this orientation and resulting solid-state properties. In par-ticular, there is an engineering need to achieve a predictive capability, for use in optimizing polymer products.
Progress toward predicting the large deformation solid-state performance of polymer products with process-induced
molecular orientation requires a constitutive model applicable to both solid and melt states. In the melt, molecules are ori-ented by the flow and stretched within their entanglement con-straint tubes. Any subsequent solid-state deformation leads to a continued evolution of orientation and stretch, in parallel with short-range effects such as segmental diffusion and structural evolution. A model is required that is sufficiently comprehen-sive to capture this range of behavior. Moreover, a desirable fea-ture of such a model would be the incorporation of information about the chemical structure of the polymer, such as molecular length and architecture. This would enable the concurrent design of compatible materials and processes to produce opti-mized products with the desired properties.
A basis for finite deformation constitutive models of amor-phous polymeric solids is provided by the one-dimensional model of Haward and Thackray.10 Two contributions are ascribed to the free energy and hence the stress, arising from (a) perturbation of interatomic potentials, relaxed by isotropic segmental flow, and (b) perturbation of conforma-tional entropy of the entangled molecular network, repre-sented in the glassy state as a crosslinked network. These ideas have been incorporated into fully three-dimensional
†
Present address:Department of Chemical and Environmental Engineering, University of Nottingham, United Kingdom.
‡
Present address:Materials Technology Institute, Eindhoven University of Technology, Eindhoven, The Netherlands. Correspondence to: D. S. A. De Focatiis (E-mail: [email protected])
constitutive models by several researchers. Examples of studies that employed this kind of description include those of Buckley and coworkers,11–13Boyce and coworkers,14,15and Govaert and coworkers.16–18A notable feature of such a model is that all the strain-hardening observed experimentally at large deformations is attributed to the nonlinear elasticity of contribution (b) above. Various free energy functions originating from rubber elasticity theory have been employed to capture this. Although such models have proved useful phenomenological tools for describing the constitutive behavior of initially isotropic poly-mers belowTg, at constant temperature and strain-rate, they all exhibit important inconsistencies with the underlying polymer physics. For example, the apparent crosslink density required to fit the experimental observations is orders of magnitudes larger than the entanglement density evaluated from melt rhe-ology.19 In addition, the strain-hardening is rate-sensitive,20 inconsistent with the elasticity of a crosslinked network, and reduces with increase in temperature,18,21 inconsistent with entropic elasticity. Moreover, Govaert and Tervoort also found that for polycarbonate, the strain hardening increased with increasing molecular weight.18 This is in contrast with the widely held view that the entanglement density is, at a given temperature, an intrinsic property of the polymer itself and does not depend on molecular weight.
For all these reasons, there is growing recognition that the form of constitutive model described above is inadequate to capture large deformations in polymer glasses over a wide range of rate and temperature. There may be two physically separate processes causing this. (I) Near and above the glass transition, the conformational entropy of the entanglement network begins to relax on the experimental time-scale, by molecular diffusion within the tube. Therefore, the entropic stress contribution from the entanglement network is expected to become elastoviscous, and to exhibit the forms of dependence on rate, temperature, and molecular weight observed. (II) Deep in the glassy state, where tube diffusion is expected to be frozen, the rate and temperature depend-ence of the strain hardening may indicate that it has been mis-attributed to the entanglement network. If most of the strain-hardening comes instead from strain-dependence of the resistance to segmental flow, the experimental observa-tions can be explained.20–22
Since this work requires a constitutive model that spans both the melt and glassy states, we focus attention on incorporating process I identified above into the constitutive model of a polymer glass. Several previous authors have addressed this question and have modified constitutive models for polymer glasses by incorporating a representation of the relaxation of conformational entropy. In all cases to date, the approach adopted was phenomenological, aimed at achieving a good match to experiment, to provide an effective capability for modeling highly elastic flows just above the glass transition encountered, for example in thermoforming and stretch-blow molding processes. Examples of this approach are the studies of poly(methyl methacrylate) by Dooling et al.23 and more recently by Dupaix and coworkers,24and of poly(ethylene ter-ephthalate) by Buckley and coworkers25 and Boyce and
co-workers.26Useful empirical fits to data can be achieved in this manner, but the approach has two major disadvantages. First, the constitutive description does not extend deep into the melt, to provide a unified constitutive model that also captures melt rheology further upstream in the flow history that may still impact on eventual solid state properties. Second, phe-nomenological models lack molecular awareness: they cannot predict the consequences of changing molecular structure or chain length. Therefore, they preclude a genuinely holistic design of polymer, processing and part that is the eventual goal of modeling.
Meanwhile, in a separate development, there has been much recent progress in formulating molecularly aware rheological models for polymer melts. Deformation of monodisperse linear polymer melts, where the interaction between stretching and relaxation of the entanglement network dominates the behav-ior, has been successfully modeled by McLeish and coworkers using a full, molecularly based, linear constitutive theory of polymer melts.27The ROuse model for LInear Entangled POLY-mers, known as the ROLIEPOLY model, was derived subse-quently as a mathematical simplification of the full linear theory, more amenable to large-scale computation.28This con-stitutive equation was implemented in a Lagrangian flow solver29 and has been deployed with great success, to accu-rately predict the flow of melts in complex geometries.30–32In view of the success of this approach deep in the melt state, this work explores its ability to capture the rheology in highly elas-tic flows nearer to the glass transition, by providing a molecu-larly based description of the process I referred to above.
Thus, a new hybrid glass-melt constitutive model is pro-posed here that aims to capture deformation in both the glassy and melt states. The model consists of a set of ROLIEPOLY equations that govern the conformational entropy elasticity of the polymer and its relaxation by tube diffusion in the melt, and a multi-mode glassy constitutive model for deformation of PS developed previously in the Oxford laboratory.13 The combined model is parameterized through the full linear viscoelastic spectrum.
measure the effects of melt state orientation on their consti-tutive response in the glassy state.
EXPERIMENTAL
Materials
The materials used in this study were two samples of mono-disperse linear atactic PS (PDI ¼ Mw/Mn < 1.15) and one sample of polydisperse linear atactic PS (Dow GP680E base polymer with no additives). The codes used to refer to the materials in this article are consistent with previous publica-tions on these polymers.33,34Monodisperse materials AF and AG were synthesized by living anionic polymerization at Durham and were provided by Dr. Lian Hutchings of the University of Durham, whereas polydisperse material R was provided by the Dow Chemical Company. Molar mass mea-surements were kindly performed by Dr. Hutchings by size exclusion chromatography (SEC) on a Viscotek TDA 302 machine with refractive index, viscosity, and light scattering detectors, and results are given in Table 1.
Differential Scanning Calorimetry
The glass transition of all three polystyrene samples was studied using differential scanning calorimetry (DSC) with a TA DSC Q10 instrument. DSC runs consisting of a heating ramp to 160 C, a cooling ramp to 60 C, and a reheating ramp to 160C, all conducted at 10C min1, were repeated three times for each material.Tg was identified for each run using the TA Universal Analysis 2000 Version 4.3A software’s onset-end intercept method. Average values of Tg for each material are given in Table 1.
Rheometry
Linear melt rheology in shear was analyzed for all materials using an Ares L2 rheometer with 10 mm parallel plates. A temperature range of between 130C and 230C was used. The curves of G0 and G00 versus log(frequency) were shifted using time–temperature superposition to provide a single master curve for each polymer at a reference temperature of 170C. The master curves are shown in Figure 1.
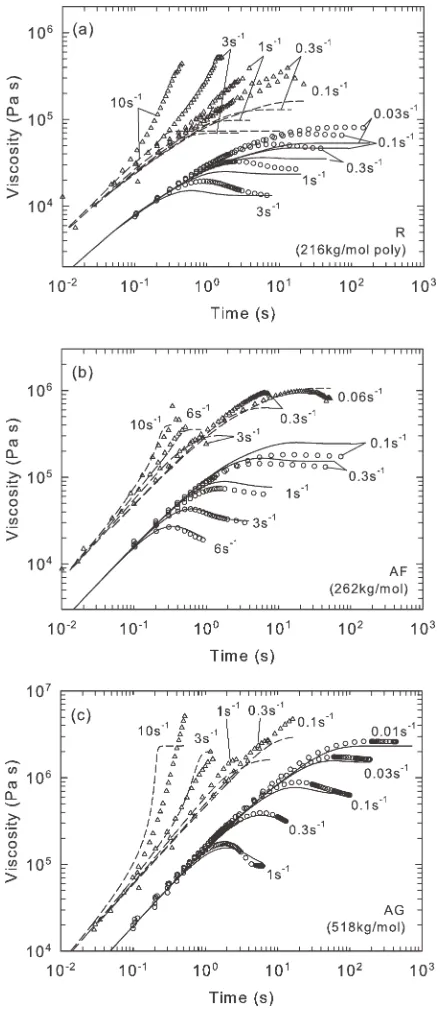
Nonlinear rheology was analyzed for all materials using an Ares L2 rheometer with 10 mm diameter cone and plate in transient shear, and with a Sentmanat extensional rheometer fixture36 in extension. A temperature of 170 C was used, with applied strain rates ranging from 0.01 s1to 6 s1in shear and 0.06 s1to 10 s1in extension. Measurements of viscosity are plotted against time in Figure 2.
Production of Isotropic Specimens
The starting specimens used in this work were all in the form of isotropic bars of PS, formed by compression mold-ing. Owing to the limited quantities of the monodisperse materials available, and the brittle nature of polystyrene, a technique for near net shape production of small parallelepi-pedic bars was employed. The aim was to minimize material waste and to keep stress applied to specimens during their removal from the mold to a minimum.
[image:3.612.62.559.93.157.2]A steel mold consisting of upper and lower steel plates, with a central steel multiple cavity plate 0.5 mm in thickness, was used to mold rectangular bars in a hand-operated hydraulic press with heated platens. The central steel cavity plate ensures accurate location of the removable steel inserts, which define the specimen geometry and allow for easy removal of the specimens after molding. Fresh sheets of dis-posable 0.15 mm thick soft temper 1200 aluminum foil obtained from Multifoil Ltd were sandwiched between the top steel plate and the cavity plate, and the bottom steel plate and the cavity plate to provide a repeatable surface texture on the molded specimens. The foil sheets, the mold cavity plate, and the inserts were lightly sprayed with a dry PTFE mold release aerosol, before each molding operation. TABLE 1Molar Mass Measurements Obtained by Triple Detection SEC, andTgMeasurements Obtained from Differential
Scanning Calorimetry, for the Polystyrene Samples Used in this Study
Code Mw(g/mol) PDI Architecture Tg(C)
Monodisperse AF 262,000 1.05 linear 105.761.3
Monodisperse AG 518,000 1.15 linear 107.560.9
Polydisperse R 216,000 2.54 linear 104.760.7
FIGURE 1Storage moduli (G0—large symbols) and loss moduli (G00—small symbols) obtained from linear viscoelastic shear melt rheology, shifted to 170C using time–temperature super-position, for the three polymers used in this study. Also shown are the moduli obtained from of the Likhtman-McLeish quanti-tative theory35used to obtain the material parameters
[image:3.612.319.549.469.639.2]Each cavity of the mold was then filled with a small excess of polymer before placing the mold between preheated press platens.
The mold reached the molding temperature of 170 C in 10 min, during which time the platens were slowly closed.
The clamping force was then cycled manually for a period of 5 min to dislodge any trapped air bubbles. The mold was held at 170 C at moderate pressure for a further 10 min, and then cooled to room temperature at a rate of ca 15C/ min by flushing cold water through cooling channels in the press platens. The mold was removed from the press when the temperature reached 70 C. The temperature during a typical molding cycle, monitored with an embedded thermo-couple can be found in our previous report.33 The moldings were verified as optically isotropic. Small amounts of flash were removed from the sides of the specimens after molding using fine grades of abrasive paper. Typical specimens produced with this mold have dimensions of 80 mm6 mm 0.5 mm, although other geometries are possible.
Production of Oriented Specimens
Molecular orientation was introduced by melt drawing the prismatic bars of PS in an Instron 4204 testing machine fit-ted with an environmental chamber at a range of tempera-tures Taround and aboveTg, at a constant crosshead veloc-ity corresponding to a nominal strain rate of 0.02 s1. The bars were gripped using pneumatic grippers, with the lower grip actuated after 12 min, when the oven temperature set-tled. They were then stretched uniaxially to a range of draw ratios kbetween 2 and 4, and then quench cooled to below Tg, using a cold spray applied at the end of the drawing pro-cess, giving an initial cooling rate of 15 C/s. In some experiments, a dwell time t was allowed at the end of stretching, for isothermal stress-relaxation to occur at con-stant grip displacement, before quenching. Strain was meas-ured using an Instron noncontact video extensometer track-ing black marks applied on the sample ustrack-ing a water-based ink. Temperature was monitored throughout the experiments using two thermocouples positioned close to the bars. The tensile load was recorded throughout the orientation and dwell process. The oriented bars were then stored at room temperature before redrawing.
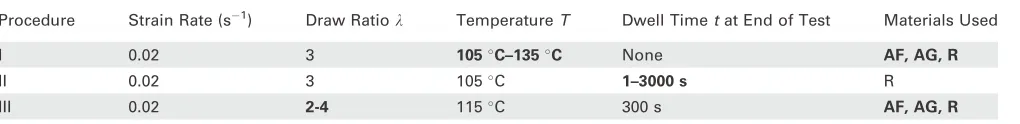
To explore systematically the separate roles of the three vari-ablesT,t, andk, three procedures were followed:
Procedure I, Varying T
The monodisperse materials AF and AG and the commercial polydisperse material R were hot-drawn at a range of tem-peraturesTfrom 105C to 135C, to a fixed draw ratiok¼ 3 at a constant nominal strain rate 0.02 s1, and immedi-ately quenched using the cold spray.
Procedure II, Varying t
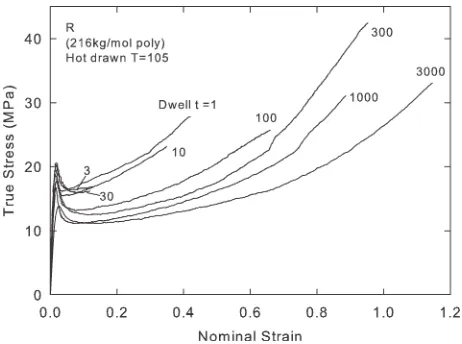
The polydisperse material R was hot-drawn at a temperature T¼105C, to a fixed draw ratiok¼3 at a constant nomi-nal strain rate 0.02 s1, and a range of dwell times t from 1 s to 3000 s were allowed before quenching, to allow relax-ation to take place at the draw temperature.
Procedure III, Varyingk
[image:4.612.67.290.67.572.2]The monodisperse materials AF and AG and polydisperse material R were drawn to a range of draw ratioskfrom 2 to 4 at a constant nominal strain rate 0.02 s1at a temperature FIGURE 2Transient shear and extensional viscosity measured
T ¼ 115 C. A dwell time t of 300s was allowed before quenching.
A summary of the procedures is presented in Table 2, with the parameters used as variables highlighted in bold.
The production of oriented specimens was challenging for a variety of reasons: in general, the limited availability of materials precluded repetitions of the tests; at low draw temperatures, the specimens were prone to either brittle fracture or to the formation of inhomogeneous deformation zones, or necks; at high draw temperatures, the specimens were prone to failure at the grips. The range of temperatures and dwell times reported here indicate the range in which uniform specimens were able to be both produced and retested in the glassy state. In the cases where inhomogene-ous deformation was visible, the specimens have been excluded from the analysis.
Sub-TgTesting of Oriented Specimens
All the oriented bars were tested in uniaxial tension in the same Instron testing machine as used for the orientation process, with the environmental chamber at a fixed tempera-ture Tr ¼96 C 6 1 C, and a constant crosshead velocity corresponding to a nominal strain rate of 0.001 s1. This temperature was chosen in the narrow temperature window betweenTgand the temperature at which some of the bars became too brittle to test. The oriented bars were gripped in the same manner as for the orientation process. They were tested until failure, or until visible necking ensued. In gen-eral, necking was suppressed in the oriented bars, occurring infrequently and only in the bars preoriented at the highest temperatures. Strain was measured using an Instron noncon-tact video extensometer. Because of the tendency of some bars to stress-whiten at large extensions, the oriented bars were painted black using a water-based ink and silver reflec-tive marks applied over the black ink were tracked by the extensometer.
Figure 3(a–c) illustrates measured stresses as a function of nominal strains for the bars oriented according to Procedure I, for the materials AF, AG, and R. The plots are on identical axes to illustrate the differences across the materials on the glassy response. Figure 4 illustrates measured stresses as a function of nominal strains for the bars of polymer R ori-ented according to Procedure II, drawing at 105C and vary-ing the dwell time t. Figure 5(a–c) illustrates measured stresses as a function of nominal strains for the bars ori-ented according to Procedure III, varying the draw ratio dur-ing hot-drawdur-ing. Again the plots are on identical axes to
illustrate the effects of the differences in draw ratio on the glassy response.
CONSTITUTIVE MODEL
Basis
The following is a fully three-dimensional constitutive model for amorphous polymers, combining the Oxford Glass-Rubber (GR) constitutive model proposed first for irrotational dis-placement fields11 and later for generic displacement fields,13,23with the ROLIEPOLY constitutive equations of Likht-man et al.28The combined model is based on the assumption that in a deformed amorphous polymer, free energy is stored through (a) perturbation of interatomic potentials, or bond-stretching, and through (b) changes in the supra-entanglement molecular conformational entropy, and that these two contri-butions to the free energy are additive.
The constitutive model describes the material response to a deformation gradient tensor Fin terms of the Cauchy stress tensorr.Fis separated into volumetric and deviatoric parts, given respectively, by the following:
J¼detFandF¼J13F: (1)
The stress tensorris similarly separated into volumetricsm and deviatoricSparts, given by the following:
sm¼KlnJ¼ 1
3trr and S¼rsmI (2)
whereKis the bulk modulus.
From the assumption of additivity of the bond-stretching and conformational free energies, the deviatoric stress can be expressed as the sum of (a) a bond-stretching stressSband (b) a conformational stressSc
S¼SbþSc: (3)
Bond-Stretching Stress
The bond-stretching part of the model mirrors our previous approach in the modeling of glassy polymers and only a brief treatment will be given here. The reader is advised to con-sult previous papers11–13,23 for a more detailed discussion. The deviatoric rate of deformation tensor D can be com-puted from the isochoric velocity gradient tensor L, given by the following:
L¼FF1; D¼LþL T
[image:5.612.57.567.84.146.2]2 (4)
TABLE 2Summary of the Test Procedures for Preparing Uniaxially Oriented Specimens
Procedure Strain Rate (s1) Draw Ratiok TemperatureT Dwell Timetat End of Test Materials Used
I 0.02 3 105C–135C None AF, AG, R
II 0.02 3 105C 1–3000 s R
III 0.02 2-4 115C 300 s AF, AG, R
where F_ is the time derivative of F. The deviatoric rate of deformationD is the sum of a linear elastic bond stretching part, and a part from the viscous flow of molecular segments. Following Wu and Buckley,13we use a multimode discrete spectrum ofMmodes
D¼ ^S b
j
2Gbþ Sb
j
2Gbsj;
Sb¼X
M
j¼1tj
Sbj; X
M
j¼1tj¼
1 (5)
where^Sbj is an objective, corotational, rate of change of thejth bond-stretching stressSbj (implemented as the Jaumann rate), Gbis the bond-stretching shear modulus,tjrepresents the
rel-ative weighting of each mode, and sj is the relaxation time
associated with the jth glassy mode. The glassy relaxation time is referred back to an unstressed relaxation timesj;0 at a reference temperatureT* and structural stateTf through shift factors for temperature, structure, and stress, respectively.
sj¼aTasar;jsj;0 (6)
where
aT¼exp DH R
1 T
1 T
as¼exp C TfT1
C T
f T1
ar¼ Vssboct;j
2RT
exp Vpsm RT
sinh Vss
b oct;j 2RT
(7)
The material constants are as employed by Wu and Buck-ley:13DHis the activation enthalpy,T1is the Vogel tempera-ture, C is the Cohen Turnbull constant, Vs and Vp are the shear and pressure activation volumes, and sb
oct;j is the
octa-hedral shear stress acting on thejth mode.
[image:6.612.62.294.66.605.2]In this article, the structural evolution visible during me-chanical deformation below Tg as a yield peak and subse-quent strain-softening, is modeled through a semi-empirical expression connecting the evolution of Tf with viscoplastic strain12
FIGURE 3True stress plotted against nominal strain measured during glassy-state uniaxial testing (Tr¼96C,e_¼0:001 s1) of bars melt stretched according to procedure I, at a range of tem-peratures T ¼ 105C–135 C followed by immediate quench-ing, for materials R (a), AF (b), and AG (c).
[image:6.612.319.550.501.673.2]Tf¼Tf;0þDTf 1exp e v
ev 0
(8)
whereTf,0andDTfare the initial fictive temperature and the increase in fictive temperature due to plastic strain, ev
0 is a
material parameter, and ev is the equivalent viscoplastic strain invariant. Equation 8 neglects the rate dependence of
DTfandev0 and does not provide for the prediction ofTf,0as a consequence of prior thermal history of the glass. If more predictive capability is required, it is necessary to provide a model for the kinetics of evolution ofTffor example as sug-gested by Figiel et al.37
Conformational Stress
The conformational stress is computed via the ROLIEPOLY constitutive model, a simplified form of a full microscopic theory of linear entangled polymer melts. The ROLIEPOLY model has also been described in detail previously28 and only a brief treatment will be given here. Since this study explores the applicability of the model to semi-solid states with high degrees of stretch and limited relaxation, it is necessary to employ a version of the ROLIEPOLY equation with finite chain extensibility, kindly provided by Dr D. J. Read of the University of Leeds. In this preliminary study, we do not consider the effects of convective constraint release (i.e., we take b ¼ 0 in the terms of Likhtman and Graham28).
Following Likhtman and Graham,28 we use a spectrum of N discrete ROLIEPOLY modes to represent the conformational stress and compute a stress in each mode from its corre-sponding orientation tensor Tk. The orientation tensor is governed by the ROLIEPOLY differential equation, modified to allow for finite extensibility
_
Tk¼LTkþTkLT1
sd
k
Tkk2kI
2
sR
k
Fð Þ kk 1 kk
Tk
(9)
where sRk and sdk are the Rouse and reptation times
associ-ated with the kth mode, and kk¼
ffiffiffiffiffiffiffiffiffiffiffiffiffiffiffi
1 3trð ÞTk
q
is the chain stretch associated with the kth mode. F(kk) is given by the
following:
Fð Þ ¼kk kmax3 k
2 max1
k2 max1=3
!
L1 kk
kmax
(10)
whereL1is the inverse Langevin function. In the numeri-cal implementation, a Pade´ approximation to the inverse Langevin function is used.38 The front factor in eq 10 ensures that F(1) is equal to unity for unstretched modes and that hence no retraction occurs.
After integration of eq 10 to obtain the orientation tensor, the stress in thekth mode is calculated from the following:
rc
k¼Ge Fð Þkk
kk
TkI
Sc
k¼rck
I 3tr r
c
k ;
Sc¼X
M
k¼1
[image:7.612.58.297.68.609.2]tkSck; ð11Þ
where rc
k and Sck are the full and deviatoric conformational
stresses of thekth mode,39Ge is the entanglement modulus, andtkrepresents the relative volume fraction of the kth RP
mode. The relaxation times are referred back to reference times sRj and sdj at temperature T* and structure Tf through shift factorsaTfor temperature andasfor structure, sR
j ¼aTassRj andsdj ¼aTassdj , as defined earlier in eq 7.
To characterize intrinsic material properties of linear PS melts, we used the optimizer Reptate40 and the microscopic theory of linear polymer melts of Likhtman and McLeish41 applied to linear rheological data in shear on monodisperse materials AF and AG. The material parameters Ge, the entanglement modulus, and Meand se, the molar mass and Rouse time of one entanglement length, respectively, were established by treating them as variables for a best fit to the theory for monodisperse materials AF and AG, following the approach of Likhtman and McLeish.35 The parameter cm was fixed at 1 as in ref. 35.42 The values of the parameters obtained are as follows: Ge ¼ 317.9 kPa, Me ¼ 13.14 kg/ mol, and se ¼0.000697 s at the reference temperature T* ¼ 170 C. The longest (whole molecule) mode Rouse time and reptation time were computed following Collis et al.32
sR1¼Z2s
e (12)
sd
1¼3 1 2:38
Z0:5 þ 4:17
Z
1:55 Z1:5
Z3s
e (13)
whereZ represents the number of entanglements. Although the theory was derived for monodisperse linear chains, we examine its applicability to a solid-state model for a typical commercial polydisperse material in this article, and in this case, useZ¼Mw/Me.
The finite extensibility (FE) of the chains can be derived from molecular theory using an equivalent Kuhn chain between entanglements, following, for example, Wagner43 and is given by
kmax¼
ffiffiffiffiffiffiffi
nb C1
r
sinðhb=2Þ (14)
where nb is the number of bonds between entanglements, C1 ¼ 10 is the characteristic ratio for PS,44 and hb is the carbon–carbon backbone bond angle, which for PS is 109.28.45Using the value ofM
eobtained in this work gives
kmax ¼ 4.09; this value was used in all the simulations reported here.
Constitutive Model Parameters
To determine a discrete relaxation spectrum fitting the lin-ear viscoelastic data, the procedure employed was as fol-lows. Starting with the mode with the longest relaxation time, sd
1, calculated from eqs. 12 and 14, one mode of s d
was assigned per decade of time/frequency to cover the range of data of interest, following Likhtman and Gra-ham.28 The relative weights of the modes were calculated
using a custom-built optimizer written in Matlab to mini-mize the rms error between the logarithms of the values of G0 and G00 as obtained by experiment and as calculated from the following:
G0¼MXþN1
i¼1 Gi x
2 sd
i
2
1þx2 sd
i 2
; G00¼MXþN1
i¼1
Gi xs
d
i
1þx2 sd
i 2
: (15)
Since the ROLIEPOLY constitutive model is based on entan-glement physics, the following condition was imposed:
XN
k¼1
Gk¼Ge: (16)
Hence, relative weights tk ¼ Gk/Ge were attributed to ROLIEPOLY modes until the sum of the modes reached the entanglement modulus Ge, and relative weights tj ¼ Gj/Gb were attributed to the remaining (bond-stretching) modes, until the sum of the modes reached the bond-stretch modu-lus Gb¼
PM
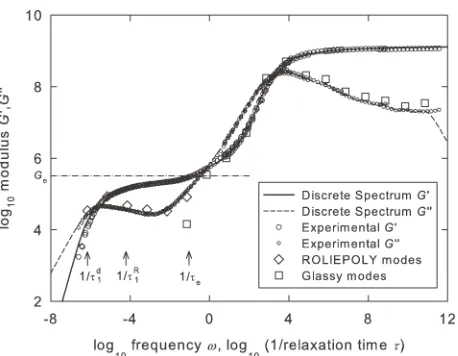
j¼1Gj. This procedure is illustrated for material AG in Figure 6.
The same procedure was used to obtain discrete spectra for the AF and R materials (not shown). To satisfy eq 16, five RP modes were required for materials R and AF, and six modes for material AG, and one mode occurring at x 1/se was partitioned between RP and glassy modes. A further 12 glassy modes were fitted for all materials.
For each mode, the sdk values are separated by a decade of time, whereas the corresponding sR
k values are calculated
from the value of Zk corresponding to that mode, by first
solving
sd
k¼3 12Z:038:5
k þ
4:17 Zk
1:55 Z1:5
k
Z3
kse (17)
forZkand then using the corresponding value ofZkin
sR
k¼Zk2se: (18)
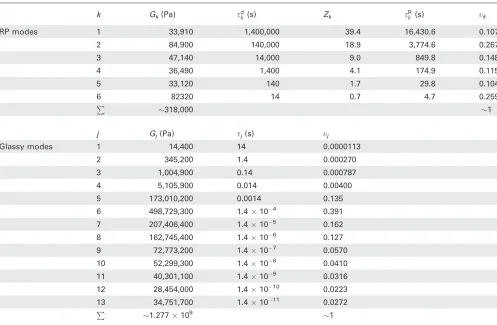
As an illustrative example, the relaxation times for polymer AG shifted to 120 C are shown in Table 3. At this tempera-ture,se¼10.57 s.
The reader may find it surprising that a RP mode is present with a value of Z<1. We attach no physical significance to this, but simply use the value of Z as a means of obtaining
sR
k associated with the prescribed sdk. Although the spectrum
For the bond-stretch part of the model, where possible the material parameters follow the work on PS of Wu and Buck-ley.13 In this work, the thermal history of the redrawn bars involved a quench, differing from that in the earlier work, and the redrawing occurs significantly closer to Tg. For this reason, new values of DH,C, andT1have been found using an optimization routine applied to the shift factor measure-ments of Wu and Buckley at 110C and above. Appropriate values ofTf,0,DTf, andev
0 have been selected for the present data. The parameters used in the constitutive model simula-tions are summarized in Table 4. For the RP part of the model, the material parameters used are summarized in Table 5.
SIMULATION RESULTS
The first test of the constitutive model was to simulate melt rheology in the nonlinear viscoelastic regime and to compare its predictions with experiment. The model simulations are overlaid on the experimental data in Figure 2.
The second test of the constitutive model was to simulate glassy-state compression yield and flow of isotropic speci-mens of PS at a range of temperatures below Tg, for which experimental data and bond-stretch model parameters were provided by Wu and Buckley.14 Model simulations are over-laid on the experimental data in Figure 7.
The model was then applied to the experimental conditions outlined in Procedures I, II, and III. This involved simulating the following steps:
1. The melt stretching process at a nominal strain rate of _
e¼0:02 s1 at the prescribed temperature T to the pre-scribed draw ratiok.
2. Holding for the required dwell time t(assumed to be 1 s for cases where no dwell was specifically imposed). 3. A rapid quench, approximated by a decrease in
tempera-ture at a constant rate of 15C/s down to a temperature of 0C.
4. Unloading of the stress (simulated by a rapid contraction at a rate of e_¼ 1 s1; the strain required to achieve unloading is between 0.1% and 0.3% depending on the drawing conditions).
5. Reheating to the glassy-state draw temperature of 96 C (simulated by a temperature rise at a constant rate of 0.8C/s for 120 s).
6. Holding at 96C for a time of 600 s (intended to simulate the time taken for the environmental chamber to acclimatize).
7. Uniaxial stretching at 96 C at a nominal strain rate of _
e¼0:001ks1. (intended to simulate the stretching of ori-ented material at a nominal strain rate of e_¼0:001 s1 calculated using its new length after the hot drawing).
As an illustrative example, the full simulation of a bar of polymer AG hot-drawn according to Procedure III at 115C, followed by a 300 s dwell time before quenching, un-loading, reheating, acclimatizing, and redrawing, is shown in Figure 8.
In the simulation results shown below, only results from the final step (7) are shown. The ‘‘nominal strain’’ during the uniaxial stretching of the oriented material shown in the simulations was computed from the continuous measure of nominal strain e used in all the process as (e þ 1)/k 1. This was to account for the fact that the measurement of strain in the experiments is computed relative to the new length of the bars after hot drawing and before glassy-state stretching.
Figure 9(a–c) shows model simulations of stresses versus nominal strain for the experimental conditions of Procedure I, for materials R (a), AF (b), and AG (c). The plots are intended to simulate the experimental measurements shown in Figure 3(a–c) and are shown on identical axes to illustrate the differences between the materials and to aid comparison with the data in Figure 3.
Figure 10 shows model simulations of stresses versus nomi-nal strain for the experimental conditions of Procedure II, drawing at 105 C and varying the dwell time tfor material R, and is intended to simulate the experimental measure-ments shown in Figure 4.
[image:9.612.64.293.65.243.2]Figure 11(a–c) shows model simulations of stresses versus nominal strain for the experimental conditions of Procedure III, varying the draw ratio during hot-drawing for materials AF, AG, and R to values ofk¼2(a),k¼3(b), andk¼4(c). FIGURE 6Storage and loss moduli obtained from linear
visco-elastic shear rheology (for log10 x< 1) for polymer AG, and from dynamic mechanical analysis (for log10x> 1) for poly-mer R, from Wu and Buckley,13 as a function of frequency (squares). Also shown are the storage and loss moduli calcu-lated analytically from the 18-mode spectrum using eq 15 (solid line and dashed line, respectively). The 6Gkcomponents
of the 6-mode RP spectrum are shown as diamonds plotted versus the associated 1/sd
k. The 13 Gjcomponents of the
13-mode glassy spectrum are shown as squares plotted versus the associated 1/sj. Also illustrated are the positions of the inverses of the fundamental relaxation times 1/sd
The plots are intended to simulate the experimental meas-urements shown in Figure 5(a–c) and are again shown on identical axes to illustrate the differences between the mate-rials and aid comparison with the data of Figure 5(a–c).
DISCUSSION
It is helpful to consider the various experimental conditions in terms of the Weissenberg numbers associated with strain-rate and the various relaxation times of the polymer. For
example, WiAF
d ¼sAFd e_ is the Weissenberg number associated with the disengagement, or reptation time sAF
[image:10.612.57.554.91.416.2]d of polymer AF subjected to a strain rate e_. As the samples were melt stretched at constant crosshead extension corresponding to a nominal strain ratee_nom, the true strain rate e_true is chang-ing durchang-ing stretchchang-ing and is given by e_true¼e_=k. In the TABLE 3Parameters for the Maxwell Spectrum of Conformational RP Modes and Bond-Stretching Modes Used in Modeling Polymer AG
k Gk(Pa) sdk (s) Zk sRk (s) tk
RP modes 1 33,910 1,400,000 39.4 16,430.6 0.107
2 84,900 140,000 18.9 3,774.6 0.267
3 47,140 14,000 9.0 849.8 0.148
4 36,490 1,400 4.1 174.9 0.115
5 33,120 140 1.7 29.8 0.104
6 82320 14 0.7 4.7 0.259
P
318,000 1
j Gj(Pa) sj(s) tj
Glassy modes 1 14,400 14 0.0000113
2 345,200 1.4 0.000270
3 1,004,900 0.14 0.000787
4 5,105,900 0.014 0.00400
5 173,010,200 0.0014 0.135
6 498,729,300 1.4104 0.391
7 207,406,400 1.4105 0.162
8 162,745,400 1.4106 0.127
9 72,773,200 1.4107 0.0570
10 52,299,300 1.4108 0.0410
11 40,301,100 1.4109 0.0316
12 28,454,000 1.41010 0.0223
13 34,751,700 1.41011 0.0272
P
1.277109 1
[image:10.612.313.556.541.732.2]Relaxation times are shifted toT*¼120C.
TABLE 5 Parameters for the RP Part of the Constitutive Model
Parameter Value Source
Ge(kPa) 317.9 This work
Me(kg/mol) 13.14 This work
seat 120C (s) 10.6 This work
kmax 4.09 eq 14
Polymer AF Z 19.9 This work
sR
1 at 120C (s) 4,203 eq 12
sd
1at 120C (s) 165,620 eq 13
Polymer AG Z 39.4 This work
sR
1 at 120C (s) 16,430 eq 12
sd
1at 120C (s) 1,400,000 eq 13
Polymer R Z 16.4 This work
sR
1 at 120C (s) 2,857 eq 12
sd
[image:10.612.57.304.583.734.2]1at 120C (s) 90,645 eq 13
TABLE 4Parameters for the Bond-Stretch Part of the Constitutive Model, Applicable to all Materials
Parameter Value Source
Vs(m3/mol) 2.6103 Ref. 13
Vp(m3/mol) 0.24103 Ref. 13
DH(kJ/mol) 113.6 This work
C(K) 283.5 This work
T1(C) 85.0 This work
Tf,0(redraw) (C) 98.9 This work
DTf(redraw) (C) 1.8 This work
ev
0(redraw) 0.028 This work
Gb(GPa) 1.28 This work
calculation of Weissenberg numbers used here, the nominal strain rate (equal to the true strain rate only at the begin-ning of melt stretching) is used. Weissenberg numbers asso-ciated with the longest Rouse time (WiR) and with the Rouse
[image:11.612.62.294.66.238.2]time of one entanglement length (Wie) are defined similarly in terms of the corresponding relaxation times sR andse. A Weissenberg number much greater than unity indicates that relaxation does not occur during stretching, on the length scale associated with the corresponding relaxation time.
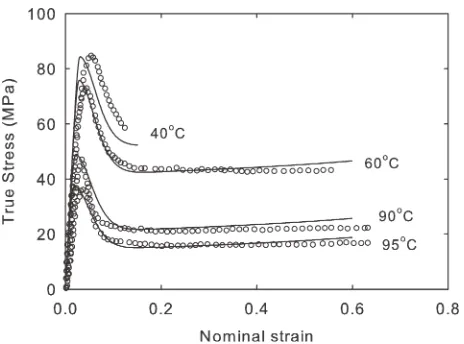
FIGURE 7Experimental measurements of uniaxial compression of isotropic specimens of polymer R at a range of temperatures from 40C to 95C at a rate ofe_¼0:001 s1 from ref. 13 and constitutive model simulations for the same conditions.
[image:11.612.318.549.142.673.2]FIGURE 8Complete constitutive model simulation of the melt stretching process followed by a dwell time, quenching, unloading, reheating, acclimatizing, and restretching. Test pa-rameters are for polymer AG drawn according to procedure III, atT¼115C, tok¼3, followed by a 300 s dwell time before glassy-state uniaxial testing (Tr¼96C,e_¼0:001 s1).
FIGURE 9Constitutive model simulations of glassy-state uniax-ial testing (Tr ¼96C,e_¼0:001 s1) of material melt stretched
[image:11.612.65.290.368.660.2]Figure 2 shows the application of the model to nonlinear viscoelastic rheology of material AG deep in the melt state, measured at 170 C at a range of rates from 0.01 s1 to 10 s1, corresponding to Wie 1. In effect, this shows the performance of the RP part of the model in isolation, since the bond-stretch arm of the model is fully relaxed. As expected, the model captures all of the trends visible in the experimental data and is quantitatively reasonably accurate over the full range of conditions. It is noteworthy that the nonlinear features of the RP part of the model visible in Fig-ure 2 were not fitted to the data, but arise naturally from the molecularly based model.
In Figure 7, we consider the application of the model to the behavior of polymer R deep in the glassy state. Here,WiR 1 and Wid 1 over all the experimental data range. The simulations illustrate the performance of the bond-stretch part of the model in isolation. No relaxation occurs in the RP part of the model under these conditions, and the conforma-tional stresses contribute a very small proportion of the total stress. Again, unsurprisingly, the model is able to capture adequately the yield peak and subsequent yield drop, and also qualitatively predicts the temperature dependence of the flow stress following yield relatively well, as was demon-strated previously.13
The simulations present in Figures 9–11 apply the model to the much more challenging cases of drawing in the glassy state following stretching in the melt. Figure 9 shows the conse-quences of melt stretching according to Procedure I. Here, the melt stretching was simulated at a rate and a range of temper-atures specifically designed to cut across the fundamental relaxation times as much as possible. For instance, whereas the lowest melt stretch temperature of 105C corresponds to Wie100, the highest melt stretch temperature of 135C cor-responds toWie1 andWiRR¼0.9,WiAFR ¼1.3 andWiAGR ¼ 5.3. Hence, during melt stretching, the processes of chain
[image:12.612.63.293.70.239.2]re-traction and reptation are increasingly active as the tempera-ture rises. Glassy-state drawing is simulated atWie 1. The results capture qualitatively all the important features of the stress–strain curves seen in the experimental data in Figure 3: a rise in yield stress and an earlier onset of strain hardening
FIGURE 10Constitutive model simulations of glassy-state uni-axial testing (Tr ¼ 96 C, e_¼0:001 s1) of polymer R material
[image:12.612.315.551.133.674.2]melt stretched according to procedure II, at draw temperature T ¼ 105 C followed by a range of dwell times t before quenching.
FIGURE 11True stress plotted against nominal strain measured during glassy-state uniaxial testing (Tr¼96C,e_¼0:001 s1) of
with decreasing melt stretch temperature. Quantitatively, how-ever, the simulations become increasingly less accurate as the draw temperature is decreased. At lower draw temperatures, the onset of strain hardening occurs much earlier in the exper-imental data than in the simulations, and stresses are under-estimated by the model. This suggests a contribution to the orientation arises from length-scales shorter than are repre-sented in the constitutive model.
In the simulations of Figure 10, the model is applied to poly-mer R oriented at a temperature ofT¼105C, followed by a varying dwell time before freezing. The simulated ‘‘melt stretch’’ here actually occurs at Wie 1. The experimental data of Figure 4 illustrate that even short dwell times of a few seconds lead to visible delay in the onset of strain hard-ening. This is further evidence for the presence of a relaxa-tion process affecting the flow stress and the onset of strain hardening whose associated timescale is less than se. This means that the length scale associated with this process is shorter than an entanglement length. The constitutive model simulations, on the other hand, become increasingly similar for dwell times less than 100 s. This is because within the model, there are no processes that recognize orientation below a timescale of se, since all modes with associated length scales shorter than an entanglement are modeled in terms of an intrinsically isotropic viscoelastic process.
The simulations of Figure 11 explore the effect of varying the degree of stretch in melt stretching at T ¼115 C fol-lowed by 300 s dwell time before quenching. Here, the fun-damental relaxation times are se ¼ 65 s, sRR ¼ 17,700 s,
sAF
R ¼26,000 s, and sAGR ¼ 101,600 s. The dwell time is5
se, so in this case, one would not expect subentanglement processes with relaxation times shorter than se to retain much orientation from the melt stretching history.
When compared with the experiments of Figure 5, the model simulations can be seen to be qualitatively correct, exhibiting all the major features of the experimental data: only small changes in yield stress, increase in strain-hardening with mo-lecular weight, and a substantially earlier onset of strain-hardening with increasing degree of melt stretch. A quantita-tive comparison, however, reveals that, with increasing strain, the experimental data exhibit larger stresses than those seen in the simulations, across the range of conditions.
In summary, the new constitutive model gives good quantita-tive agreement with measurements on isotropic materials deep in the glassy state and deep in the melt state. This is no great surprise since it combines two models previously shown to perform well under these conditions. The present results show it is also able to capture qualitatively all of the features seen in glassy-state drawing of melt stretched poly-styrene. Agreement here extends to the effects of melt stretch temperature, the degree of stretch, and polymer molecular weight. Quantitative shortcomings of the model are most evident in experiments where stretch of sub-entan-glement length scales is taking place. Another feature of the results that can help shed light on this is the yield stress of oriented glassy polystyrene.
The effect of molecular weight on compressive yield stress in isotropic monodisperse PS was investigated by Wu and Buckley.13 They measured an experimental rate of change of yield stress with 1/Mn to be Ry ¼3.1 6 1.2 10
5 MPa g mol1. They accounted for this by consideration of the effect of chain ends on the Vogel temperature and presented a quantitative means to incorporate this in a constitutive model, which, for the sake of simplicity, was not included in the simulations of this article.
In our experiments on oriented PS, the effects of molecular weight on yield stress manifest themselves through two dis-tinct mechanisms: (A) a change in the number density of chain ends, leading to a change in the Vogel temperature, and hence the structural relaxation times, as pointed out by Wu and Buckley; and (B) a change in the length of chains, and hence in the conformational relaxation times associated with those lengths. In our materials, Wu and Buckley’s mea-surement of Ry accounts for a difference in isotropic yield
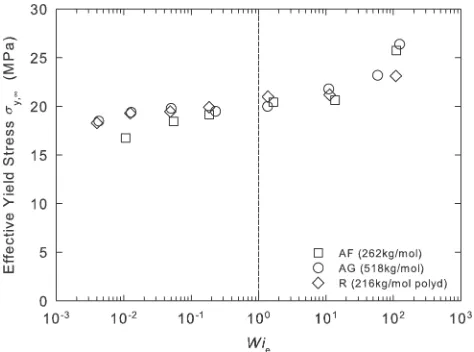
stress of 2.46 0.9 MPa between materials R and AF and of 3.061.1 MPa between materials R and AG. We wish to iso-late the effects of process (B) from the chain end density effects. To do this, for each of our experimental measure-ments in Figure 3, we calculate the value of an effective yield stress corresponding to an equivalent polymer with no chain ends,sy,1, from
sy;1¼syþRy Mn
[image:13.612.316.553.495.671.2](19)
Figure 12 shows values of sy,1 computed from the data of Figure 3, plotted versus Wie. In the region where Wie < 1, all the materials exhibit a drop-off in yield stress with decreasing orientation, measured by Wie. The origin of this is a gradual relaxation of the conformational stress, reflecting molecular orientation that relaxes through reptation. This
is consistent with the structure of the constitutive model, whose longest conformational relaxation time is the repta-tion time of the polymer and whose shortest relaxarepta-tion time is associated with the entanglement length scale.
The ROLIEPOLY part of the model is coupled in parallel with the bond-stretch part, such that the conformational stress makes a contribution to the yield stress. When Wieexceeds unity, however, the effective yield stress measurements ex-hibit a substantial increase with increasingWiethat appears approximately independent of molecular weight. This must reflect orientation occurring on a sub-entanglement length scale (Wie > 1), previously observed experimentally on PMMA by Wendlandt et al. using solid-state NMR46 and by Casas et al. using neutron scattering.47It is further evidence that sub-entanglement orientation leads to more anisotropy of yield than is accounted for just by the conformational stress. The constitutive model does not at present capture this phenomenon. This is not surprising since in the model all modes corresponding to length scales shorter than an entanglement are modeled in terms of an intrinsically iso-tropic viscoelastic process, with no recognition of sub-entan-glement orientation.
A clear message emerges from this accumulated evidence. The new model is successful in capturing the effects of mo-lecular orientation induced in the melt on length-scales greater than an entanglement. It fails quantitatively when prior stretching involves shorter length-scales. This probably reflects the contribution from a further phenomenon (la-beled process II earlier in this paper) that causes other dis-crepancies between the current model and experiment when applied deep in the glassy state, such as the recorded strain rate and temperature effects on the apparent strain harden-ing.18,20,21 It is clear that orientation of molecular segments on a sub-entanglement length scale must also contribute to the development of anisotropy in the glassy state, but this is not yet recognized in the current model. A suggestion for how this could be done by recognizing the bond-stretch vis-coelasticity as being intrinsically anisotropic has been pro-posed by Buckley.22 Another approach to capturing this effect in a glassy-state constitutive model was suggested by Wendlandt et al., who introduced an empirical variation of Eyring activation volume with strain.20 A physically based constitutive model that accounts fully for the stretching of subentanglement Rouse modes is currently lacking.
Another means of testing the ability of the current model to predict molecular orientation resulting from melt stretching is to compare its prediction of frozen-in optical birefringence with experimental measurements. Such a study was carried out by the authors as part of the present project and results will be reported elsewhere.
CONCLUSIONS
A systematic experimental study has been made of the effects of molecular orientation on glassy-state viscoplastic deformation in atactic polystyrene, in which the roles of mo-lecular weight, and parameters of the melt stretching history
have been examined. The data have been compared with predictions made with a new framework for constitutive modeling of processed oriented polymers based on parallel coupling of two existing melt state and glassy-state models. The new combined glass-melt model is parameterized through its full linear viscoelastic spectrum, known molecu-lar parameters of polystyrene, and additional parameters needed for capturing viscoplastic deformation of a glass.
When the model is assessed against results of nonlinear rheo-logical experiments in the melt and uniaxial compression experiments deep in the glassy state, it is found to be quantita-tively successful in capturing the material rheology. The model can also simulate the effects of processing conditions on fro-zen-in orientation, and its effects on polymer response in sub-sequent large deformations in the glassy-state. The model cap-tures qualitatively all of the feacap-tures seen in the experimental results, and also has the advantage of a molecular basis for the prediction of orientation. There are, however, quantitative shortcomings in the current model’s predictions. These are predominant when the time–temperature conditions of melt stretching lead to molecular orientation on a sub-entangle-ment length-scale, since the model presented here contains no representation of intrinsic anisotropy on this length-scale.
The authors wish to acknowledge the assistance of L. Hutchings of Durham University in the supply and characterization of the polystyrenes; D. Groves of Leeds University for the DMA mea-surements; K. Dinsdale of Nottingham University for the DSC measurements; J. Ramirez and A.E. Likhtman for the Reptate toolbox; and D.J. Read of Leeds University and R. Graham of Nottingham University for helpful discussions. This work was supported by the UK EPSRC grant numbers GR/T11845/01 and GR/T11807/01.
REFERENCES AND NOTES
1Ward, I. M. Structure and Properties of Oriented Polymers; Chapman & Hall: London, UK, 1977.
2Wright, H.; Faraday, C. S. N.; White, E. F. T.; Treloar, L. R. G. J Phys D Appl Phys 1971, 4, 2002–2014.
3De Francesco, A.; Duckett, R. A. Polymer 2004, 45, 8005–8011.
4Biswas, P. K.; Sengupta, S.; Basu, A. N. Colloid Polym Sci 1988, 266, 501–508.
5Broutman, L. J.; Mcgarry, F. J. J Appl Polym Sci 1965, 9, 609–626.
6Retting, W. Colloid Polym Sci 1979, 257, 689–710.
7Curtis, J. W. J Phys D Appl Phys 1970, 3, 1413–1422.
8Gotham, K. V.; Scrutton, I. N. Polymer 1978, 19, 341–347.
9Embery, J.; Graham, R. S.; Duckett, R. A.; Groves, D.; Collis, M.; Mackley, M. R.; McLeish, T. C. B. J Polym Sci Part B: Polym Phys 2007, 45, 377–394.
10Haward, R. N.; Thackray, G. Proc R Soc Lond A Math Phys Sci 1968, 302, 453–472.
12Buckley, C. P.; Dooling, P. J.; Harding, J.; Ruiz, C. J Mech Phys Solids 2004, 52, 2355–2377.
13Wu, J. J.; Buckley, C. P. J Polym Sci Part B: Polym Phys 2004, 42, 2027–2040.
14Boyce, M. C.; Parks, D. M.; Argon, A. S. Mech Mater 1988, 7, 15–33.
15Arruda, E. M.; Boyce, M. C.; Jayachandran, R. Mech Mater 1995, 19, 193–212.
16Tervoort, T. A.; Smit, R. J. M.; Brekelmans, W. A. M.; Govaert, L. E. Mech Time Dependent Mater 1998, 1, 269–291.
17Tervoort, T. A.; Govaert, L. E. J Rheol 2000, 44, 1263–1277.
18Govaert, L. E.; Tervoort, T. A. J Polym Sci Part B: Polym Phys 2004, 42, 2041–2049.
19Govaert, L. E.; Engels, T. A. P.; Wendlandt, M.; Tervoort, T. A.; Suter, U. W. J Polym Sci Part B: Polym Phys 2008, 46, 2475–2481.
20Wendlandt, M.; Tervoort, T. A.; Suter, U. W. Polymer 2005, 46, 11786–11797.
21Haward, R. N. Macromolecules 1993, 26, 5860–5869.
22Buckley, C. P. Presented at the 13th International Confer-ence on Deformation, Yield and Fracture of Polymers, Kerkrade, The Netherlands, April 10–13, 2006.
23Dooling, P. J.; Buckley, C. P.; Rostami, S.; Zahlan, N. Poly-mer 2002, 43, 2451–2465.
24Palm, G.; Dupaix, R. B.; Castro, J. J Eng Mater Technol 2006, 128, 559–563.
25Adams, A. M.; Buckley, C. P.; Jones, D. P. Polymer 2000, 42, 771–786.
26Boyce, M. C.; Socrate, S.; Llana, P. G. Polymer 2000, 41, 2183–2201.
27Graham, R. S.; Likhtman, A. E.; McLeish, T. C. B. J Rheol 2003, 47, 1171–1200.
28Likhtman, A. E.; Graham, R. S. 2003, 114, 1–12.
29Bishko, G. B.; Harlen, O. G.; McLeish, T. C. B.; Nicholson, T. M. J Nonnewton Fluid Mech 1999, 82, 255–273.
30Lee, K.; Mackley, M. R.; McLeish, T. C. B.; Nicholson, T. M.; Harlen, O. G. J Rheol 2001, 45, 1261–1277.
31Bent, J.; Hutchings, L. R.; Richards, R. W.; Gough, T.; Spares, R.; Coates, P. D.; Grillo, I.; Harlen, O. G.; Read, D. J.; Graham, R. S.; Likhtman, A. E.; Groves, D. J.; Nicholson, T. M.; McLeish, T. C. B. Science 2003, 301, 2691–1695.
32Collis, M. W.; Lele, A. K.; Mackley, M. R.; Graham, R. S.; Groves, D. J.; Likhtman, A. E.; Nicholson, T. M.; Harlen, O. G.; McLeish, T. C. B.; Hutchings, L. R.; Fernyhough, C. M.; Young, R. N. J Rheol 2005, 49, 501–522.
33De Focatiis, D. S. A.; Buckley, C. P. Polym Test 2008, 27, 136–145.
34De Focatiis, D. S. A.; Buckley, C. P.; Hutchings, L. R. Macro-molecules 2008, 41, 4484–4491.
35Likhtman, A. E.; McLeish, T. C. B. Macromolecules 2002, 35, 6332–6343.
36Sentmanat, M. L. Rheol Acta 2004, 43, 657–669.
37Figiel, Ł.; Dunne, F. P. E.; Buckley, C. P. Modell Simul Mater Sci Eng 2009, 18, 21.
38Cohen, A. Rheol Acta 1991, 30, 270–273.
39Note that in our modeling approach, the hydrostatic compo-nent of the stress is handled separately and linearly, see eq 2, and hence, we require the full component of each ROLIEPOLY stressrc
kto be zero with no applied load. That is why we
sub-tract the identity tensor fromTkin eq 11 before multiplication withGe. Also, since we are attributing only the deviatoric part of the stress to the RP terms, for each mode,Sc
k is taken to be
the deviatoric part ofrc
k.
40Available at: http://www.reptate.com/, downloaded on 16/11/ 2009.
41Likhtman, A. E.; Milner, S. T.; McLeish, T. C. B. Phys Rev Lett 2000, 85, 4550–4553.
42It has been recognized in the literature that althoughcm¼1 can produce marginally more precise fits to the linear rheologi-cal experimental data, a value of cm ¼ 0.1 is more consistent with nonlinear rheology and generally thought to be more real-istic. The parameter is connected with convective constraint release, a mechanism which is not dominant in the linear re-gime. For our purposes, the main consequence of a change in cmis in the value ofMethat is obtained from the optimization. For example, a value ofcm¼0.1 leads to parametersGe¼318 kPa, Me ¼ 13.1 kg/mol, and se ¼ 0.000714 s at the reference temperature T* ¼ 170 C. The quality of the fit to the linear data is marginally worse. A change in the value ofMe subse-quently leads to a change in the value ofkmax through eq 14. We are not in a position to be able to use the present experi-mental data to identify the correct value of kmax, and hence indirectly ofMeandcm, and therefore, we proceed withcm¼1.
43Wagner, M. Korea-Aust Rheol J 2006, 18, 199–207.
44Brandrup, J.; Immergut, E. H.; Grulke, E. A. Polymer Hand-book; Wiley: New York, 1999.
45Flory, P. J. Statistical Mechanics of Chain Molecules; Hanser Publishers: Munich, 1969.
46Wendlandt, M.; Tervoort, T. A.; van Beek, J. D.; Suter, U. W. J Mech Phys Solids 2006, 54, 589–610.