1
ATTENTION USING A MODEL-BASED ANALYSIS: SSoTS
MODEL APPLICATION TO FMRI DATA
EIRINI MAVRITSAKI, HARRIET ALLEN AND GLYN HUMPHREYS Behavioral Brain Sciences Centre, School of Psychology, University of Birmingham, UK,
B15 2TT
The complex neural circuits found in fMRI studies of human attention were decomposed using a model of spiking neurons. The model for visual search over time and space (sSoTS) incorporates different synaptic components (NMDA, AMPA, GABA) and a frequency adaptation mechanism based on IAHP current. This frequency adaptation current can act as a mechanism that suppresses the previously attended items. It has been shown [1] that when the passive process (frequency adaptation) is coupled with a process of active inhibition, new items can be successfully prioritized over time periods matching those found in psychological studies. In this study we use the model to decompose the neural regions mediating the processes of active attentional guidance, and the inhibition of distractors, in search. Activity related to excitatory guidance and inhibitory suppression was extracted from the model and related to different brain regions by using the synaptic activation from sSoTS’s maps as regressors for brain activity derived from standard imaging analysis techniques. The results show that sSoTS pulls-apart discrete brain areas mediating excitatory attentional guidance and active distractor inhibition.
1. Introduction
1.1. Human visual search
Traditionally, in visual search tasks participants are asked to find a known target item amongst irrelevant distracter items, and the time it takes participant to identify the target is measured (the reaction time (RT)). Watson and Humphreys [2] devised a version of visual search where both temporal and spatial features of targets and distracters were varied. They adapted a standard color-form conjunction task, but presented half of the distractors (the preview) prior to the other distracters and the target (when present). They showed that this preview search condition was facilitated relative to the standard conjunction search, with search efficiency approximating that found when the new items were presented alone (the 'single feature baseline'). Watson and Humphreys [2] proposed that temporal prioritization in search tasks depends, at least in part, on the active ignoring of old items – a process they termed visual marking. Humphreys et al. [3] showed that visual marking is disrupted when a secondary task must be conducted during the preview, consistent with the secondary task disrupting top-down ignoring of old items. In addition, there is also evidence for top-top-down excitatory biases influencing search. For example a positive bias for expected target properties can offset the effects of an inhibitory bias against the features of old distracters [4] (induced by, for example, instructions or changes in display). There is now considerable evidence that search is contingent on a network of neural circuits in frontal and parietal cortex that control both voluntary and reflexive orienting of attention to visual information [5]. The inter-play between the different parts of this fronto-parietal circuit however remains less understood.
stimulus-specific cortex (e.g. fusiform face area). Although there are differences in behavior with these more complex stimuli, crucially, Allen et al. [8] found a behavioral advantage for preview search which decreased when there was a memory load. Active ignoring of the preview display was associated with activation in a network of brain areas in posterior parietal cortex. These same regions were active during the visual memory task and decreased their activation for preview displays when the memory task was imposed.
1.2. Modelling human search
Over the past ten years, increasingly sophisticated computational models of visual search and selection have been proposed [9-12]. These models generate a system-level account of performance, emerging from interactions between different local components. This provides an important means of examining how interactions within a complex network generate coherent behavior.
while the location map may correspond to collections of neurons in dorsal (posterior parietal) cortex (for more information for the model see [1]). Over time, the model converges upon a target, with reaction times (RTs) based on the real-time operation of the neurons.
Search efficiency in sSoTS is determined by the degree of overlap between the features of the target and those of distracters. RT lengthen as overlap and competition for selection both increase. Thus, search for a conjunction target (sharing one feature with each of two distracters) is more difficult than search for a feature-defined target (differing from the distracters by a unique feature). Mavritsaki et al. [1, 14] showed that search in the conjunction condition also increased linearly as a function of the display size, mimicking ‘serial’ search.
[image:4.595.141.300.325.437.2]In addition to modeling spatial aspects of search, SSoSTs also successfully simulated data on search over time, in the preview search paradigm [2, 16]. Provided the interval between initial items and the search display is over 450 ms or so, the first distractors in preview search have little impact on behavioral performance [2, 16]. The sSoTS model generated efficient preview search when there was an interval of over 500ms between the initial items and the final search display. sSoTS mimics the behavioral time course due to the contribution of: (i) a spike frequency-adaptation mechanism generated from a slow [Ca2+]-activated K+ current, which reduces the probability of spiking after an input has activated a neuron for a prolonged period [17], and (ii) a top-down inhibitory input that forms an active bias against known distracters. The slow action of frequency-adaptation simulates the time course of preview search. The top-down inhibitory bias matches data from human studies where the detection of probes has been shown to be impaired when they fall at the locations of old, ignored distractors [18, 19]. In addition, in explorations of the parameter space for SSoTS, Mavritsaki et al. [1, 14] found that active inhibition was necessary to approximate the behavioral data on preview search. These results, using the sSoTS model, indicate that processes of co-operation and competition between processing units may not be sufficient to account for the full range of data on
human selective attention and that factors such as frequency adaptation are required in order to simulate the temporal dynamics of visual attention.
1.3. Linking the model to fMRI
Imaging studies have shown a network of regions in posterior parietal cortex (PPC) (including superior parietal cortex and precuneus, extending into occipital cortex) associated with successful prioritization of the new target and ignoring of the old distracters. However, the increased activation in these regions found in preview search is ambiguous, because preview search is influenced by both positive expectancies for targets and inhibitory suppression of distracters [20]. This ambiguity is not apparent in the sSoTS model, though, where effects of top-down expectancies and inhibitory biases against distracters can be distinguished. For example, the map associated with the feature of the old distracters that does not re-occur in the search display (i.e., the map for face stimuli, in Allen et al. [8]) uniquely receives top-down inhibition in SSoTS. The map corresponding to the feature of the target not present in the old distracters (i.e. houses in Allen et al [8]) uniquely receives top-down activation. The changes in activity over time in these maps may be used to predict changes in the fMRI signal linked, respectively, to top-down expectancies and inhibition. The distinct time courses of activation in the model may then be used to pull-apart activity from within the regions linked to preview search, allowing us to isolate the neural regions concerned with excitatory and inhibitory modulation of processing. We report an analysis of fMRI data on preview search taking this approach.
2. sSoTS architecture
information on the basis of whether there is a house or face present in the visual field at a given position i. The pools in the location map sum activity from the different feature maps to represent the overall activity for the corresponding positions in the visual field. Each of the layers contains one inhibitory pool (see also [13]) and one non-specific pool, along with the feature maps.
The system used and the connections are illustrated in Figure 1. More details about the architecture of sSoTs, the organisation of the units (neurons) in the network and the neuronal characteristics can be found in Mavritsaki et. al [1]. The parameters for the simulations were established in baseline conditions with ‘single feature’ and ‘conjunction’ search tasks as reported by Watson and Humphreys [2] and Allen et al. [8] (conjunction search: blue house target vs. red houses and blue faces distracters; feature search: blue face target vs. red houses distracters). The generation of efficient and less efficient (linear) search functions in these conditions replicates the results of Allen et al. [8]. These same parameters were then used to simulate preview search. RTs were based on the time taken for the firing rate of the pool in the location map to cross a relative threshold (thr), (for more details see [1]). Detailed simulations were run at the spiking level only, to match the experimental results [8]. Additionally, to simulate the working memory effect, we reduced slightly the top-down inhibition during the ‘working memory’ trials – assuming this is equivalent to the effects generated when human participants hold another stimulus in working memory during the preview period.
3. Applying the sSoTS model to fMRI data
3.1. Extraction of activation maps for top down inhibition and excitation
“face” and the map that encodes the color “blue” both receive top-down inhibition. By tracing activity in the house, face and blue maps, we can correlate brain activity with active excitatory and inhibitory biases in the model. Note that we are interested in activity relating to these biases and processes, not to the distracter features or colors.
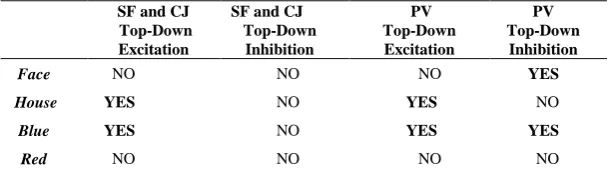
To extract the brain activity relating to these processes, we first extracted a time course of the activity in each of the sSoTS maps (2 x shape, 2 x feature and the location map) over the experiment of Allen et al [8]. These time courses were convolved with a standard estimate of the heamodynamic function and used as regressors for the fMRI activity. To estimate the activations associated with positive biases for targets and inhibitory biases against distracters (see Table 1 and 2) we compared the activations found for each map (for both the conjunction and preview search conditions). Thus, for conjunction search, the positive top-down bias was given by (Target form – Distractor form) + (Target color – Distractor Color), i.e: (House – Face+ Blue – Red). For preview search it was given by (Map with only Positive Bias –Map with no bias) + (Map with Positive
and Negative Bias- Map with only Negative Bias), i.e: (House-Red+Blue-Face) For preview search the top-down inhibition was given by (Map with only
Negative Bias – Map with no Bias) + (Map with Positive and Negative Bias –
[image:7.595.146.452.469.559.2]Map with only Positive Bias), i.e: (Face-Red+Blue-House)
Table 1. Map extraction for Single Feature (SF), Conjunction (CJ) and Preview (PV) search.
SF and CJ Top-Down Excitation
SF and CJ Top-Down Inhibition
PV Top-Down
Excitation
PV Top-Down Inhibition
Face NO NO NO YES
House YES NO YES NO
Blue YES NO YES YES
Red NO NO NO NO
3.2. Comparison of fMRI data with model bold responses
region). Furthermore, instead of using the average pool activity the synaptic activity can also be employed. Deco et al. [24] used the synaptic activity from his model and convolved it with the haemodynamic response function suggested by Glover [23]. To compare our theoretical data with the fMRI experimental data we used the average synaptic activity from the pools in the model’s feature maps. The comparison took place in two steps. First we compared qualitatively the bold response from the fMRI data with the activation function with top-down inhibition similarly with previous work [22-24]. Then average synaptic pool activity was then directly compared with the observed bold data from Allen et al. [8], using the synaptic activity as regressors for the fMRI analysis.
We note that there was no top-down inhibitory bias applied during conjunction search. However, activity in the same maps was examined in order to provide a baseline with the preview search task. After extracting the activity maps from the model, we averaged over 20 trials for each condition and we took the changing time course of activity reflecting top-down inhibition and top-down excitation activity for each condition. This activity was convolved using an assumed haemodynamic response function [24] to create a time series of predicted bold activity. This time series was then used as a regressor for the fMRI data in the contrasting search conditions.
fMRI analysis was done using FEAT, part of fsl (www.fmrib.ox.ac.uk/fsl). The data were pre-processed as in Allen et al. [8], including correction for head movement, within scan signal intensity normalisation, high pass temporal filtering (to remove slow wave artifacts). The time course for each map in the model was entered as a separate regressor. Positive and negative biases were estimated by combining the regressors for each map as desribed above. Z (Gaussianised T/F) statistic image were thresholded using clusters determined by Z>2.3 and a (corrected) cluster significance thresholded of P=0.05.
4. Results
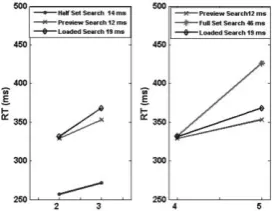
The behavioural results generated by sSoTS matched the classical findings on single feature, conjunction and preview search [2]. Search slopes were steepest for the conjunction condition (“full set search”, 46 ms/item) and shallow in the single feature condition (the half set baseline, 14 ms/item). The search slope was 12 ms/item in the preview condition. The slope of the preview condition increased when a working memory task was added (19 ms/item). See Figure 2.
[image:8.595.145.284.653.758.2]Activity linked to top-down inhibition in the maps was compared with the fMRI
data in precuneus by convolving the activation with the HDR. We found that the HDR for top-down inhibition in the preview condition was increased for preview search compared with conjunction search – a result that reflects the greater salience of the target in preview compared with conjunction search, and not the difficulty of the search tasks (conjunction search being the more difficult). This matches data reported by [8] for the precuneus (see Figure 3).
We then took the time courses of activation reflecting the top-down excitatory and inhibitory activity in sSoTS’s feature maps and applied these as regressors to the fMRI data associated with the preview condition reported by Allen et al. [8]. In this study we sought areas where BOLD activity was related to excitatory and inhibitory activity. Allen et al. [8] reported activation in posterior parietal cortex (superior parietal lobe and precuneus) linked to the preview condition. We found a reliable correlation (p<0.001 for all correlations) in right lateral parietal cortex for top-down excitatory activity predicted by sSoTS. In contrast, top-down
inhibitory activity in the model was correlated with fMRI activation in the medial precuneus (Z=50, Figure 4A). The model-based analysis distinguishes two functionally different operations taking place when observers attempt to ignore the preview and prioritise search to new items [20].
[image:9.595.147.428.367.470.2]Figure 4: A. Top-down inhibition in the model (white area correspond to maps: (1-4)+(3-2)) was associated with activity the medial precuneus, while top-down excitation in the model (black area
[image:9.595.154.444.543.657.2]corresponds to maps: (2-4)+(3-1)) was associated with activity in the lateral parietal cortex (right hemisphere). B. Comparisons between preview and conjunction search (the full set baseline). The white regions reflect correlations between (i) top-down inhibitory activity in sSoTS and (ii) increased activation in preview compared with conjunction search. The black regions reflect correlations between (i) top-down excitatory activity in sSoTS and (ii) greater activation in conjunction search compared with preview search. C. Comparisons between the standard preview condition and the condition where preview search was conducted with a working memory load (the loaded search condition) [2]. The white regions reflect correlations between (i) top-down inhibitory activity in sSoTS and (ii) increased activation in standard preview search compared with the loaded search condition. The black regions reflect correlations between (i) top-down excitatory activity in sSoTS and (ii) increased activation in the loaded search condition compared with standard preview search.
We also examined the differences between bold activity in the preview and conjunction search conditions in relation to the activation differences between these conditions apparent in sSoTS (comparing activity in the critical maps in preview and conjunction search). In SSoTS these activation differences are driven by the application of top-down inhibition in preview search. The results showed a reliable correlation between the activation differences in sSoTS and increased activation in the precuneus in preview search compared with the conjunction condition. There was also a correlation between differences in activity in the conjunction and preview conditions in SSoTS and increased activity for the conjunction condition over the preview condition in lateral parietal cortex (see Figure 4B). This may reflect the increased role of excitatory guidance to the target in the conjunction condition.
Finally, we evaluated the differences in activity between the standard preview condition and preview search conducted with a memory load. The differences in activity between these two conditions in sSoTS was correlated with (i) an increase in bold activity in the standard preview compared with the working memory condition in the precuneus, and (ii) an increase in bold activity in the working memory condition compared with the standard preview in lateral parietal cortex (Figure 4C). These results fit with there being reduced inhibitory activity under conditions of working memory load, along with an increased role for top-down activation for the target under the more difficult working memory condition.
5. Conclusions
separated. In SSoTS the activation associated with top-down excitation and inhibition can be distinguished. We showed that bold activity in the precuneus was associated with top-down inhibition in the model, while activity in more lateral parietal areas (particularly in the right hemisphere) correlated with top-down excitation in the model. Activation in these two regions also changed across the search conditions in accord with changes in SSoTS. Higher activation in the precuneus in preview search compared with (i) conjunction search and (ii) the working memory condition was correlated with greater inhibitory activity in the model. In contrast, there was increased activity in lateral parietal cortex associated with increased activation in (i) conjunction search and (ii) the working memory condition, compared to standard preview search, linked to increased top-down excitation in SSoTS. These data suggest that top-down inhibition may play a driving role in generating efficient preview search compared with less efficient search conditions (conjunction search and preview search with a working memory load). Top-down activation, on the other hand, appears to play a greater role in inefficient search (conjunction search, preview search with a working memory load) than in efficient preview search. This may reflect the more prolonged search taking place, which enables a greater role for top-down excitation, for the target, to emerge. The analysis demonstrates that the model-based analysis can help to identify the functional role of different brain regions in search, providing a more accurate account of the neural substrates of visual selection.
Finally it should be noted that, relative to the neuronal structures controlling attention and search in the human brain, the sSoTS model is very simplistic. For example, in a more realistic model, the top-down modulation of excitation and inhibition would come from external neurons, whose own operation should vary according to the neurotransmitter functions involved. In addition input coming into the maps should more accurately reflect the properties of neurons in earlier visual areas, there would be topological organization within feature and location maps, and local grouping in addition to global inhibitory or excitatory modulation. It will be both important and interesting to explore the functional consequences of adding in these extra factors. For now, however, the results indicate the utility of even a simple model for pulling apart functionally distinct activations at a neural level.
Acknowledgments
References
1. Mavritsaki, E., D. Heinke, G.W. Humphreys, and G. Deco, J.Phys.Paris100
(2006).
2. Watson, D. and G. Humphreys, Psych. Rev.104 (1997).
3. Humphreys, G.W., D.G. Watson, and P. Joliceour, J. Exp. Psych.: HPP28 (2002).
4. Miller, E.K., Pre-frontal cortex and the neural basis of executive function.
Attention space and Action: Studies in cognitive neuroscience, ed. G.W. Humphreys, J. Duncan, and A. Treisman (Oxford University Press, 1998). 5. Corbetta, M., J.M. Kincade, J.M. Ollinger, M.P. McAvoy, and G.L. Shulman,
Nat. Neur. 3, 3 (2002).
6. Pollmann, S., R. Weidner, G. Humphreys, C. Olivers, K. Muller, and G. Lohmann, NeuroImage 18, (2003).
7. Olivers, C.N.L., S. Smith, P.M. Matthews, and G.W. Humphreys, Hum. Br.Map.24 (2005).
8. Allen, H., G.W. Humphreys, and P.M. Matthews, J Exp. Psych.: HPP Psychology: Human Perceptionand Performance 34, 2 (2008).
9. Heinke, D. and G.W. Humphreys, Comp. Vis. Im. Und. 100, 1/2 (2005). 10. Deco, G. and J. Zihl, Visual Cognition 8, 1 (2001).
11. Itti, L. and C. Koch, Vision Research 40 (2000).
12. Mozer, M.C. and M. Sitton, Computational modelling of spatial attention, in
Attention, ed. Pashler (1998).
13. Deco, G. and E. Rolls, Journal of Neurophysiology 94 (2005).
14. Mavritsaki, E., D. Heinke, G. Humphreys, and G. Deco, Neurocomputing 70 (2007).
15. Brunel, N. and X. Wang, J. Comp. Neur. 11 (2001).
16. Watson, D., G. Humphreys, and C. Olivers, Tr. Cogn. Sc. 7, 4 (2003). 17. Madison, D. and R. Nicoll, J.Phys.345 (1984).
18. Agter, A. and M. Donk, J. Exp. Psych.:HPP 31 (2005).
19. Allen, H.A., G.W. Humphreys, and H. Bridge, Vis. Res. 47, 6 (2007). 20. Braithwaite, J.J. and G.W. Humphreys, Perc. Psychoph. 65 (2003). 21. Friston, K.J., J. P., and R. Turner, Hum. Br.Map. 1 (1994).
22. Gorchs, S. and G. Deco, NeuroImage 21 (2004). 23. Glover, G.H., NeuroImage 9 (1999).