Discomfort from urban scenes: metabolic consequences
An T. D. Le1, Jasmine Payne1, Charlotte Clarke1, Kelly A. Murphy1, Francesca Prudenziati1, Elise Armsby1, Olivier Penacchio2 and Arnold J. Wilkins1
1. Department of Psychology, University of Essex
2. School of Psychology and Neuroscience, University of St Andrews
Keywords: visual discomfort, architecture, haemodynamic response, metabolism
Address for correspondence
Arnold J. Wilkins
Department of Psychology University of Essex
Colchester CO43SQ
Tel 01223812537 Fax 01206873590
Certain statistical properties of images are responsible for visual discomfort
These properties are prevalent in images of the modern urban environment
The discomfort is associated with inefficient neural processing and a large metabolic demand
Abstract 1
Scenes from nature share in common certain statistical properties. Images with 2
these properties can be processed efficiently by the human brain. Patterns with 3
unnatural statistical properties are uncomfortable to look at, and are processed 4
inefficiently, according to computational models of the visual cortex. Consistent 5
with such putative computational inefficiency, uncomfortable images have been 6
demonstrated to elicit a large haemodynamic response in the visual cortex, 7
particularly so in individuals who are predisposed to discomfort. In a succession 8
of five small-scale studies, we show that these considerations may be important 9
in the design of the modern urban environment. In two studies we show that 10
images from the urban environment are uncomfortable to the extent that their 11
statistical properties depart from those of scenes from nature. In a third study 12
we measure the haemodynamic response to images of buildings computed as 13
having unnatural or natural statistical properties, and show that in posterior 14
brain regions the images with unnatural statistical properties (often judged 15
uncomfortable) elicit a haemodynamic response that is larger than for images 16
with more natural properties. In two further studies we show that judgments of 17
discomfort from real scenes (both shrubbery and buildings) are similar to those 18
from images of the scenes. We conclude that the unnatural scenes in the 19
modern urban environment are sometimes uncomfortable and place excessive 20
demands on the neural computation involved in vision, with consequences for 21
brain metabolism, and possibly also for health. 22
*Blinded Manuscript with No Author Identifiers
Scenes from nature have in common the characteristic that their gross aspects have 23
a higher contrast than the fine detail. In mathematical terms, the Fourier amplitude 24
spectrum decreases approximately as the reciprocal of the spatial frequency, i.e. 25
approximately as 1/f (Field, 1987). The neural computation involved in sight is well-26
designed to take advantage of the 1/f characteristic (Field, 1987, 1994; Geisler 2008). 27
28
Images with unnatural amplitude spectra are judged uncomfortable to look at 29
(Fernandez & Wilkins, 2008; Juricevic, Land, Wilkins, & Webster, 2010; Penacchio & 30
Wilkins, 2015b). Such uncomfortable stimuli include the patterns of repetitive stripes 31
that are commonplace in the modern urban environment. Computational models of 32
the visual cortex by Hibbard & O'Hare (2014) and Penacchio, Otazu, Wilkins & Harris 33
(2016) suggest that such uncomfortable repetitive patterns render the firing of 34
cortical neurons less “sparse”, increasing the overall firing rate, with the potential of 35
raising metabolism in consequence. Indeed, there is growing evidence for a raised 36
metabolism in so far as uncomfortable stimuli trigger a strong haemodynamic 37
response in the visual cortex. Huang, Cooper, Satana, Kaufman & Cao (2003) used 38
functional magnetic resonance imaging (fMRI) and measured the blood oxygen level 39
dependent (BOLD) response to achromatic gratings with a range of spatial 40
frequencies. Contrast sensitivity is maximal at mid spatial frequencies and Huang et 41
al showed that high contrast gratings with mid spatial frequency (which are 42
uncomfortable) gave the largest BOLD response. Haigh et al. (2013) used near 43
infrared spectroscopy (NIRS) over the visual cortex and measured the 44
stripes gave a larger oxyhaemoglobin response if they had large differences in their 46
component colours and were therefore uncomfortable to view. 47
48
Individuals differ in susceptibility to visual discomfort, and those individuals who are 49
relatively susceptible show a larger haemodynamic response than those who are less 50
so. This has been demonstrated in several studies involving patients with migraine 51
but also those without. Thus Huang et al. (2003) demonstrated that patients with 52
migraine report both discomfort and perceptual distortion when viewing gratings, 53
and show an abnormally large BOLD response to such stimuli. Martín et al. (2011) 54
compared 19 patients with migraine and 19 controls. Patients with migraine had a 55
larger number of activated occipital voxels in response to lights than did controls. 56
Cucchiara, Datta, Aguirre, Idoko, and Detre (2014) found that in migraine patients 57
who experienced aura the number of symptoms of discomfort they reported by 58
questionnaire correlated with the amplitude of the BOLD response to visual 59
stimulation. 60
61
Although the studies reviewed in the above paragraph concerned patients with 62
migraine, the relationship between discomfort and the size of the haemodynamic 63
response occurs independently of this diagnosis. Thus, Alvarez-Linera et al. (2006) 64
compared 20 photophobic patients with 20 controls who viewed a light source at 65
various intensities. There was a direct relationship between stimulus intensity and 66
the size of the BOLD response, and the response was larger in the photophobic 67
individuals. Finally Bargary, Furlan, Raynham, Barbur & Smith (2015) compared 68
identified the orientation of a Landolt C surrounded by peripheral sources of glare. 70
The group that was sensitive to discomfort glare had a larger BOLD response 71
localized at three discrete bilateral cortical locations: in the cunei, the lingual gyri 72
and in the superior parietal lobules. In conclusion, both in terms of the visual stimuli 73
and in terms of the people they affect, uncomfortable visual stimuli are associated 74
with a large haemodynamic response. 75
76
The visual stimuli that are uncomfortable can be quantified mathematically. As 77
shown by Fernandez & Wilkins (2008) and Penacchio & Wilkins (2015) they differ 78
from natural images in having an excess contrast energy at mid-range spatial 79
frequencies. The excess is relative to the energy expected on the basis of the 80
reciprocal relationship between Fourier amplitude and spatial frequency typical of 81
natural scenes (1/f). This characteristic is common in images from the urban 82
environment, and it is this visual aspect of the environment that we explore with a 83
series of five small-scale studies. 84
85
In the first two studies we show that photographs of certain buildings are 86
consistently rated as uncomfortable and have an excess of energy at mid spatial 87
frequencies relative to that expected from 1/f. (Spatial frequency refers here to the 88
spatial repetition of contours on the retina and is therefore determined both by the 89
size of the pattern and the distance from which it is viewed.) In a third study we 90
show that observation of photographs with the statistical properties of unnatural 91
images elicits a larger haemodynamic response than for other images, consistent 92
further studies we show that photographs of scenes are a good surrogate for the 94
scenes themselves: the ratings observers make when looking at buildings or trees 95
and shrubs correlate strongly with those made when observing photographs of the 96
same scenes. The implication of these studies is that the design of the urban 97
environment is such as to render the neural computation involved in vision more 98
Studies 1 and 2: Images of buildings 100
Procedure 101
Un-posed images of urban scenes were obtained by the simple expedient of standing 102
at the side of a curb and aiming a camera across the street, angled so as to capture 103
as much as possible of the facade of the building opposite from a distance of 5-12m. 104
A Sony α-390 DSLR camera (without a zoom) was used and the viewing angle of the 105
camera was estimated from technical literature to be about 50 degrees. The images 106
were 960 pixels wide by 720 pixels high. Figure 1 shows maps of the locations where 107
the photographs were obtained, and Figure 2 a sample of 25 such images. 108
INSERT FIGURES 1 AND 2 ABOUT HERE 109
The images were divided into two sets, one set for each study, each set consisting of 110
74 different photographs presented in random order on the 344mm x 194 mm 111
screen of an Acer Aspire 5734Z laptop computer from a viewing distance of 0.6m, at 112
which distance they were 18 degrees high. Each image was presented until the 113
observer had given a rating and they were encouraged to do so within 10s. 114
Observers were asked to rate the images on a 7-point Likert scale with 1 labelled 115
“Very Comfortable” and 7 labelled “Very Uncomfortable”. 116
Participants 117
Students at the University of Essex (12 males and 8 females aged 19 - 28) observed 118
each of the images and gave a rating. Ten different students took part in Study 1 and 119
10 in Study 2, which was a replication. 120
Results 122
The images differed significantly with respect to the ratings they received (Study 1: 123
F(73, 657) = 3.00, p < .001, η2 = .25; Study 2: F(73, 657) = 6.39, p < .001, η2 = .41). 124
Cronbach’s alpha between raters was 0.67 in Study 1 and 0.84 (“good”) in Study 2. 125
Image analyses 126
The images were analysed using the algorithm described by Penacchio & Wilkins 127
(2015). In their paper the studies are numbered 4 and 5. The algorithm measured 128
how closely each image approximated a natural image in respect of the shape of the 129
two-dimensional Fourier transform. In images from the natural world the amplitude 130
of the spectrum decreases with increasing spatial frequency approximately as 1/f, so 131
that on log-log coordinates the spectrum approximates a cone in shape, with a slope 132
of -1. By varying the height of the cone, the algorithm obtained the best fit to the 133
Fourier transform of each image and weighted the residuals by a contrast sensitivity 134
function sourced from the literature, see Figure 3. The monitors were not gamma-135
corrected, but such correction typically affected the slope of the spectral power 136
distribution by less than 2%. The contrast sensitivity function had a peak at 7 137
cycles/degree and was reduced to 78% of its peak value at spatial frequencies of 3.5 138
and 14 degrees, so variation in spatial frequency over a factor of about two, such as 139
occurred with the variation in viewing angle was of little consequence. The sum of 140
the weighted residuals correlated 0.60 with the ratings of discomfort from images 141
used in Study 1 and 0.53 with those in Study 2. In other words, in both studies the 142
algorithm explained more than 25% of the variance in the judgments of discomfort: 143
the shape of the cone so as to accommodate the orientation anisotropy in images 145
made little difference to the ability of the model to predict discomfort, see 146
Penacchio & Wilkins (2015). 147
148
In the next experiment participants observed a subset of the images of buildings 149
while the cortical haemodynamic response was measured. 150
INSERT FIGURE 3 ABOUT HERE 151
Study 3: Haemodynamic response to images of buildings 152
Participants. 153
Twenty-six volunteers from the general population and from the University of Essex 154
served as participants. There were 4 males and 22 females, aged 18 – 53 (M = 26.4, 155
SD = 11.6) 156
Stimuli and Apparatus. 157
Using the algorithm from Penacchio & Wilkins (2015), the residual score for each of 158
the 148 images in Studies 1 and 2 was calculated and the images were divided about 159
the median score into two groups, 10 images with high residuals (median rank 32.5, 160
range 2-46) and 10 with low (median rank 108, range 71-125). As might be expected, 161
the images with high residuals were largely those judged to be uncomfortable, and 162
the images with low residuals were largely those judged comfortable. Nevertheless, 163
the segregation of images was on the basis of their statistical structure and was 164
therefore entirely objective. 165
The stimuli were presented on an UltraSharp 2408WFT 24” LCD monitor (60Hz 167
refresh rate) resolution 1920 x 1200. At the viewing distance of 0.7m the height of 168
the screen subtended 28.5 degrees. At the 50% brightness level used, the white 169
screen had a luminance of 101cd.m-2. 170
NIRS procedure. 171
The cortical haemodynamic responses to each image were measured using near 172
infrared spectroscopy (NIRS). An 8-channel NIRS system was used (MK II; Artinis 173
Medical Systems BV, Zetten, The Netherlands). The optode placement for the 174
posterior channels included two receivers and six transmitters. The optodes for the 175
receivers were placed 30mm from either side of the midline 20mm above the inion. 176
For the left hemisphere, three transmitters were placed 35mm from the receiver, 177
above, to the left and obliquely at 45°. The symmetrically equivalent placement was 178
used for the right hemisphere. The frontal channels included two receivers and two 179
transmitters, in which the receivers covered positions FP1 and FP2 of the 10-20 180
system of electrode placement. Both transmitters were placed 35mm above their 181
respective receiver. This was a close replication of the configurations used by Haigh 182
et al. (2013). 183
184
The participants were asked simply to observe the images whilst keeping movement 185
to a minimum. A PowerPoint slideshow presented each stimulus for 16 seconds in a 186
fixed random order. Grey slides were used to separate the stimuli, and the inter-187
Data analysis 189
To calculate the oxygenated haemoglobin concentration, a differential path length 190
factor (DPF) of 6.26 was used (Duncan et al., 1996). The raw signal was filtered with a 191
running median of 31 samples to remove cardiac artefacts. The detrend function in 192
MATLAB© was applied to remove any systematic drift in the signal. The 193
deoxyhaemoglobin signals were small relative to the oxyhaemoglobin signals. They 194
were negatively correlated, and significantly so (r(23) = -.57, p < .01). For this reason 195
only the oxyhaemoglobin responses were used in the subsequent analyses, following 196
Haigh et al. (2013). 197
The haemodynamic response amplitude was measured in terms of the difference 198
between the average of the signal during the last 10s of stimulus presentation and 199
the average 10s before stimulus onset. Some channels did not record a good signal, 200
often because hair obscured the optodes. Channels were therefore accepted for 201
analysis only if the amplitude of the haemodynamic response was greater than the 202
standard deviation of the signal during baseline, following Haigh et al. (2013). 203
Results 204
Twenty-five participants had at least one acceptable posterior channel (the average 205
number of acceptable channels per participant was 4.4). The signal was stronger in 206
posterior than frontal channels. Indeed in only five of the 25 participants were the 207
data from frontal channels acceptable. In these five participants the overall 208
amplitude for frontal channels (M = 0.10μM, SD = 0.10) was smaller than for 209
posterior channels (M = 0.35μM, SD = 0.27), though not significantly so because of 210
212
The effects of the visual stimuli were analysed only for the posterior channels. The 213
average amplitude for all such channels for each participant was obtained, separated 214
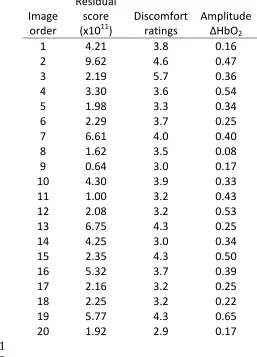
by image category. Figure 4 and Table 1 show, the residual score from the model by 215
Penacchio & Wilkins (2015), the discomfort rating (from Studies 1 and 2), and the 216
average amplitude of the oxyhaemoglobin response across participants. 217
INSERT FIGURE 4 AND TABLE 1 ABOUT HERE 218
A repeated-measures ANOVA with image category as main effect revealed that 219
images with high residual scores induced a significantly larger haemodynamic 220
response in the occipital areas, mean 0.40μM (SD 0.29), compared to images with 221
low residuals, mean 0.28μM (SD 0.17), F(1, 24) = 4.73, p < .05, MSE = 0.04, η2 = 0.17. 222
Figure 5 shows the average oxyhaemoglobin response for images with high and 223
images with low residual scores. 224
INSERT FIGURE 5 ABOUT HERE 225
The above analysis separated images on the basis of residuals, however it was also 226
important to separate images by discomfort rating. This is because some images 227
might have high residuals yet low discomfort rating (and vice versa), and indeed 228
when separating images by perceived discomfort (as assessed in Studies 1 and 2) 229
four images were re-categorised (relative to the previous grouping). Again, a 230
repeated-measures ANOVA with image category as main effect was conducted. The 231
results showed revealed that uncomfortable images, mean 0.40μM (SD = 0.28) 232
induced a significantly larger haemodynamic response in the occipital areas 233
compared to comfortable images mean 0.29μM (SD = 0.19), F(1, 24) = 5.40, p < .05, 234
Interim Discussion 236
Images of building frontages with a high residual score gave rise to a haemodynamic 237
response of greater amplitude than did those images with a low score. When the 238
images were separated according to discomfort rating, the greater amplitude was 239
induced by uncomfortable images. These findings are consistent with other 240
evidence reviewed earlier that, in general, uncomfortable visual stimuli are 241
associated with a large haemodynamic response. The result demonstrates that 242
images from the modern urban environment are sufficiently un-natural (and 243
uncomfortable) to give a large haemodynamic response and that this response can 244
be predicted quite objectively from the statistical properties of the image. A 245
relatively large haemodynamic response is suggestive of a relatively large metabolic 246
load in the occipital areas and therefore consistent with the behaviour of 247
computational models of the visual cortex that indicate a less sparse and stronger 248
neural response to stimuli that are uncomfortable. It has been suggested that the 249
discomfort is a homeostatic response that acts to restore normal metabolism 250
(Wilkins, 2015). 251
The fact that certain images of buildings are rated as uncomfortable and give rise to 252
a large haemodynamic response suggests that there are aspects of the design of the 253
modern urban environment that may be sub-optimal. Before such an inference can 254
be made, however, it is necessary to demonstrate that photographs are an 255
appropriate surrogate for real scenes in this respect. To do so, we asked observers 256
Ratings of real scenes and photographs. 258
Study 4 259
Procedure 260
Eleven students from the University of Essex, aged 20-24, two with corrected vision, 261
acted as participants. The experimenter took the students on a walk around the 262
campus and asked the participant to stand at pre-arranged locations and directed 263
their gaze towards a particular view. The participants were required to rate the view 264
as to how “comfortable the scene was to look at” on an 11-point Likert scale, from -5 265
“very uncomfortable” through 0 (neutral) to +5 “very comfortable”. The participants 266
experienced the viewpoints in different orders. Ten “natural” views comprising 267
grass, shrubs and trees and 10 views of university buildings were presented in an 268
order that avoided successive presentation of more than two views within the two 269
above categories. Figure 6 shows examples of the scenes. 270
INSERT FIGURE 6 ABOUT HERE 271
At the end of the presentation the participants sat in front of the 15”screen of a 272
laptop computer, resolution 1440x900 pixels. At the viewing distance of about 0.5m, 273
the screen subtended 22 degrees vertically. Colour photographs of the 20 scenes 274
taken with a Canon PowerShot SX530 camera with an estimated 40degree field of 275
view (vertical) were presented for 16s on the screen in a fixed random order using 276
PowerPoint, and the participant was asked to rate the photographs on the same 11-277
point Likert scale. 278
Results 280
There were no significant differences in mean ratings for the views and for the 281
photographs. The correlation between the ratings of a view and of its photograph 282
was r = .89, p < .001, suggesting that photographs induced similar levels of 283
(dis)comfort relative to the real scene. There was a good consistency between 284
observers: the average correlation between an individual observer’s ratings and the 285
mean rating (and standard deviation) for the group was 0.79 (0.18) for views and 286
0.72 (0.14) for photographs. The ratings differed significantly between buildings ,-287
0.77 (1.44) and shrubbery, 2.38 (1.25), t(9) = 9.84, p < .001, d = 2.3. Separating the 288
images by category revealed that there was a significant correlation between a scene 289
and its photograph for buildings, r = .75, p < .05, but not for grass shrubs and trees, r 290
= .58, p = .078. 291
Study 5 (Replication) 292
The procedure was the same as that for Study 4 except that 10 different students 293
(six females and four males) of similar age (average 22 years) served as participants, 294
and the photographs were presented on the 21.5” screen of a laptop computer with 295
a resolution of 1920x1200 pixels. At the viewing distance of about 50cm the screen 296
subtended 23 degrees (vertical). 297
298
Results 299
As before, there were no significant differences in mean ratings for the views and for 300
the photographs, and the ratings were similarly consistent. Again, there was a strong 301
.05. The mean ratings differed significantly between buildings -0.6 (1.50) and 303
shrubbery, 1.27 (1.26), t(9) = 5.95, p < .001, d = 1.4. Again, separating the images by 304
category revealed that there was a significant correlation between a scene and its 305
photograph for buildings, r = .74, p < .05, but not for grass, shrubs and trees, r = .40, 306
p = .253. 307
308
Discussion 309
We have shown that images of the modern urban environment are sometimes 310
uncomfortable and that this discomfort can be predicted from the unnatural 311
statistical properties of the image. We have demonstrated that images of buildings 312
with unnatural statistical properties are associated with a relatively large 313
haemodynamic response in the visual cortex, as is the case with other 314
uncomfortable visual stimuli. The larger haemodynamic response is consistent with 315
inefficient neural processing and with a greater metabolic load in consequence. We 316
have shown that views of buildings are rated as comfortable or uncomfortable in 317
much the same way as photographs of those views (notwithstanding the differences 318
in viewing angle) and thereby demonstrated that our findings have implications for 319
the design of the urban environment. In essence, the repetitive patterns in modern 320
architecture are unnatural, and in consequence they give rise to discomfort and a 321
higher metabolic demand on the visual cortex, consistent with neural processing that 322
may be relatively inefficient. 323
It might be argued that the present findings are secondary to effects of emotional 325
valence for example, the student attitude to the buildings in their university in 326
Studies 4 and 5 cannot easily be separated from their more general attitude to the 327
university as an institution. However, these effects cannot explain the results of 328
Experiments 1 and 2 and 3 in which the images of buildings were likely to have been 329
unfamiliar to all participants. In these experiments there was nothing to indicate that 330
the uncomfortable images were attended to any differently from those that were 331
more comfortable. 332
333
It is possible that some of the effects are attentional and arise because discomfort 334
attracts attention to or deflects it from an image. They may also be emotional in so 335
far as discomfort may give rise to an emotional response. This is of particular 336
relevance in Study 3 because attention and emotion are known to affect the 337
haemodynamic response, e.g. Henson & Mouchlianitis (2007). We measured the 338
response from posterior head regions and therefore from superficial layers of the 339
visual cortex. fMRI studies have shown strong attentional effects on the 340
haemodynamic responses of human primary visual cortex (e.g. Ghandi et al., 1999). 341
Although attention and emotion may have mediated the effects of image structure 342
on the amplitude of the haemodynamic responses observed in Study 3, it is likely to 343
be because of the discomfort, given the findings of our other studies, and the 344
convergence in the literature reviewed in the introduction. 345
346
Studies of aesthetics in urban design (Nasar, 1994), have already appreciated the 347
improving the aesthetics of urban streetscapes (Gjerde, 2011). Visual discomfort has 349
been discussed from the point of view of lighting design (Steemers, 1994) but until 350
recently is has not been possible to find a numerical expression for discomfort from 351
visual aspects of building structure. Discomfort can be predicted from simple 352
mathematical properties of the visual image (Penacchio & Wilkins, 2015), and here 353
we show that these properties are of importance for brain metabolism. 354
355
Some of the beneficial effects of green exercise (Pretty, Griffin, & Sellens, 2004; 356
Pretty, Peacock, Sellens, & Griffin, 2005) may arise because natural scenery avoids 357
the repetitive patterns common in the urban environment. 358
360
References 361
362
Alvarez-Linera, P. J., Ríos-Lago, M., Martín-Alvarez, H., Hernández-Tamames, J. A., 363
Escribano-Vera, J., & Sánchez del Río, M. (2006). [Functional magnetic 364
resonance imaging of the visual cortex: relation between stimulus intensity 365
and bold response]. Revista de Neurologia, 45(3), 147-151. 366
Bargary, G., Furlan, M., Raynham, P. J., Barbur, J. L., & Smith, A. T. (2015). Cortical 367
hyperexcitability and sensitivity to discomfort glare. Neuropsychologia, 69, 368
194-200. doi: 10.1016/j.neuropsychologia.2015.02.006 369
Cucchiara, B., Datta, R., Aguirre, G. K., Idoko, K. E., & Detre, J. (2014). Measurement 370
of visual sensitivity in migraine: Validation of two scales and correlation with 371
visual cortex activation. Cephalalgia, 35(7), 585–592. doi: 372
10.1177/0333102414547782 373
Duncan, A., Meek, J. H., Clemence, M., Elwell, C. E., Fallon, P., Tyszczuk, L., . . . Delpy, 374
D. T. (1996). Measurement of cranial optical path length as a function of age 375
using phase resolved near infrared spectroscopy. Pediatric Research, 39(5), 376
889-894. doi: 10.1203/00006450-199605000-00025 377
Fernandez, D., & Wilkins, A. J. (2008). Uncomfortable images in art and nature. 378
Perception, 37(7), 1098-1113. doi: 10.1068/p5814 379
Ghandi, S.P., Heeger, D.J. & Boynton, G.M. Spatial attention affects brain activity in 380
human primary visual cortex. Proc. Natl. Acad. Sci. USA 96,3314–3319. 381
Geisler, W.S. (2008). Visual perception and the statistical properties of natural 382
Gjerde, M. (2011). Visual evaluation of urban streetscapes: How do public 384
preferences reconcile with those held by experts? Urban Design 385
International, 16(3), 153-161. doi: 10.1057/udi.2011.10 386
Haigh, S. M., Barningham, L., Berntsen, M., Coutts, L. V., Hobbs, E. S., Irabor, J., . . . 387
Wilkins, A. J. (2013). Discomfort and the cortical haemodynamic response to 388
coloured gratings. Vision Research, 89, 47-53. doi: 389
10.1016/j.visres.2013.07.003 390
Henson, R.N. & Mouchlianitis, E. (2007). Effect of spatial attention on stimulus-391
specific haemodynamic repetition effects. Neuroimage, 35, 1317-1329. 392
Hibbard, P. B., & O'Hare, L. (2014). Uncomfortable images produce non-sparse 393
responses in a model of primary visual cortex. Royal Society Open Science,2, 394
140535. 395
Huang, J., Cooper, T. G., Satana, B., Kaufman, D. I., & Cao, Y. (2003). Visual distortion 396
provoked by a stimulus in migraine associated with hyperneuronal activity. 397
Headache, 43(6), 664-671. doi: 10.1046/j.1526-4610.2003.03110.x 398
Martín, H., del Río, M. S., de Silanes, C. L., Álvarez‐Linera, J., Hernández, J. A., & 399
Pareja, J. A. (2011). Photoreactivity of the occipital cortex measured by 400
functional magnetic resonance imaging–blood oxygenation level dependent 401
in migraine patients and healthy volunteers: pathophysiological implications. 402
Headache: The Journal of Head and Face Pain, 51(10), 1520-1528. doi: 403
10.1111/j.1526-4610.2011.02013.x 404
Nasar, J. L. (1994). Urban design aesthetics the evaluative qualities of building 405
exteriors. Environment and Behavior, 26(3), 377-401. doi: 406
Penacchio, O., Otazu, Z., WIlkins, A. J., & Harris, J. M. (2016). Uncomfortable images 408
prevent lateral interactions in the cortex from providing a sparse code. 409
Perception, in press. 410
Penacchio, O., & Wilkins, A. J. (2015). Visual discomfort and the spatial distribution 411
of Fourier energy. Vision Research, 108, 1-7. doi: 412
10.1016/j.visres.2014.12.013 413
Pretty, J., Griffin, M., & Sellens, M. (2004). Is nature good for you? Ecos, 24, 2-9. 414
Pretty, J., Peacock, J., Sellens, M., & Griffin, M. (2005). The mental and physical 415
health outcomes of green exercise. International Journal of Environmental 416
Health Research, 15(5), 319-337. doi: 10.1080/09603120500155963 417
Steemers, K. (1994). Daylighting design: enhancing energy efficiency and visual 418
quality. Renewable Energy, 5(5-8), 950-958. doi: 10.1016/0960-419
1481(94)90116-3 420
Sullivan, W. C., & Lovell, S. T. (2006). Improving the visual quality of commercial 421
development at the rural–urban fringe. Landscape and Urban Planning, 77(1-422
2), 152-166. doi: 10.1016/j.landurbplan.2005.01.008 423
Wilkins, A. J. (2015). A physiological basis for visual discomfort: Application in lighting 424
design. Lighting Research and Technology, 48(1), 44-54. doi: 425
10.1177/1477153515612526 426
Table 1. Experiment 3: residual score, discomfort ratings and average amplitude of 428
the oxyhaemoglobin response in order of stimulus presentation. 429
430
Image order
Residual score (x1011)
Discomfort ratings
Amplitude ΔHbO2
1 4.21 3.8 0.16
2 9.62 4.6 0.47
3 2.19 5.7 0.36
4 3.30 3.6 0.54
5 1.98 3.3 0.34
6 2.29 3.7 0.25
7 6.61 4.0 0.40
8 1.62 3.5 0.08
9 0.64 3.0 0.17
10 4.30 3.9 0.33
11 1.00 3.2 0.43
12 2.08 3.2 0.53
13 6.75 4.3 0.25
14 4.25 3.0 0.34
15 2.35 4.3 0.50
16 5.32 3.7 0.39
17 2.16 3.2 0.25
18 2.25 3.2 0.22
19 5.77 4.3 0.65
20 1.92 2.9 0.17
Figure Legends 433
434
Figure 1. Locations of buildings photographed. Top: London; Left centre: 435
Birmingham; Right centre: Norwich; Bottom left: Ipswich; Bottom right: Cambridge 436
437
Figure 2. Thumbnails of the first 25 images presented in Study 1. 438
439
Figure 3. Schematics of the computational metric of discomfort defined in Penacchio 440
and Wilkins 2015. (a) Amplitude spectrum of one of the images in the study in log-441
log coordinates. The horizontal plane corresponds to the two-dimensional Fourier 442
frequency domain and the vertical dimension to the (log) of the amplitude spectrum. 443
(b) Set of circular regular 1/f cones (hence, with a slope of -1 in log-log coordinates) 444
with different values for the gain. (c) Best fit amongst the set of circular regular 445
cones in (b) to the amplitude spectrum shown in (a). (d) Residuals with respect to 446
the best fit shown in (c). 447
448
Figure 4. (a) Scatter plot of the average amplitude of the oxyhaemoglobin response 449
against the average residual score in Experiment 3. (b) Scatter plot of the average 450
amplitude of the oxyhaemoglobin response against the average discomfort rating in 451
Experiment 3. The black lines are illustrative and correspond to a linear least mean 452
square fit. 453
454
Figure 5. Oxyhaemoglobin response to images of buildings with high and low residual 455
to view in Studies 1 and 2. Eight of the 10 images with low residual scores were 457
judged comfortable. 458
459
Figure 6. Examples of views used in Studies 4 and 5. 460
Figure
Figure
Figure
Figure
Figure
Figure