R E S E A R C H
Open Access
Integrated analysis of omics data using
microRNA-target mRNA network and PPI
network reveals regulation of Gnai1
function in the spinal cord of
Ews/Ewsr1
KO mice
Chai-Jin Lee
1, Hongryul Ahn
2, Sean Bong Lee
4, Jong-Yeon Shin
5, Woong-Yang Park
6, Jong-Il Kim
5, Junghee Lee
7,8,
Hoon Ryu
7,8,9*and Sun Kim
1,2,3*The
5th Translational Bioinformatics Conference (TBC 2015)
Tokyo, Japan. 7-9 November 2015
Abstract
Background:Multifunctional transcription factor (TF) geneEWS/EWSR1is involved in various cellular processes such as transcription regulation, noncoding RNA regulation, splicing regulation, genotoxic stress response, and cancer
generation. Role of a TF gene can be effectively studied by measuring genome-wide gene expression, i.e., transcriptome, in an animal model ofEws/Ewsr1knockout (KO). However, when a TF gene has complex multi-functions, conventional approaches such as differentially expressed genes (DEGs) analysis are not successful to characterize the role of theEWS gene. In this regard, network-based analyses that consider associations among genes are the most promising approach.
Methods:Networks are constructed and used to show associations among biological entities at various levels, thus different networks represent association at different levels. Taken together, in this paper, we report contributions on both computational and biological sides.
Results:Contribution on the computational side is to develop a novel computational framework that combines miRNA-gene network and protein-protein interaction network information to characterize the multifunctional role of EWSgene. On the biological side, we report that EWS regulates G-protein,Gnai1, in the spinal cord ofEws/Ewsr1KO mice using the two biological network integrated analysis method. Neighbor proteins ofGnai1, G-protein complex subunitsGnb1, Gnb2andGnb4were also down-regulated at their gene expression level. Interestingly, up-regulated genes, such asRgs1andRgs19, are linked to the inhibition ofGnai1activities. We further verified the altered expression of Gnai1 by qRT-PCR inEws/Ewsr1KO mice.
Conclusions:Our integrated analysis of miRNA-transcriptome network and PPI network combined with qRT-PCR verifies that Gnai1 function is impaired in the spinal cord ofEws/Ewsr1KO mice.
Keywords:EWS, Ewsr1, Gnai1, MMIA, PPI, Network analysis
* Correspondence:[email protected];[email protected]
7VA Boston Healthcare System, Boston, MA 02130, USA
1Interdisciplinary Program in Bioinformatics, Seoul National University, Seoul 151-747, Republic of Korea
Full list of author information is available at the end of the article
Background
Ewing sarcoma is the second most common bone and soft tissue tumor that predominantly afflicts children and adolescents [1–3]. Understanding biological mecha-nisms underlying this tumor is critical to the identifica-tion of new cancer therapy targets. The Ewing sarcoma gene (EWS)/EWS RNA-Binding Protein 1 (EWSR1), a transcription factor, encodes an RNA binding protein whose specific functional targets are still largely un-known [4]. In previous studies, fusion genes such as, EWS-FLI-1, EWSR1-WT1, EWSR1-KLF17, EWSR1-ATF1, and EWSR1-CREB3L1, are known to be produced by re-arrangement of theEWSR1gene with different gene fu-sion partners and these fufu-sion genes have functions related to a variety of soft tissue tumors [5–9]. To characterize functions of EWS, we used RNA-seq gene expression data and miRNA expression data measured by using the spinal cord samples of Ews/Ewsr1 knock-out (KO) mouse and wild type.
Motivation
Multi-function genes interact with a number of coding and non-coding genes and perform a variety of functions depending on cell conditions and tissue types. Multi-function geneEWSR1 is known to regulate Droshaand microRNAs that inhibits RNA splicing [10, 11]. How-ever, it is still unknown which genes are regulated by and which biological functions are related toEWSR1. To characterize functions ofEWSR1, we used a well-known differentially expressed gene (DEG) set analysis. We performed functional analysis of top 200 up-regulated DEGs and top 200 down-regulated DEGs (2 % of the whole genes) using gene ontology (GO) and KEGG pathway. From the GO analysis, we found 322 genes of 400 top DEGs were involved in 44 GO terms in the GOTERM_BP_FAT category which is the summarized version of Biological Processes in the Gene Ontology (Additional file 1A). Top three GO terms with the lar-gest number of genes were ion transport, immune re-sponse, and homeostatic process. It is not clear how these three biological processes are related to EWS. In addition, we tried molecular function GO terms, which did not produce coherent biological functions related to EWS. From the KEGG pathway result, 93 of 400 genes hit 140 pathways. Only two pathways had more than 10 genes: metabolic pathway and cell adhesion molecules. Most of the pathways were not significant. Overall, GO and KEGG pathway analysis using DEGs did not produce meaningful clues on the role ofEWS.
For the analysis of miRNA expression data, it is not clear how to perform an integrated analysis of gene ex-pression data and miRNA exex-pression data. In addition, a multifunction gene can play roles at various levels such as transcription, gene regulation, translation and protein
activity level. To address this computational challenge, we developed a novel computational framework for the characterization ofEWSmultifunctional gene using gene expression data and miRNA expression data measured under a knockout condition of the multifunctional gene. The framework utilized microRNA-target gene network and Protein-Protein interaction (PPI) network and incor-porates the two networks in a workflow. The workflow of the framework can be viewed as an effort to model the role of EWS at various levels, DEG analysis at the transcription level, the microRNA-target gene network analysis at the gene regulation level, and PPI network analysis at the translation and protein activity level.
Methods
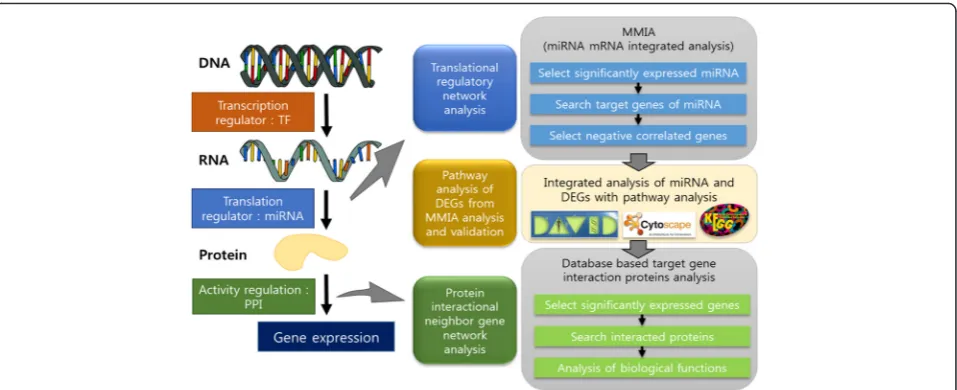
We developed a three-step pipeline for the integrated analysis of omics data using mRNA-microRNA network and protein-protein interaction network. We describe the workflow and computational methods used in each step in this section. Figure 1 illustrates the workflow of the proposed omics data analysis pipeline. In “Results” section, we discuss output from each step in detail.
Step 1. MicroRNA-target gene regulation network analysis
Input: gene expression data, miRNA expression data Output: differentially expressed miRNAs and their target genes
To investigate roles of EWS, we analyzed the transla-tional regulatory network. The microRNA-target gene integrated network analysis was performed following the strategy in MMIA [12].
Selection significantly expressed microRNAs
We selected significantly up- or down-regulated micro-RNAs in the Ews/Ewsr1 KO condition compared to the wild type condition. To select significantly differentially expressed miRNAs from microarray data, we used the SAM (significance analysis of microarrays) tool package [13] (More information in the detailed method section).
Prediction of microRNAs target genes
After selecting significantly expressed microRNAs, we predicted regulatory target genes of the selected differ-entially expressed microRNA by TargetScan [14] and miRDB [15, 16].
Reselection target genes by correlation
We further investigated miRNA and gene target rela-tionship by measuring negative correlation in expres-sion levels between miRNAs and genes targeted by miRNAs since up-regulated microRNA inhibits transla-tion of mRNA.
Step 2. Pathway analysis of DEGs from MMIA analysis and validation
Input: DEGs selected in Step 1
Output: important pathways related to EWS and key genes in the pathways
Differentially Expressed Gene (DEG) analysis
Differentially expressed genes (DEGs) analysis of NGS RNA-seq was performed in the following steps. First, adaptor sequences of reads in raw data were trimmed. The Ensembl mouse reference genome sequence was downloaded for mapping short reads. Bowtie [17] was used to build an index of the reference genome sequence for alignment. Trimmed reads were then mapped to the reference genome sequence using Tophat2 [18]. Finally, Cufflinks was used to calculate gene expression levels. We compared gene expression values and selected DEGs by using Cuffdiff in the Cufflinks package [19].
Integrated analysis of miRNA and mRNA expression data 15 differentially expressed miRNAs were found to target 4342 genes based on TargetScan and miRDB. To further screen target genes, we integrated miRNAs target infor-mation and mRNA-seq based gene expression levels. The negative correlation analysis reduced the number of targets to 1338 genes. The negative correlation analysis is based on the techniques in [20, 21]. The rationale for
the negative correlation analysis is that if a miRNA tar-gets a gene the expression levels of the miRNA and the gene should have negative correlation due to the regula-tory effect of miRNA on the target gene. These DEGs were then analyzed by GSEA (Gene Set Enrichment Analysis) using DAVID (The Database for Annotation, Visualization and Integrated Discovery) [22].
Pathway analysis
To characterize functions of selected target DEGs by nega-tive correlation in the spinal cord ofEws/Ewsr1KO mice, we performed biological pathway analysis using the KEGG mapper [23]. KEGG mapper highlighted DEGs with colors: up-regulated DEGs as red, down-regulated DEGs as blue, and other DEGs as light green. In addition, we performed additional pathway interpretation based on gene ontology by using ClueGO [24], a Cytoscape [25] plug-in, that ana-lyzes biological pathway interpretation with KEGG ontol-ogy (2014 latest version) to integrate Gene Ontolontol-ogy (GO) terms and KEGG/BioCarta pathways to generate a func-tionally organized GO/pathway term network.
Verification of Gnai1 expression by Quantitative real-time PCR (qRT-PCR)
To verify whether the expression of target genes is cor-related with the analysis, we performed qRT-PCR using RNA isolated from the spinal cords of Ews/Ewsr1 WT and KO mice.
Step 3. Protein-protein interaction network analysis
Input: Key genes identified in Step 2
Output: G protein complex genes and regulators
After selecting the key gene in Step 2, we investigated the biological functions of the genes by extending gene sets with neighboring genes of the key gene.
Selection significantly expressed gene
From gene set analysis (GSA) and pathway analysis (see the detailed methods section), we selected specific genes.
Search for proteins that interact with the selected gene Protein-protein interaction (PPI) analysis of genes neigh-boring the key gene was performed by using STRING (Search Tool for the Retrieval of Interacting Genes/Pro-teins) [26], the most widely used database of known and predicted protein interactions.
Analysis of biological functions
Relationship between the key gene and neighbor genes was investigated by performing the literature search. When we considered the relationship among genes, we also con-sidered the regulatory roles of genes, i.e., activators or re-pressors, if applicable. For the regulatory relationship, we considered gene expression change information.
Results
Analysis of multifunctionalEWSby using the network-based workflow
In this section, we present the result from each compu-tational step of the workflow (Fig. 1).
Step 1. Translational regulatory network analysis: MicroRNA-mRNA network
Selection of differentially expressed miRNAs
We selected 18 significantly expressed miRNAs from the total 1193 mouse miRNAs by SAM tool. 15 miRNAs ex-pression level were significantly up-regulated, and 3 miRNAs were down-regulated in the Ews/Ewsr1 KO mice against WT mice (Additional file 2). In the order of the significance score by SAM, 15 up-regulated miR-NAs are mmu-miR-127, mmu-miR-410, mmu-miR-433, miR-138, miR-181c, miR-382, 19b, 381, 666-3p, mmu-miR-376a, mmu-miR-873, mmu-miR-181a, mmu-miR-383, mmu-miR-181b, and mmu-miR-99b. Down-regulated 3 miRNAs were mmu-miR-1224, mmu-miR-9-3p, and mmu-miR-26a in the order of the significance score by SAM. Analysis of potential biological functions of these miRNAs was performed by using genes targeted
by the miRNAs (see the DEG analysis from RNA-seq data result section).
Prediction of target mRNA regulated by selected miRNA To perform the integrated analysis of miRNA and their target genes, we need to predict targets of miRNAs. Pre-dicted target genes of miRNAs were collected by using TargetScan and miRDB. 5,779 and 5,448 genes were pre-dicted by TargetScan and miRDB, respectively. 1,927 genes were targeted by multiple miRNAs in the predic-tion result of TargetScan, and 2,371 genes were multiply targeted according to miRDB. After discarding repeat-edly predicted genes, a total of 4,342 genes were pre-dicted as targets of 15 differentially expressed miRNAs. Only 36 % (1,587 genes) of predicted target genes were predicted by both TargetScan and miRDB. In other words, the genes targeted by each miRNAs of predic-tion results by TargetScan and miRDB do not agree much (Additional file 3). 4,342 target genes predicted by both TargetScan and miRDB were further analyzed by performing a negative correlation analysis to sort out potentially true miRNA-gene relationships (see the next section).
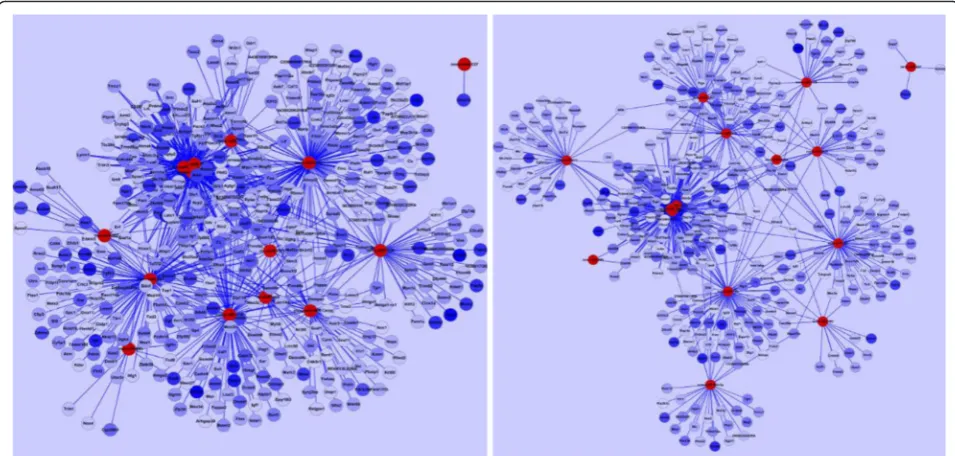
Negative correlation analysis of DEGs with DE microRNA Predicted target genes were further screened by consid-ering negative correlations in expression levels between miRNA and each of its target genes. The rationale for the negative correlation analysis is that miRNA degrades its target genes, thus a higher expression level of miRNA should result in a lower expression level of its target. We applied the same technique used in [14, 15]. Negatively correlated miRNA-mRNA interaction network of miR-NAs and their target DEGs were visualized by using Cytoscape (Fig. 2). In Fig. 2, significantly up-regulated 15 miRNAs are in red color, and negative correlated target DEGs are in blue color. Color intensity denoted the level of gene expression. As a result of the correl-ation analysis, 4,342 genes were reduced to 860 genes. Among the 860 DEGs, 339 target genes were targeted by multiple miRNAs.
Step 2. Pathway analysis of DEGs from MMIA analysis and validation
KEGG pathway analysis of DEGs gene set targeted by miRNA
We mapped the 860 negatively correlated DEGs to the KEGG pathway using the KEGG mapper. 201 pathways were hit by the negatively correlated DEGs. We se-lected 13 pathways with eight or more gene hits. Meta-bolic pathways, calcium signaling pathway, PI3K-Akt signaling pathway, axon guidance, pathways in cancer, MAPK signaling pathway, tight junction, dilated car-diomyopathy, circadian entrainment, proteoglycans in
cancer, regulation of actin cytoskeleton, cholinergic synapse and focal adhesion pathways were selected. Analysis of KEGG pathways of DEGs were highlighted in colors chosen by KEGG mapper. Blue color genes were down-regulated genes, and red color genes were up-regulated genes in the pathways of Ews/Ewsr1 KO mice (Additional file 4). Color intensity denoted the level of gene expression.
Gene ontology based network analysis
Networks of negatively correlated target DEGs in terms of KEGG ontology were generated using ClueGO (Fig. 3). “Cholinergic synapse pathway”term was highly clustered by down-regulated DEGs belonging pathways.
ECM-receptor interaction pathway, focal adhesion pathway, tight junction pathway, and action cytoskeleton regula-tion pathway were mostly correlated with selected down-regulated DEGs. Gnai1, which is most signifi-cantly down-regulated in the cholinergic synapse path-way, was selected for further investigation. More discussion on biological functions of these pathways is presented in the Conclusion section.
qRT-PCR of Gnai1
qRT-PCR was performed to confirm the difference of Gnai1 expression in the spinal cords ofEws/Ewsr1 WT and KO mice. Average gene expression levels of Gnai1 in Ews/Ewsr1 KO mice were significantly lower than
Fig. 3Venn diagram generated by ClueGO. ClueGO analyzes KEGG ontology of selected down-regulated genes which are targeted by up-regulated miRNA. Cholinergic synapse pathway is showed highly clustered by down-regulated gene pathways
those in Ews/Ewsr1 WT mice. This data validated that Gnai1 expression level was down regulated inEws/Ewsr1 KO mice (Fig. 4).
Step 3. Protein-protein interactions network analysis
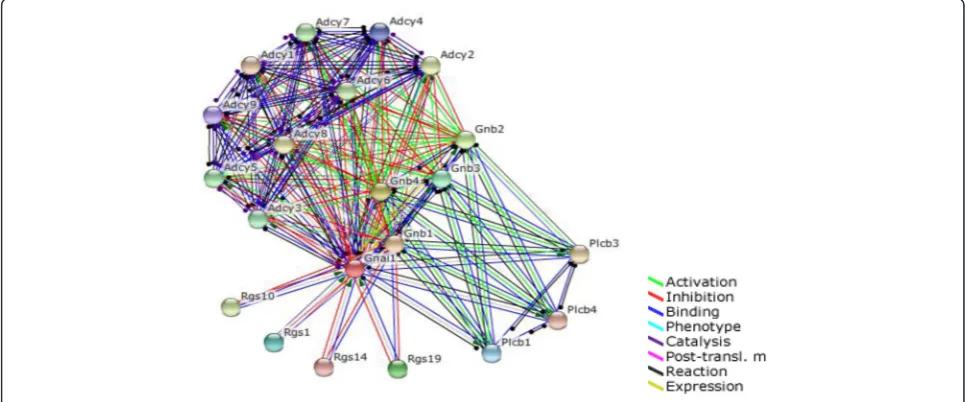
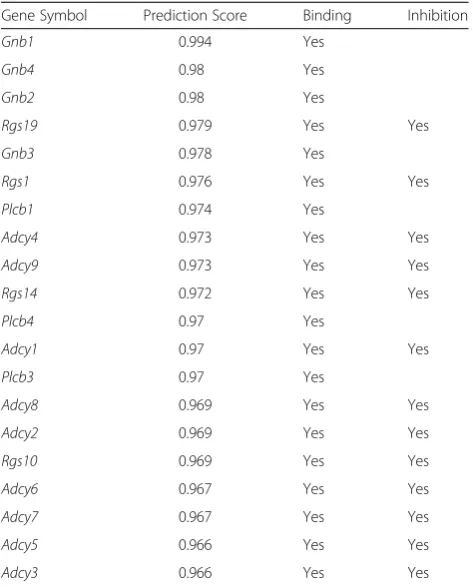
We selected Gnai1 that is down-regulated in cholinergic synapse pathways and action cytoskeleton regulation path-way. To investigate the effect of down-regulation ofGnai1, we used the STRING protein-protein interaction network DB. In the PPI network, genes neighboring Gnai1 were further investigated for their biological functions. Looking at gene expression values, we were able to confirm the relationship between G-protein genes and RGS genes. Genes neighboringGnai1were selected by using STRING (Fig. 5). Top 20 interacted genes are shown in Table 1. Gnai1 and G-protein related genes, such as Gnb1, Gnb2
and Gnb4, were down-regulated at their gene expression level (Fig. 6). In contrast,Rgs1andRgs19, regulators of G-protein signaling genes that are associated with the inhib-ition of Gnai1 function, were up-regulated (Fig. 6).
Discussion
Potential interaction map ofEWS,RGS, and G-protein complex genes
A growing body of evidence shows multifunctional roles of the EWS/EWSR1 fusion oncoproteins [5, 7–9]. How-ever, the role of wild-type (WT)EWS/EWSR1is not fully understood yet. EWS/EWSR1 deficiency contributes to the failure of precursor B lymphocyte development and leads to the premature cellular senescence in mouse em-bryonic fibroblasts (MEFs) [27, 28]. It seems likely that the WT EWS/EWSR1 protein exhibits many different cellular functions in a cell-type specific manner. In the spinal cord ofEws/Ewsr1 KO mice, microRNAs, such as mmu-miR-381andmmu-miR-181a/b/cwere up-regulated. These microRNAs suppressed expression of Gnai1 (Gi Protein Alpha subunit). Concurrently, RGS (Regulator of G-protein Signaling) genes, Rgs1 and Rgs19, were up-regulated, which repressedGnai1activity. In addition, G Protein Beta subunit genes,Gnb1, Gnb2andGnb4were down-regulated. Thus in theEws/Ewsr1KO condition, G protein complex was not formed (Fig. 7).
Since Gnai1 was down-regulated, it is proposed that Gnai1 may be unable to inhibit downstream adenylate cyclase genes, such as Adcy9 and Adcy4, in cholinergic synapse pathway. Adenylate cyclase catalyzes the conver-sion of ATP to cAMP, and the cAMP regulates cAMP-proteins, transcription factors, and cAMP-dependent kinases. Adenylate cyclase is an enzyme with key
Fig. 5PPI network of Gnai1 from the STRING DB
Fig. 4Verification of alteredGnai1expression inEws/Ewsr1WT and KO mice. The gene expression level of Gnai1 was significantly lower in the spinal cords ofEws/Ewsr1KO mice (n= 6) compared to EWS WT mice (n= 6). The bar graph represents average ± standard error mean (SEM). **, Significantly different atp< 0.01 by Student T-test
regulatory roles, and Adenylate cyclase regulator Gnai1 has important roles in cholinergic synapse.
Our study presents for the first time thatEws/Ewsr1 defi-ciency modulates microRNA processing in the spinal cord. Notably, increased levels ofmmu-miR-381and mmu-miR-181a/b/cwere directly associated with the down regulation of G protein complex in the spinal cord ofEws/Ewsr1KO mice. We have previously shown thatEws/Ewsr1deficiency leads to abnormal microRNA processing and skin develop-ment via Drosha-dependent pathway [10]. Furthermore, we found thatEws/Ewsr1deficiency reduces the expression of Uvrag (UV radiation resistance associated) gene at the post-transcription level viammu-miR-125aand mmu-miR-351 [29]. Interestingly, the reduction of Uvrag by mmu-miR-125aandmmu-miR-351impaired autophagy function inEwsr1knockout (KO) MEFs and KO mice. Considering that G protein-coupled signaling transduction pathway is very complex, the Gnai1-dependent cellular function and mechanism in in vitro and in vivo models ofEWSR1 defi-ciency remains to be determined in future studies.
Conclusion
We developed a computational framework for the ana-lysis of the multifunction TFEWSgene and showed that EWShas a significant role in the regulation of G protein
complex. Since a multifunction TF gene has a compli-cated biological functions at various levels, such as tran-scription, gene regulation, and protein levels, powerful analysis tools are needed. Our method utilized miRNA-target gene network and protein-protein interaction net-work and combined multiple tools in a single computa-tional framework.
We analyzed the miRNAs and mRNA data in the spinal cord of Ews/Ewsr1 KO mice, and selected all
Fig. 6G-proteins and RGS (regulator of G-protein) expression level and log2 fold change value inEws/Ewsr1wild type and knock-out
Table 1Top 20 interacted genes with Gnai1 from the STRING DB
Gene Symbol Prediction Score Binding Inhibition
Gnb1 0.994 Yes
Gnb4 0.98 Yes
Gnb2 0.98 Yes
Rgs19 0.979 Yes Yes
Gnb3 0.978 Yes
Rgs1 0.976 Yes Yes
Plcb1 0.974 Yes
Adcy4 0.973 Yes Yes
Adcy9 0.973 Yes Yes
Rgs14 0.972 Yes Yes
Plcb4 0.97 Yes
Adcy1 0.97 Yes Yes
Plcb3 0.97 Yes
Adcy8 0.969 Yes Yes
Adcy2 0.969 Yes Yes
Rgs10 0.969 Yes Yes
Adcy6 0.967 Yes Yes
Adcy7 0.967 Yes Yes
Adcy5 0.966 Yes Yes
Adcy3 0.966 Yes Yes
significantly differentially expressed miRNAs and nega-tive correlated DEGs. We constructed an interaction network with selected miRNAs and mRNAs and ana-lyzed the GSEA and related pathways. From the result of pathway analysis, we identified significantly down-regulatedGnai1gene in the cholinergic synapse pathway that is highly clustered by down-regulated DEGs belong-ing pathways.Gnai1was verified by qRT-PCR, and ana-lyzed about PPI sub-networks.Gnai1was suppressed by mmu-miR-381andmmu-miR-181a/b/c, and inhibited by Rgs1 and Rgs19 in the spinal cord of Ews/Ewsr1 KO mice. As a future work, we plan to develop a software package for the analysis of multifunction TF genes.
Material & detailed methods NGS data
RNA sequencing data and microRNA microarray data those were generated from the spinal cord tissue sam-ples ofEws/Ewsr1WT and KO mice [10].
Differentially expressed miRNA analysis
Differentially expressed miRNAs were selected from miRNA microarray data by using the samr (SAM: Sig-nificance Analysis of Microarrays, version: 2.0) package in Bioconductor. We used “two-class unpaired” option with 1000 permutations. SAM generated an interactive plot of the observed vs. expected (based on the per-muted data) d-values. The user can dynamically change thresholds for significance to set the value of the tuning parameter delta. We set the delta to 2 to reduce the numbers of selected significant miRNAs.
MicroRNA target Gene prediction
We collected target genes of differentially expressed miRNAs using TargetScan and miRDB. TargetScan pre-dicts biological targets of selected miRNAs by searching for the presence of conserved 8mer and 7mer sites that match the seed region of each miRNA. miRDB is a data-base of predicted miRNA targets in animals. MicroRNA targets in miRDB were predicted by using SVM (support
vector machine) based prediction program. Only 22 % of predicted target genes by TargetScan and miRDB agreed. Since we were unable to decide which predicted gene are correct and we used all predicted target genes.
Reference genome sequence for alignment
We downloaded and used Ensembl reference genome sequence (Mus_musculus.GRCm38.70) for reads map-ping [30].
GTF (General Transfer Format) file for gene annotation After the alignment, we calculated the FPKM (fragment per kb exon model) values of each gene by Cufflinks with Ensembl gene model (Mus_musculus.GRCm38.70) [31].
Preprocessing of RNA-sequence data for DEG analysis Before mapping reads, we clipped two adaptor se-quences of paired-end RNA-seq data. For trimming, we allowed 2 mismatch of adaptor sequences to short reads. After the trimming process, we discarded reads of 18 bp or shorter.
Used trimming processing adaptor sequences show the next lines.
READ1 adaptor sequence: GATCGGAAGAGCACAC GTCTGAACTCCAGTCAC
READ2 adaptor sequence: AGATCGGAAGAGCGTC GTGTAGGGAAAGAGTGTAGATCTCGGTGGTCGC CGTATCATT
DEG (differently expressed gene) analysis from RNA-seq NGS data
Paired-end total RNA-sequencing raw data were gener-ated by Illumina HiSeq 2000. Each of the numbers of reads in raw data of wild type and Ews Knockout 3-week-old mice spinal cord samples show Table 2. After adaptor sequence trimming process for discarding of low quality sequence, the number of trimmed reads for each samples show Table 2. These amount of reads is sufficient for DEG analysis. After reference genome indexing, trimmed short reads were mapped to the
Fig. 7Roles of G proteins and its regulatory mechanisms by miRNAs in the spinal cord ofEws/Ewsr1KO mouse. Direction of arrow means with a change of gene expression level inEws/Ewsr1KO mice. Upper arrows are up-regulated gene expression level, and bottom arrows are the opposite
reference genome by Tophat. The ratios of mapped reads for each samples were 81.72 and 81.5 %. The mapping ra-tios were higher than 80 % for all samples and variations in the mapping ratio across the samples were very small. Thus we believe that results of analysis for RNA sequencing experiment and short read processing were satisfactory. We quantified the expression level of each gene using Cufflinks based on the gene information from Ensembl.
Quantitative real-time PCR
Total RNA was extracted from the spinal cord of Ews/ Ewsr1 WT and KO mice by TRIzol reagent (MRC, Cin-cinnati, OH, USA) as previously described [10]. RNA was measured in a spectrophotometer at 260-nm ab-sorbance. RNA analysis was conducted as follows. Fifty nanograms of RNA were used as a template for qRT-PCR amplification, using SYBR Green Real-time qRT-PCR Master Mix (Toyobo, Osaka, Japan). Primers were stan-dardized in the linear range of cycle before the onset of the plateau. Mouse GAPDH was used as an internal control. Two-step PCR thermal cycling for DNA amplifi-cation and real-time data acquisition were performed with an ABI StepOnePlus Real-Time PCR System using the following cycle conditions: 95 °C for 1 min × 1 cycle, and 95 °C for 15 s, followed by 60 °C for 1 min × 40 cy-cles. Fluorescence data were analyzed by the ABI StepO-nePlus software and expressed as, Ct, the number of cycles needed to generate a fluorescent signal above a predefined threshold. The ABI StepOnePlus software set baseline and threshold values.
Additional files
Additional file 1: Table S1.Top 400 DEGs analysis result. A) GO term result of DAVID analysis. B) KEGG pathway result list. (XLSX 19 kb)
Additional file 2: Figure S1.Graphic plotting of miRNA microarray analysis by SAM. Red dots are significantly up-regulated miRNAs and green dots are down-regulated. In the table of SAM result, columns are score, numerator, denominator, fold change and q-value. (DOCX 34 kb)
Additional file 3: Table S2.The number of genes targeted by each miRNAs by using TargetScan and miRDB. Prediction results by TargetScan and miRDB do not agree much. Union of target genes were further analyzed by performing. (DOCX 15 kb)
Additional file 4: Figure S2.The cholinergic synapse pathway related with significantly down-regulated genes by ClueGO. Selected DEGs are highlighted in colors chosen by KEGG mapper. Blue genes are down-regulated genes, and red genes are up-down-regulated genes inEws/Ewsr1KO mice compared to WT mice. Green color genes are not changed. (DOCX 53 kb)
Abbreviations
DAVID, the database for annotation, visualization and integrated discovery; DEG, differentially expressed gene; DNA, deoxyribonucleic acid; EWS, Ewing’s Sarcoma; EWSR1, EWS RNA-binding protein 1; FPKM, fragments per kilobase of exon per million fragments mapped; Gnai1, Gi protein alpha subunit; GO, gene ontology; GSEA, gene set enrichment analysis; KEGG, Kyoto encyclopedia of genes and genomes; KO, knock-out; MMIA, microRNA and mRNA integrated analysis; PPI, protein-protein interaction; qRT-PCR, quantitative real-time PCR; RGS, regulator of G-protein signaling; RNA, ribonucleic acid; RNA-seq, whole transcriptome sequencing; STRING, Search Tool for the Retrieval of Interacting Genes/Proteins; TF, Transcription factor
Declaration
Publication of this article has been funded by the Bio & Medical Technology Development Program of the National Research Foundation (NRF) funded by the Ministry of Science, ICT & Future Planning (2012M3A9D1054622); by the Bio & Medical Technology Development Program of the NRF funded by the Korean government, MSIP (NRF-2014M3C9A3063541); by the Next-Generation Information Computing Development Program through the National Research Foundation of Korea (NRF) funded by the Ministry of Science, ICT & Future Planning (No.NRF-2012M3C4A7033341). This study was supported by NIH Grant (NS067283 to H.R.). This study was and Brain Science Flagship Grant (2E25480 to H.R.) from Korea Institute of Science and Technology.
This article has been published as part of BMC Medical Genomics Volume 9 Supplement 1, 2016. Selected articles from the 5th Translational
Bioinformatics Conference (TBC 2015): medical genomics. The full contents of the supplement are available online https://bmcmedgenomics.biomedcentral.com/ articles/supplements/volume-9-supplement-1
Availability of data and materials
All datasets on which the conclusions of the manuscript are presented in the main paper and additional supplementary files.
Authors’contributions
SK and HR designed and supervised the research project and edited the paper. CL developed the method, performed data analysis and wrote the manuscript. HA helped data analysis and advised and assisted the manuscript. SBL, J-YS, W-YP, J-IK and JL supported to generate RNA-seq data and performed biological experiment. All authors read and approved the final manuscript.
Competing interests
The authors declare that they have no competing interests.
Consent for publication
Not applicable.
Ethics approval and consent to participate
The animal study usingEwsr1WT and KO mice was approved by IACUC and animal experiments were conducted in accordance with the Guide for Institutional Animal Care and Use Committee of Seoul National University.
Author details 1
Interdisciplinary Program in Bioinformatics, Seoul National University, Seoul 151-747, Republic of Korea.2Department of Computer Science and Engineering, Seoul National University, Seoul 151-744, Republic of Korea. 3Bioinformatics Institute, Seoul National University, Seoul 151-747, Republic of Korea.4Department of Pathology & Laboratory Medicine, Tulane University School of Medicine, New Orleans, LA 70112, USA.5Genome Medicine Institute and Department of Biochemistry, Seoul National University College of Medicine, Seoul 110-799, Republic of Korea.6Samsung Genome Institute, Table 2Number of reads and ratios of mapped reads in the process of RNA-seq analysis
Samples Number of reads in raw data Number of reads after trimming Ratios of mapped read
Wild type 3-week-old sample 37,804,437 37,138,795 81.72 %
EwsKnockout 3-week-old sample 40,139,625 39,501,475 81.50 %
Samsung Medical Center and Department of Health Sciences and Technology, Samsung Advanced Institute for Health Sciences and
Technology, Sungkyunkwan University, Seoul 135-710, Republic of Korea.7VA Boston Healthcare System, Boston, MA 02130, USA.8Boston University Alzheimer’s Disease Center and Department of Neurology, Boston University School of Medicine, Boston, MA 02118, USA.9Center for Neuromedicine, Brain Science Institute, Korea Institute of Science and Technology, Seoul 136-791, Republic of Korea.
Published: 12 August 2016
References
1. Meltzer PS. Is Ewing’s sarcoma a stem cell tumor? Cell Stem Cell. 2007;1(1):13–5. 2. Barker LM, Pendergrass TW, Sanders JE, Hawkins DS. Survival after recurrence of
Ewing’s sarcoma family of tumors. J Clin Oncol. 2005;23:4354–62. 3. Miser JS, Krailo MD, Tarbell NJ, et al. Treatment of metastatic Ewing’s
sarcoma or primitive neuroectodermal tumor of bone: evaluation of combination ifosfamide and etoposide–a Children’s Cancer Group and Pediatric Oncology Group study. J Clin Oncol. 2004;22:2873–6. 4. Bertolotti A, Bell B, Tora L. The N-terminal domain of human TAFII68 displays
transactivation and oncogenic properties. Oncogene. 1999;18(56):8000–10. 5. May WA, Lessnick SL, Braun BS, Klemsz M, Lewis BC, Lunsford LB, Hromas R,
Denny CT. The Ewing's sarcoma EWS/FLI-1 fusion gene encodes a more potent transcriptional activator and is a more powerful transforming gene than FLI-1. Mol Cell Biol. 1993;13(12):7393–8.
6. Fisher C. The diversity of soft tissue tumours with EWSR1 gene rearrangements: a review. Histopathology. 2014;64(1):134–50.
7. Huang SC, Chen HW, Zhang L, Sung YS, Agaram NP, Davis M, Edelman M, Fletcher CD, Antonescu CR. Novel FUS‐KLF17 and EWSR1‐KLF17 fusions in myoepithelial tumors. Genes Chromosomes Cancer. 2015;54(5):267–75. 8. Rossi S, Szuhai K, Ijszenga M, Tanke HJ, Zanatta L, Sciot R, Fletcher CD, Dei
Tos AP, Hogendoorn PC. EWSR1-CREB1 and EWSR1-ATF1 fusion genes in angiomatoid fibrous histiocytoma. Clin Cancer Res. 2007;13(24):7322–8. 9. Lau PP, Lui PC, Lau GT, Yau DT, Cheung ET, Chan JK. EWSR1-CREB3L1 gene
fusion: a novel alternative molecular aberration of low-grade fibromyxoid sarcoma. Am J Surg Pathol. 2013;37(5):734–8.
10. Kim KY, Hwang YJ, Jung MK, Choe J, Kim Y, Kim S, Lee CJ, Ahn H, Lee J, Kowall NW, Kim YK, Kim JI, Lee SB, Ryu H. A multifunctional protein EWS regulates the expression of Drosha and microRNAs. Cell Death Differ. 2014; 21(1):136–45.
11. Chansky HA, Hu M, Hickstein DD, Yang L. Oncogenic TLS/ERG and EWS/Fli-1 fusion proteins inhibit RNA splicing mediated by YB-1 protein. Cancer Res. 2001;61(9):3586–90.
12. Nam S, Li M, Choi K, Balch C, Kim S, Nephew KP. MicroRNA and mRNA integrated analysis (MMIA): a web tool for examining biological functions of microRNA expression. Nucleic Acids Res. 2009, gkp294
13. Tusher VG, Tibshirani R, Chu G. Significance analysis of microarrays applied to the ionizing radiation response. Proc Natl Acad Sci U S A. 2001;98(9): 5116–21.
14. Benjamin PL, Christopher BB, David PB. Conserved Seed Pairing, Often Flanked by Adenosines, Indicates that Thousands of Human Genes are MicroRNA Targets. Cell. 2005;120:15–20.
15. Xiaowei W, Issam MEN. Prediction of both conserved and nonconserved microRNA targets in animals. Bioinformatics. 2008;24(3):325–32.
16. Xiaowei W. miRDB: a microRNA target prediction and functional annotation database with a wiki interface. RNA. 2008;14(6):1012–7.
17. Ben L, Cole T, Mihai P, Steven LS. Ultrafast and memory-efficient alignment of short DNA sequences to the human genome. Genome Biol. 2009;10(3):R25.
18. Kim D, Pertea G, Trapnell C, Pimentel H, Kelley R, Salzberg SL. TopHat2: accurate alignment of transcriptomes in the presence of insertions, deletions and gene fusions. Genome Biol. 2011;14:R36.
19. Trapnell C, Williams BA, Pertea G, Mortazavi AM, Kwan G, van Baren MJ, Salzberg SL, Wold B, Pachter L. Transcript assembly and quantification by RNA-Seq reveals unannotated transcripts and isoform switching during cell differentiation. Nat Biotechnol. 2010;28:511–5.
20. Xin F, Li M, Balch C, Thomson M, Fan M, Liu Y, Hammond SM, Kim S, Nephew KP. Computational Analysis of MicroRNA Profiles and Their Target Genes Suggests Significant Involvement in Breast Cancer Antiestrogen Resistance. Bioinformatics. 2009;25(4):430–4.
21. Marbach D, Costello JC, Kuffner R, Vega NM, Prill RJ, Camacho DM, Allison KR, Kellis M, Collins JJ, Stolovitzky G. Wisdom of crowds for robust gene network inference. Nat Methods. 2012;9(8):796–804.
22. Dennis Jr G, Sherman BT, Hosack DA, Yang J, Gao W, Lane HC, Lempicki RA. DAVID: Database for Annotation, Visualization, and Integrated Discovery. Genome Biol. 2003;4(5):3.
23. Kanehisa M, Goto S. KEGG: kyoto encyclopedia of genes and genomes. Nucleic Acids Res. 2000;28(1):27–30.
24. Gabriela B, Bernhard M, Hubert H, Pornpimol C, Marie T, Amos K, Wolf-Herman F, Franck P, Zlatko T. ClueGO: a Cytoscape plug-in to decipher functionally grouped gene ontology and pathway annotation networks. Bioinformatics. 2009;25(8):1091–3.
25. Shannon P, Markiel A, Ozier O, Baliga NS, Wang JT, Ramage D, Amin N, Schwikowski B, Ideker T. Cytoscape: a software environment for integrated models of biomolecular interaction networks. Genome Res. 2003;13(11): 2498–504.
26. Snel B, Lehmann G, Bork P, Huynen MA. STRING: a web-server to retrieve and display the repeatedly occurring neighbourhood of a gene. Nucleic Acids Res. 2000;28(18):3442–4.
27. Li H, Watford W, Li C, Parmelee A, Bryant MA, Deng C, et al. Ewing sarcoma gene EWS is essential for meiosis and B lymphocyte development. J Clin Invest. 2007;117:1314–1323.
28. Cho J, Shen H, Yu H, Li H, Cheng T, Lee SB, et al. Ewing sarcoma gene Ews regulates hematopoietic stem cell senescence. Blood. 2011; 117(4):1156–1166. 29. Kim YH, Kim KY, Hwang YJ, Kowall NW, Lee SB, Lee J and Ryu H. Uvrag
targeting by MiR-125a and MiR-351 modulates autophagy associated with EWS deficiency. Autophagy. 2015; 11(5):796–811.
30. Available: ftp://ftp.ensembl.org/pub/release-70/fasta/mus_musculus/dna/. Accessed 1 May 2015.
31. Available: ftp://ftp.ensembl.org/pub/release-70/gtf/mus_musculus/. Accessed 1 May 2015.
• We accept pre-submission inquiries
• Our selector tool helps you to find the most relevant journal
• We provide round the clock customer support
• Convenient online submission
• Thorough peer review
• Inclusion in PubMed and all major indexing services
• Maximum visibility for your research
Submit your manuscript at www.biomedcentral.com/submit