RESEARCH
Improvement of Fab expression by screening
combinatorial synonymous signal sequence
libraries
Antti Kulmala, Tuomas Huovinen and Urpo Lamminmäki
*Abstract
Background: Antibody fragments can be expressed in Escherichia coli, where they are commonly directed to the periplasm via Sec pathway to enable disulphide bridge formations and correct folding. In order to transport antibody fragments to the periplasmic space via Sec pathway, they are equipped with N-terminal signal sequence. Periplasmic expression has many benefits but it’s also subjected to many hurdles like inefficient translocation across the inner membrane and insufficient capacity of the translocation system. One solution to overcome these hurdles is a modula-tion of codon usage of signal sequence which has proved to be an efficient way of tuning the translocamodula-tion process. Modulation of codon usage of signal sequences has been successfully employed also in improving the expression levels of antibody fragments, but unfortunately the effect of codon usage on the expression has not been thoroughly analyzed.
Results: In the present study we established three synonymous PelB signal sequence libraries by modulating codon usage of light chain and heavy chain PelB signal sequences of a Fab fragment. Each region (n-region, hydrophobic region and c-region) of the PelB signal sequence in the both chains of the Fab fragment in a bicistronic expression vector was mutated separately. We then screened for clones with improved expression profile. The best source for improved clones was the n-region library but in general, improved clones were obtained from all of the three libraries. After screening, we analyzed the effects of codon usage and mRNA secondary structures of chosen clones on the expression levels of the Fab fragment. When it comes to codon usage based factors, it was discovered that especially codon usage of fifth leucine position of the light chain PelB affects the expression levels of Fab fragment. In addition, we observed that mRNA secondary structures in the translation initiation regions of the light and heavy chain have an effect on expression levels as well.
Conclusions: In conclusion, the established synonymous signal sequence libraries are good sources for discovering Fab fragments with improved expression profile and obtaining new codon usage related information.
Keywords: Codon usage, Fab fragment, Heterologous expression, Escherichia coli, PelB
© The Author(s) 2019. This article is distributed under the terms of the Creative Commons Attribution 4.0 International License (http://creat iveco mmons .org/licen ses/by/4.0/), which permits unrestricted use, distribution, and reproduction in any medium, provided you give appropriate credit to the original author(s) and the source, provide a link to the Creative Commons license, and indicate if changes were made. The Creative Commons Public Domain Dedication waiver (http://creativecommons.org/ publicdomain/zero/1.0/) applies to the data made available in this article, unless otherwise stated.
Background
Antibody fragments, especially ScFv (single-chain vari-able fragment) and Fab (antigen binding fragment), are increasingly used for diagnostic and therapeutic pur-poses [1]. The antibody fragments can be expressed in
Escherichia coli, where they are commonly directed to the periplasmic space by using Sec translocon to enable disulphide bridge formations and correct folding [2]. To this end, the expressed antibody polypeptides, which in the case of Fab consist of an intact light chain and the first two domains (VH and CH1) of the heavy chain, are
equipped with N-terminal leader (signal) sequences that guide them through the cytoplasmic membrane, most commonly, via the Sec translocon [3, 4].
Open Access
*Correspondence: [email protected]
Typically, the signal sequences are 25–30 residues long and they are generally composed of n-region, hydropho-bic region and c-region [5]. The n-region has a positive charge and an average length of five (generally basic) resi-dues, although the length highly varies. The hydropho-bic region is 7–15 residues long and it adopts α-helical conformation. The c-region is composed of 3–7 neutral or polar amino acids, for example helix breaking proline and glycine residues and it also includes signal peptidase cleavage site. The c-region forms β-sheet structure [5, 6]. Many different signal sequences have been used to trans-port antibody fragments to periplasmic space of E. coli via Sec pathway [3], but also SRP dependent pathway has been utilized [7]. One of the most frequently used sig-nal sequence for transportation of antibody fragments to the periplasm of E. coli is 22 amino acids long signal sequence of pectate lyase B (PelB) from Erwinia caroto-vora [8].
Compared to the cytosolic expression, the periplasmic expression required for antibody fragments (and proteins in general) is subjected to some hurdles like inefficient translocation across the inner membrane and insufficient capacity of the translocation system [9]. Various strategies have been described to increase periplasmic expression, one of which, involves the modulation of codon usage [10]. Zalucki et al. observed that non-optimal codons are required for expression and translocation of β-lactamase [11] and the same research group then showed that non-optimal codons in a signal sequence are necessary for the folding of the mature protein [12]. Controversially, it has been observed that non-optimal codons are enriched in the signal sequences of Escherichia coli on genomic level [13], but there is a report showing that optimal codons in some cases may be beneficial for improving the peri-plasmic expression especially with other secretory path-ways than Sec [14]. Effects of the codon usage of signal sequences on the heterologous expression of antibody fragments have been previously studied by Stemmer et al. [15] who obtained increased expression of variable frag-ment (Fv) by introducing synonymous mutations in the second, heavy chain cistron signal sequence. In terms of translocation to the periplasm, Fab fragments are espe-cially challenging since they are heterodimeric and both polypeptides are independently expressed and trans-ported to the periplasm. Humphreys et al. showed that the optimization of the expression ratio of the light and heavy chain was important for the high level production of Fab fragment, and that the ratio can be modulated by synonymous mutations in the signal sequence [16]. In the study by Humphreys et al. synonymous mutations were introduced into the signal peptide of the major coat protein (VIII) of the phage M13 fused to the alkaline phosphatase gene and after identifying the best clones,
the corresponding signal sequences were applied to Fab fragments. However, in the aforementioned studies, the effects of codon usage or mRNA secondary structure on the expression levels of given antibody fragment were not thoroughly analyzed by using the combination of codon usage metrics, mRNA folding algorithms and compre-hensive statistical approaches.
Previously, we were able to increase expression of Fab fragment by harmonizing selected segments in the Fab fragment gene [17]. In the present study, we explore the effects of synonymous codon mutations introduced into the PelB signal sequences of light chain and heavy chain of a Fab fragment on protein expression in the peri-plasm. A separate combinatorial library of synonymous codons was created for the three structurally different regions of the signal peptide covering the N-terminal region (n-region), the hydrophobic core segment (hydro-phobic region) and the hydrophilic C-terminal region (c-region), respectively. Unlike in the study conducted by Humphreys et al. we performed a combinatorial library screening directly with Fab fragments expressed from a bicistronic construct under Lac promoter. Clones with improved expression were found from all three sub-libraries and most notably in the n-region library. Par-ticularly strong effect on expression was observed at the fifth position of the light chain signal sequence coding for a leucine, in which synonymous mutation caused almost 2-fold difference in expression. Moreover, the codon usage at fifth leucine position and mRNA secondary structures in the translation initiation region seemed to exhibit independent but additive roles on expression.
Materials and methods Template sequences
Fab0 N, Fab0H and Fab0C were used as templates in the construction of the libraries targeting the n- region, hydrophobic region and c-region of the signals sequences, respectively. These Fab constructs, which were based on the previously described anti-digoxi-genin Fab0 fragment [17], carried BglII (Fab0N), BamHI (Fab0H) or NotI (Fab0C) restriction enzyme recogni-tion site in PelB signal sequences of the light and heavy chains (Fig. 1). The restriction enzymes were used to abolish background sequences in the construction of the libraries. Hereafter, the libraries obtained by diver-sification of n- region, hydrophobic region and c-region are referred as N–0, H–0 and C–0, respectively.
Production of uridylated single‑stranded template DNA for Kunkel mutagenesis
coli XL1-Blue cells (Stratagene, LaJolla, USA) by elec-troporation as described by Huovinen et al. [19] and plated on LA plates (0.5% glucose, 25 µg/ml cm, 10 µg/ ml tet). The plates were incubated overnight at 37 °C. Next day 3 × 5 ml of SB medium (1% glucose, 25 µg/ ml cm, 10 µg/ml tet) was inoculated with one colony from appropriate plate and incubated overnight at 37 °C with 300 rpm shaking. Main culture of phage pro-duction and the phage precipitation were performed as described by Kulmala et al. [17]. Only exception was multiplicity of infection (MOI). In the production of pEB32x-Fab0N, pEB32x-Fab0H and pEB32x-Fab0C phage particles, the used MOI value was 10. Uridylated single-stranded template DNA was produced by using E. coli K12 CJ236 strain (NEB, Ipswich, USA) as described by Sidhu et al. [20]. Unlike in the protocol by Sidhu et al. the growth medium was supplemented with 6 µg/ml uridine.
Kunkel mutagenesis for construction of N–0, H–0 and C–0 signal sequence libraries
Synonymous mutations were introduced to the n-region, hydrophobic region and c-region of the PelB signal sequences with phosphorylated primers that were pur-chased from Integrated DNA Technologies (Coralville, USA). Each region of the PelB signal sequences had its own designated primer (Additional file 1: Table S1).
Phosphorylated primers were annealed to 700 ng of single-stranded pEB32x-Fab0N, pEB32x-Fab0H and pEB32x-Fab0C template sequences as described by Huovinen et al. [19]. Phosphorylated primers targeted to the light chain PelB and phosphorylated primers tar-geted to the heavy chain PelB were annealed in the same reaction. Remaining template sequences (background) in the Kunkel reactions pEB32x-N–0, pEB32x-H–0 and pEB32x-C–0 were digested in their entirety with 20 U BglII (Thermo Scientific), 20 U BamHI (Thermo Scien-tific) and 20 U NotI (Thermo ScienScien-tific), respectively. Buffer recommended by the manufacturer was used in each digestion reaction. All the digestion reactions were incubated for 2 h, at 37 °C and inactivated according to the manufacturer’s instructions. After inactivation, 2 U of uracil-DNA glycosylase (UDG) (Thermo Scientific) was added to each reaction. Reactions were incubated for 1 h, at 37 °C, purified with PCR purification kit and eluted into 20 µl.
Selective rolling circle amplification (sRCA) and transformation of the N–0, H–0 and C–0 signal sequence libraries
All UDG treated Kunkel products were amplified in their entirety (20 µl) by selective rolling circle amplification (sRCA) in 50 µl total volume as described by Huovinen et al. [19] but with few exceptions. The amount of Phi29
Polymerase (Thermo Scientific) in the reactions was 25 U and in addition, 0.0625 U of inorganic pyrophosphatase (Thermo Scientific) was added to the reactions. The sRCA products were digested into linear single-plasmid segments with XhoI in 100 µl reactions containing 50 µl of DNA (sRCA reaction), 1× Buffer R (Thermo Scien-tific) and 100 U XhoI (Thermo ScienScien-tific). Reactions were incubated at 37 °C for 2 h, purified with PCR purifica-tion kit and eluted into 30 µl. After first XhoI digespurifica-tion, additional XhoI digestions were performed by incubating overnight at 37 °C. Additional XhoI digestion reactions contained 30 µl of DNA, 1× Buffer R and 60 U XhoI in 60 µl volume. Digestion reactions were purified with PCR purification kit and eluted into 30 µl. Next, 30 µl of the digestion products were re-circularized in ligation reactions containing 5 ng/µl DNA, 0.02 U/µl T4 DNA ligase (Thermo Scientific) and 1× T4 DNA ligase buffer (Thermo Scientific). The ligation reactions were incu-bated overnight at 16 °C and 1 h at room temperature. The ligation products were purified with PCR purifica-tion kit, eluted into 25 µl and then transformed in their entirety into E. coli SS320 (MC1061 F′) cells [20] by elec-troporation. In three separate electroporations, 25 µl of DNA (~ 1.3 µg DNA in each ligation reaction) was mixed with 320 µl of cells and DNA was transformed to cells with Bio-Rad Genepulser (Bio-Rad, Hercules, USA) with settings 2.5 kV, 25 µF, 200 Ω. After transformation, cells were recovered in 25 ml of SOC medium for 1 h, at 37 °C, with 100 rpm shaking and subsequently plated on LA plates (0.5% glucose, 25 µg/ml cm, 10 µg/ml tet). Plates were incubated overnight at 37 °C. In addition, recovered cells were sampled and diluted 10−1–10−6 in 1 ml of SB
medium for transformation efficiency calculations. Dilu-tions 10−4–10−6 were also plated on LA plates (0.5%
glu-cose, 25 µg/ml cm, 10 µg/ml tet) and incubated overnight at 37 °C. The next day, cells were collected from the LA plates and stored as glycerol preps at − 70 °C.
Cloning of the N–0, H–0 and C–0 signal sequence libraries from pEB32x vector into pEB07 vector
Signal sequence libraries N–0, H–0 and C–0 were cloned from pEB32x vector into pEB07 vector that fuses beta-lactamase gene (TEM-1) to the C-terminal end of a given molecule [19]. First, all three libraries were amplified in the PCR reactions (6 parallel reactions for each library) containing 1× Phusion HF reaction buffer (Thermo Sci-entific), 200 µM dNTP mix (Thermo SciSci-entific), 1 U Phu-sion Hot Start II polymerase (Thermo Scientific), 10 ng of template DNA and 0.5 µM primers. Primer pair TH10 (5′-GAT GGT AGA ACG AAG CGG -3′) and TH40 (5′ -CAG TAG TAG ACG GCA GTG TCC-3′) was used. Ther-mal cycling condition was initial denaturation 98 °C for 1 min, denaturation 98 °C for 5 s, annealing 61.4 °C for
10 s, extension 72 °C for 31 s and final extension 72 °C for 5 min. PCR cycle was repeated 30 times. Reactions were pooled and the products purified with PCR purification kit and eluted into 30 µl. Next, the amplified libraries were digested with ApaI and XhoI restriction enzymes. All three libraries were digested in their entirety (30 µl) in 50 µl total volume containing 10 U ApaI (Thermo Sci-entific), 10 U XhoI (Thermo Scientific) and 1× CutSmart buffer (NEB). Vector pEB07 carrying Fab0 (pEB07-Fab0) gene was digested in the same manner. The digestion reactions were incubated overnight at 37 °C. Digested fragments were extracted from agarose gel with Gel Extraction kit (Thermo Scientific). Next, digested library fragments N–0, H–0 and C–0 were ligated to digested destination vector pEB07-Fab0 by using T4 DNA ligase (Thermo Scientific) according to manufacturer’s instruc-tions. Molar ratio of inserts (library fragments) and vector (pEB07-Fab0) was 3:1. Ligation reactions were incubated overnight at room temperature and inactivated at 70 °C for 5 min. Then 20 µl (N–0), 25 µl (H–0) and 30 µl (C–0) of DNA were mixed with 280 µl of E. coli SS320 (MC1061 F’) cells in three separate electroporations with the same settings as described above. After transformation, cells were recovered in 20 ml of SOC medium, which had low-ered glucose concentration (0.05%), for 1 h at 37 °C with 100 rpm shaking and subsequently plated on LA plates (0.05% glucose, 100 µg/ml amp). Plates were incubated overnight at 37 °C. Sampling and dilution of recovered cells was done in the same manner as described earlier. The next day, cells were collected from the LA plates and stored as glycerol preps at − 70 °C.
Cultivation of the libraries in pEB07 vector in order to reduce the amount of non‑productive clones
concentration of ampicillin increased step-by-step. Cells were cultured for 10 generations in ampicillin concen-trations 100, 200, 400, 600, 800, 1000, 1200, 1500, 2000 and 2500 µg/ml. After each generation, 800 µl samples were taken and samples were stored as glycerol preps at − 70 °C.
Primary screening of the libraries on 96‑well plates
Single colony primary screenings were performed on 96-well plates by expressing the clones of the libraries from pLK04 vector [21] that allows production of Fabs in soluble form with mere 6xhistidine tag fused to the C-terminus of heavy chain. All three libraries N–0, H–0, C–0 and pEB07-Fab0 were amplified by PCR in the reac-tions containing 1× Phusion HF reaction buffer (Thermo Scientific), 200 µM dNTP mix (Thermo Scientific), 1 U Phusion Hot Start II polymerase (Thermo Scientific), 1 ng of template DNA and 0.5 µM primers (TH10 and TH40). Cycling conditions were the same as mentioned above. Reactions were purified with PCR purification kit and eluted into 20 µl. After purification all four reactions were digested with ApaI and XhoI restriction enzymes as mentioned above. Also pLK04-Fab0, which was used as a destination vector, was digested in the same man-ner. Fragments were extracted from the gel with the gel extraction kit. The fragments from the libraries N–0, H–0, C–0 and pEB07-Fab0 were ligated to digested pLK04-Fab0 destination vector in the same manner as above. The ligation reactions were then transformed into CaCl2 competent E. coli XL1-Blue cells by heat shock.
First, 10 µl of DNA was mixed with 100 µl of cells in each reaction and subsequently DNA–cell mixtures were put on ice for 30 min. After incubation on ice the heat shock was given to each transformation reaction at 42 °C for 90 s and subsequently 900 µl of SOC medium was added to each reaction. Cells were then recovered at 37 °C with 100 rpm shaking for 45 min. Cells were plated on LA plates (0.5% glucose, 100 µg/ml amp) and incubated over-night at 37 °C. The next day, colonies were picked from the plates to the wells of 96-well plates (Sarstedt, Nüm-brecht, Germany). From each plated library, 279 colonies were picked (3 plates per library, 837 colonies in total) and colonies were inoculated to 160 µl of SB medium (1% glucose, 100 µg/ml amp). Twelve wells from each plate were reserved for Fab0 that was used as a parental expression control. Plates were covered with breathable tape (Nunc, Roskilde, Denmark) and incubated overnight at 37 °C with 900 rpm shaking with 70% humidity. After overnight incubation, cultures were diluted by pipet-ting 4 µl from the overnight cultures to 200 µl of fresh SB medium (0.05% glucose, 100 µg/ml amp). Refreshed cultures were incubated for 4 h at 37 °C with 900 rpm shaking with 70% humidity. After 4 h of incubation, 10 µl
of 4 mM IPTG was added to the wells and cultures were continued overnight at 26 °C with 900 rpm shaking. The next day 10 µl samples, which were used for sequencing, were taken from each well. After sampling, 20 µl of 10× Lysis buffer (1× TBS [50 mM Tris–HCl, pH 7.5; 150 mM NaCl], 10 mg/ml lysozyme from chicken egg white [Alfa Aesar, Haverhill, USA], 25 U/ml universal nuclease for cell lysis [Thermo Scientific]) was added to the wells. Plates were incubated at room temperature with slow shaking for 30 min and subsequently subjected to 1 freeze–thaw cycle. The expression levels of immunoreac-tive Fab were measured with time-resolved fluorometry based immunoassay as described below. Immunoassay was implemented mainly the same way as in the study by Kulmala et al. [17].
In the primary screening, the wells of streptavidin plates (Kaivogen, Turku, Finland) were coated with 100 µl per well of 500 nM biotinylated digoxigenin. The strepta-vidin plates were incubated at RT for 1 h with slow shak-ing and subsequently washed two times with Delfia Plate Wash (Wallac, Turku, Finland) by using Kaivogen wash buffer (Kaivogen). After washing, 10 µl of samples were diluted in 100 µl of Assay Buffer (Kaivogen). Samples were diluted directly in the wells of streptavidin plate. After the addition of samples, the plates were incubated at RT for 1 h with slow shaking and subsequently washed two times. Immunoreactive Fabs were detected with 25 ng per 100 μl N1-Eu-chelate labelled anti-human Fab 2A11 (Hytest Ltd, Turku, Finland) and by incubating at RT for 1 h with slow shaking. The streptavidin plate was washed four times. Delfia Enhancement solution (Wallac) was added and the plate was incubated at RT for 10 min with slow shaking, after which time-resolved europium signal at 615 nm was measured with Victor 1420 Multila-bel Counter (Wallac).
Secondary screening of the libraries
The clones were ranked based on the signal levels obtained from primary screening. Selected clones from the top 10% cohort were subjected to secondary screen-ing. These clones consisted of 30 N–0 library clones, 10 H–0 library clones and 18 C–0 library clones. The secondary screening cultures were started by diluting overnight pre-cultures to OD (600 nm) 0.1 in 5 ml of SB medium (1% glucose, 100 µg/ml amp). Cells were cul-tured at 37 °C with 300 rpm shaking to OD (600 nm) 0.7–0.9. When the cell cultures reached the appropri-ate OD (600 nm), the same amount of cells (2 × 10⁹
cultured at 26 °C with 300 rpm shaking for 3 h and sub-sequently 1 ml sample was taken from each culture. Cells were pelleted with tabletop centrifuge at 16,300g, for 5 min at 4 °C. Cell pellets were suspended in Assay Buffer and cells were disrupted by sonication while keeping on ice.
The yields of immunoreactive Fab fragments were measured by immunoassay. The procedure of the immunoassay has been previously described by Kul-mala et al. [17]. Wells of a 96 well streptavidin plate were coated with 100 μl per well of 1 μM biotinylated digoxigenin in Assay Buffer. The streptavidin plate was incubated at RT for 1 h with slow shaking. After incu-bation, the streptavidin plate was washed two times. After washing, 100 μl per well of samples were added as triplicate. Samples were first diluted 1/100 in Assay Buffer before addition on the wells. For the quantifica-tion of immunoreactive Fab, 100 μl per well of purified Fab0 was used as a standard at final concentrations of 0; 0.0015; 0.003; 0.015; 0.03; 0.15; 0.3 μg/ml in Assay buffer. The streptavidin plate was incubated at RT for 1 h with slow shaking and subsequently washed two times. Immunoreactive Fabs were detected with 25 ng per 100 μl N1-Eu-chelate labelled anti-human Fab 2A11 and by incubating at RT for 1 h with slow shak-ing. The streptavidin plate was washed four times. Del-fia Enhancement solution was added and the plate was incubated at RT for 10 min with slow shaking, after which time-resolved europium signal at 615 nm was measured with Victor 1420 Multilabel Counter.
Up‑scaled Fab fragment expression
The anti-digoxigenin Fab fragment equipped with the best library clone PelB (N–0 2) (Additional file 1: Fig S1) and the parental PelB were expressed in 500 ml culture volume in three replicates in the same manner as the secondary screening of the libraries. The only exception was the OD (600 nm) of the induction which in this case was 0.6. After induction, 1 ml sample was taken from each culture and cells were pelleted as described above. The pellets were re-suspended in periplasmic extraction buffer and periplasmic extraction was implemented as described by Humphreys et al. [16]. Subsequently, the cells were pelleted and periplasmic extracts were col-lected. The pelleted cells were re-suspended in Assay Buffer and sonicated.
Colony PCR for sequencing
The top ranking 10% cohort of clones (see “secondary screening of the libraries”) was sequenced and for these purposes, Fab DNA from the cell samples taken after primary screening was amplified by colony PCR. First,
the cell samples were diluted in 1/16 in MQ water. Then the samples were amplified in the reactions containing 1× Taq buffer (NH4)SO4 (Thermo Scientific), 200 µM
dNTP mix (Thermo Scientific), 0.5 U Taq DNA polymer-ase (Thermo Scientific), 0.5 µl of diluted cell sample and 0.5 µM primers. Primer pair TH34 (5′-AAG GGC AAT CAG CTG TTG -3′) and pAKrev (5′-CGC CAT TTT TCA CTT CAC AG-3′) was used. Thermal cycling condition was initial denaturation 95 °C for 3 min, denaturation 95 °C for 30 s, annealing 48.5 °C for 30 s, extension 72 °C for 1 min and final extension 72 °C for 10 min. PCR cycle was repeated 34 times. The reactions were purified in enzymatic purification reactions containing 4 µl of PCR product, 0.8 µl of FastAP (1 U/µl) (Thermo Scientific), 0.4 µl of Exonuclease 1 (20 U/µl) (Thermo Scientific). Reactions were incubated at 37 °C for 15 min and inacti-vated at 85 °C for 15 min. After purification the samples were sequenced by Macrogen Inc. (Seoul, South Korea).
Sequence analysis
Statistical analysis
All statistical analyses were performed with IBM SPSS Statistics 22 (Armonk, USA). All statistical analyses that were used for the interpretation of results are shown and explained simultaneously with the representation of the results.
Results
Design of the synonymous PelB signal sequence libraries
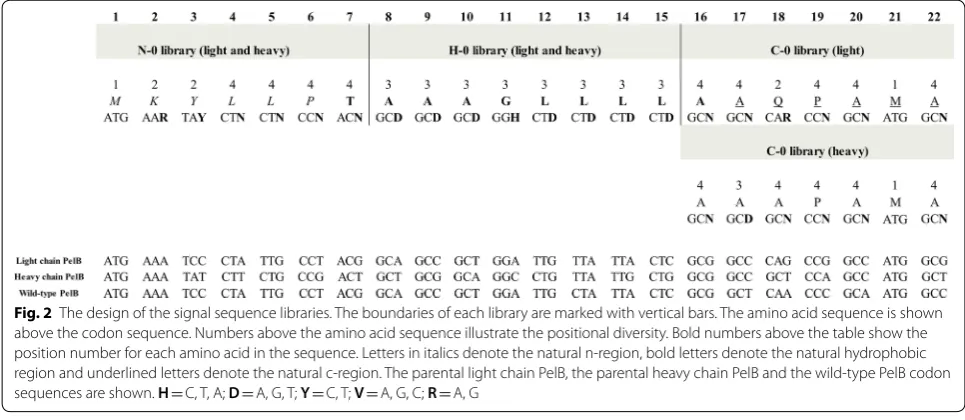
As a model system we used a codon-harmonized anti-digoxigenin Fab fragment, expressed in a bicistronic vec-tors under Lac P/O with both the light and heavy chain preceded by a PelB signal sequence. Codon sequences of parental light chain PelB, parental heavy chain PelB and wild-type PelB (GenBank Accession number: S51475) are shown in Fig. 2. Three synonymous signal sequence libraries, N–0, H–0 and C–0, were designed and estab-lished by mutating the third base of a codon in either the n-region, hydrophobic region or c-region of the PelB sig-nal sequences, respectively (Fig. 2). The given region was simultaneously diversified in both the light and the heavy chain PelB of the Fab. To facilitate the construction of the libraries and covering of theoretical diversity, few restric-tions in the library designs were made. The restricrestric-tions included, first of all, exclusion of TTA and TTG codons from leucine codon repertoire. Diversity was restricted also in the hydrophobic region, where variation at the third base position of each codon was limited to 3 bases (Fig. 2). In addition, the first threonine and the last ala-nine positions of the hydrophobic region were relocated in the N–0 library and C–0 library, respectively (Fig. 2). Diversity of the third base in the codon for the sec-ond alanine position in the c-region of the heavy chain PelB was also limited to 3 bases. In the situations where
positional diversity was restricted to three codons, the criterion for the exclusion was the similarity of codon usage frequencies between the codons. If two codons had codon usage frequencies close to each other, one of them was excluded. The restrictions were based on the codon usage frequency table of Escherichia coli K12 on Kazusa codon usage database [24]. The theoretical diver-sities of the N–0, H–0 and C–0 libraries were 1.05 × 10⁶,
4.3 × 10⁷ and 6.3 × 10⁶, respectively. Sizes of the N–0,
H–0 and C–0 libraries in pEB32x vector were 4.52 × 10⁸
cfu, 4.86 × 10⁸ cfu and 4.50 × 10⁷ cfu, respectively. After
libraries were cloned from pEB32x vector into pEB07 vector the library sizes were 7.56 × 10⁷ cfu, 8.40 × 10⁷ cfu
and 3.68 × 10⁷ cfu, respectively.
The highest expressing variants were obtained from the N–0 library
The libraries were initially expressed as a fusion with beta-lactamase and subjected to antibiotic selection to enrich functional clones. The enriched Fab genes were cloned to another bacterial expression vector to pro-duce soluble Fab fragments for the primary screening for expressions levels. Altogether, 837 individual clones were screened with time-resolved fluorometry based immu-noassay for the expression level of immunoreactive Fab and sorted according to the obtained signal levels. Top 10% cohort consisted of 40 N–0 library clones, 21 H–0 library clones and 23 C–0 library clones. All the clones belonging to the top 10% cohort and the parental Fab0 constructs included as controls in the screening cul-tures were sequenced. The library clones carrying valid signal sequences (no insertions, deletions, transitions or transversions) were directed to secondary screening. All clones having background (i.e. template) sequences
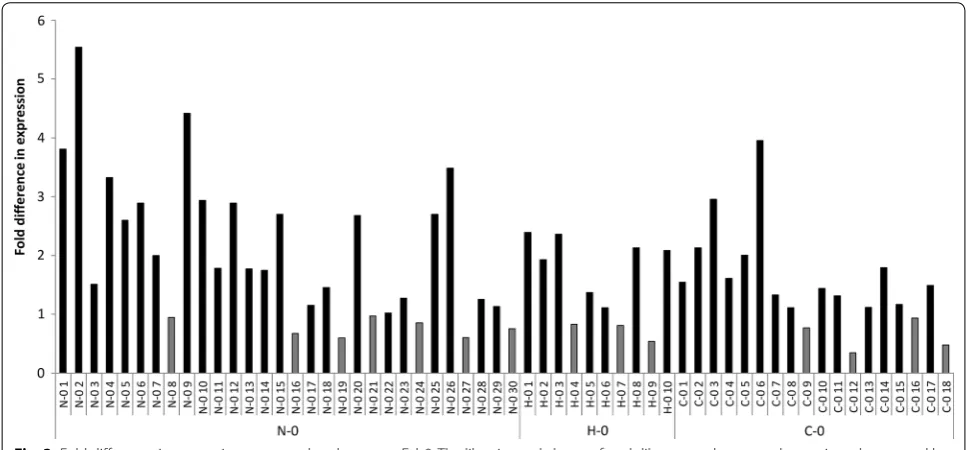
in both the chains were also ignored from secondary screening. However, if only one chain contained back-ground sequence, the variant was included into the set. The remaining clones consisted of 30, 10 and 18 Fab con-structs from the N–0, H–0 and C–0 libraries, respec-tively. Codon sequences of the clones are shown in Additional file 1: Fig. S1. To this end, the cells were cul-tured in 5 ml volume that enabled tighter control over the variables affecting expression than the primary screening cultures performed on 96-well plates. Based on the sec-ondary screening results, the best performing library in terms of increased expression was N–0 where 43% of the clones exhibited at least twofold increase and 17% at least threefold increase in expression compared to the par-ent Fab0 (Fig. 3). The corresponding values for the H–0 library were 40% and 0%, respectively and for C–0 library 22% and 6%, respectively. In the libraries N–0, H–0 and C–0, 23%, 30% and 22% of the clones showed decreased expression, respectively. The highest expressing variant, which exhibited over fivefold higher expression levels than the parent Fab0, was obtained from the N–0 library. The average expression of the parent Fab0 was 0.56 µg/ ml (n = 6).
Codon optimality of Leu‑5 of light chain PelB affects the amount of functional Fab fragment
To closer investigate the relation of the codon usage and the expression of the Fab, we analyzed the codon usage of the signal sequence libraries by using the relative adap-tiveness values (wi) of each codon and the CAI value
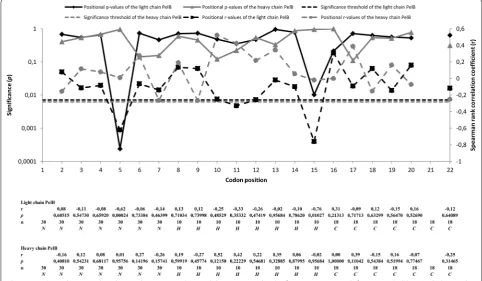
which is a geometrical mean of relative adaptiveness values [23]. Relative adaptiveness value of a codon is the usage frequency of the codon compared to the most fre-quently used codon encoding the same amino acid. The most frequently used codon encoding a given amino acid has the relative adaptiveness value of 1. Traditionally, the most frequently used codons are considered to be the most optimal ones [25]. Relative adaptiveness values for each codon were obtained from the Escherichia coli K-12 codon usage table compiled by Visual Gene Developer. The relative adaptiveness values were used when the effect of individual codon positions on the expression lev-els was assessed. The CAI value was used when the effect of codon pairs or the codon usage of whole regions on the expression levels was analyzed. We calculated Spear-man rank correlation coefficient between the relative adaptiveness values and the expression levels of immu-noreactive Fab fragment at each codon position in each library (Fig. 4). The analysis was implemented by plotting the expression levels of the clones in the libraries N–0 (n = 30), H–0 (n = 10) and C–0 (n = 10) against the rela-tive adaprela-tiveness values at each codon position, resulting in the same number of correlation coefficients as there were codon positions in the library. After Bonferroni cor-rection for multiple correlations, the analysis revealed that leucine position Leu-5 of the light chain PelB in the N–0 library (PelB n-region: MKYLLP) correlated signifi-cantly with the expression (n = 30, r =− 0.622, 2-tailed p = 0.00024) (Fig. 4). In addition, significant negative correlation was observed at leucine position Leu-15
of the light chain PelB in the H–0 library (PelB hydro-phobic region: TAAAGLLLLA) (n = 10, r =− 0.763, 2-tailed p = 0.01), but the significance was lost after the Bonferroni correction (Bonferroni corrected alpha level= 0.00625) (Fig. 4). No correlations between relative adaptiveness values and expression levels of immunore-active Fab fragment were found in C–0 library. Moreover, significant correlations were not found in the heavy chain PelB signal sequence.
Next, we pooled the clones in N–0 library accord-ing to the codon identity at position Leu-5 (CTA, CTC, CTG, CTT or TTG) and we calculated average expres-sion levels for each group. Closer look at position Leu-5 revealed that the most optimal leucine codon CTG (wi= 1) is especially deleterious for the expres-sion of immunoreactive Fab fragment, and further-more, Kruskal–Wallis analysis showed that the less optimal leucine codons CTA (wi= 0.0724) and CTT (wi= 0.2093) have significantly higher expression lev-els of immunoreactive Fab fragment than CTG codon (Fig. 5).
In addition to addressing the optimality of individual codons, we analyzed that of codon pairs (CAI of the codon pair) in each library and plotted the obtained val-ues against the expression levels of immunoreactive Fab fragment. Codon pairs that correlated with the expres-sion levels were observed only if one of the codons in the codon pair was at the position Leu-5. According to the Spearman rank correlation coefficient, both correlating codon pair positions, [Leu-4]-[Leu-5] (n = 30, r=− 0.511, p=0.004) and [Leu-5]-[Pro-6] (n = 30, r=− 0.486, p= 0.006), showed negative correlation with the expres-sion. As observed with single codons, non-optimal codon also in codon pairs increased the expression levels. Bon-ferroni corrected p-values for both correlations were 0.0167 and 0.0125, respectively.
After analyzing the positional correlations between the relative adaptiveness values and the expression levels of immunoreactive Fab fragment, we calculated CAI val-ues for the light and heavy chain PelB signal sequences of each clone in each library. Then the CAI values of the light and heavy chain PelB signal sequences were plotted
against expression levels of immunoreactive Fab frag-ment by using Spearman rank correlation coefficient. In the case of N–0 library, no correlations were observed either in the light (n = 30, r =− 0.354, 2-tailed p = 0.055) or in the heavy chain PelB (n = 30, r =− 0.040, 2-tailed p = 0.834). For the H–0 library, correlation between the CAI and expression level of immunoreactive Fab frag-ment was significant in the light chain PelB (n = 10, r =− 0.697, 2-tailed p = 0.025). Non-optimal codons increased expression levels in this case as well. How-ever, the correlation was lost (n = 10, r =− 0.360, 2-tailed p = 0.307) when the position Leu-15 was not taken into account. Furthermore, in the H–0 library, there was no correlation between the CAI and expression level of immunoreactive Fab fragment in the heavy chain PelB (n = 10, r = 0.250, 2-tailed p = 0.486). In the C–0 library, significant correlation between the CAI and expression level of immunoreactive Fab fragment was not observed in the light chain PelB (n = 18, r =− 0.059, 2-tailed p = 0.816) or in the heavy chain PelB (n = 18, r =− 0.035, 2-tailed p = 0.890).
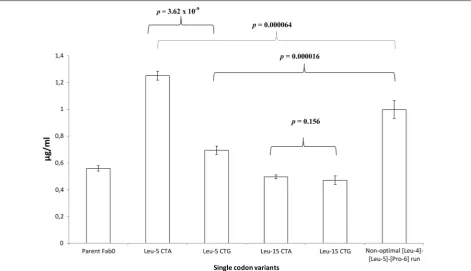
To confirm the findings made at the position Leu-5, we generated single codon variants by introducing CTA (the least optimal) or CTG (the most optimal) codon to the Leu-5 position of the light chain PelB of the parent Fab0 and compared the expression levels. Same muta-tions were introduced also to the position Leu-15. After
five independent parallel expressions, significant (T test, Equal variances assumed, Sig. 2-tailed p= 3.62 × 10⁻⁹)
difference was observed between Leu-5 CTA variant and Leu-5 CTG variant (Fig. 6). The Leu-5 CTA vari-ant exhibited on average 1.8-fold higher expression than the Leu-5 CTG variant (Fig. 6). However, the difference between the variants Leu-15 CTA and Leu-15 CTG was insignificant (T-test, Equal variances assumed, Sig. 2-tailed p= 0.156) (Fig. 6). Since it was observed that non-optimal [Leu-4]-[Leu-5] and [Leu5]-[Pro-6] codon pairs increased expression levels, we also produced a variant containing non-optimal codon run CTA–CTA– CCC (CCC codon is the least optimal proline codon) at position [Leu-4]-[Leu-5]-[Pro-6] and compared its aver-age expression levels to that of the Leu-5 CTA variant. Surprisingly, the non-optimal codon run variant exhib-ited 1.3-fold lower average expressions than the Leu-5 CTA variant (Fig. 6). The difference was also statistically significant (T-test, Equal variances assumed, Sig. 2-tailed p= 0.000064). Although the non-optimal codon run vari-ant exhibited lower average expression than the Leu-5 CTA variant, it however, exhibited significantly (T-test, Equal variances assumed, Sig. 2-tailed p= 0.000016) higher average expression (1.4-fold) than the Leu-5 CTG variant (Fig. 6).
Finally we compared the average expression levels of the single codon variants Leu-5 CTA and Leu-5 CTG to
the average expression levels of Leu-5 CTA and Leu-5 CTG codon pools. According to T-test, there were no significant differences in expression levels between the single codon variant Leu-5 CTA and Leu-5 CTA codon pool (T-test, Equal variances assumed, p= 0.054) or the single codon variant Leu-5 CTG and Leu-5 CTG codon pool (T-test, Equal variances not assumed, p= 0.134). The results show that the expression data regarding posi-tion Leu-5 in N–0 library is valid also when only codons at position Leu-5 are altered, further highlighting the importance of the position Leu-5.
Secondary structures of the mRNA in translation start sites of the light chain and the heavy chain affect the expression levels of immunoreactive Fab fragment, but in different ways
In many cases it has been shown that mRNA second-ary structures near the translation start site play a major role when it comes to the expression of pro-teins. For example, Osterman et al. showed that stable secondary structures sequestering the Shine-Dalgarno (SD) sequence and start codon inhibit expression [26]. In addition, Kudla et al. determined that mRNA folding energy in a region -4– + 37 nt is the most
important for expression [27], and furthermore, Good-man et al. and Bentele et al. demonstrated that rare codons are enriched at the N terminus of genes which reduces mRNA secondary structures in the transla-tion initiatransla-tion region [28, 29]. As the N-terminal signal sequences are generally located near the translation start site, it made sense to determine how the altera-tion of the codon sequence of the signal sequences affect the mRNA secondary structures in the transla-tion start site. In this study, local strength of second-ary structures (strength of the secondsecond-ary structures are presented as Gibbs free energy) in the mRNAs were determined by using “mRNA profile v2” module of the Visual Gene Developer. The module calculates the strength of secondary structures for the first 30 bases and then the window proceeds base-by-base along the mRNA and calculates the strength of secondary struc-tures for the next 30 bases. The analyzed region of the bicistronic mRNA covered the sequence starting from the Lac promoter and ending at last amino acid of the heavy chain (see Fig. 1). Like done above, Spearman correlation coefficient was calculated between pre-dicted Gibbs free energy and the expression levels of immunoreactive Fab fragment at each base position to
find out, which positions have a significant effect on the expression levels. After Bonferroni correction (alpha level = 0.0013), the sliding window analysis showed that the 30 nt region centered around 155–157 and 159–160 nt which located between the light chain SD and the start codon (hereafter referred as significant translation initiation region, significant TIR) of the N–0 library correlated significantly with the expression (Fig. 7). It was observed that reduced mRNA secondary structures of the significant TIR correlated with higher expression (positive Spearman rank correlation coefficient). One significant 30 nt region that was centered around 886 nt was found from the proximity of the heavy chain SD and unlike significant TIR of the light chain, the region centered around 886 nt correlated negatively (n = 30, r=− 573, p=0.0009; Bonferroni corrected alpha level = 0.00128) with the expression, that is, lower Gibbs free energy (more stable secondary structures) resulted in higher expression. No correlations between positional Gibbs free energy and expression were found in H-0 and C-0 libraries.
Bioinformatics analysis revealed that there was a strong negative correlation (n = 30, r =− 0.845, p = 4.2 × 10⁻⁹) between the average Gibbs energy of mRNA secondary structure of the significant TIR (as analyzed with 30 nt window centered around nucleotide
positions 155–157, 159–160) and codon optimality at position Leu-5. Especially the optimal codon CTG at Leu-5 position decreased the Gibbs free energy of mRNA secondary structures, which is logical since it is GC-rich. To see if the codon optimality at position Leu-5/mRNA secondary structure strength combina-tion had additive independent effects on the expres-sion levels and to exclude the effect of codon identity on the Gibbs free energy of the secondary structure, we pooled the clones in N–0 library according to the codon identity at position Leu-5 (CTA, CTC, CTG and CTT) like it was done above in the analysis of codon pools. Then we plotted the expression levels against the average Gibbs free energy of the TIR and analyzed the correlation with Spearman rank correlations coefficient in each pool. It was observed that especially in the CTA codon pool there was a strong and significant positive correlation (n = 6, r = 0.845, p = 0.034) between the average Gibbs free energy and the expression levels. Such correlation was not observed in other codon pools CTT (n = 7, r = 0.642, p = 0.120), CTC (n = 7, r = 0.600, p = 0.154) or CTG (n = 6, r = 0.525, p = 0.285). We further explored the relationship between the mRNA secondary structures in the significant TIR and the codon optimality at position Leu-5 by comparing previ-ously introduced single codon variant Leu-5 CTA and
new single codon variant Leu-5 TTA. Both variants have exactly the same Gibbs free energy profile of the mRNA according to the “mRNA profile v2” module of the Visual Gene Developer. However, CTA codon has the relative adaptiveness value (wi) of 0.0724, whereas
TTA codon has the relative adaptiveness value (wi) of
0.2636. After 3 h of induction, it was observed that the single codon variant Leu-5 CTA exhibited 26% higher expression levels of immunoreactive Fab fragment than the single codon variant Leu-5 TTA. The differ-ence between the variants was also statistically signifi-cant (five independent expressions) according to T-test (Equal variances assumed, Sig. 2-tailed p= 0.000004).
Synonymous codon pairs are enriched in the hydrophobic region
It was shown in yeast Saccharomyces cerevisiae that if the same amino acids reside next to each other, the latter one favors the same codon as the previous one [30]. Later this phenomenon, “synonymous codon pair bias”, was also detected in many bacterial species [31]. Since the PelB signal sequence includes leucine pair in the n-region, alanine and leucine runs in the hydrophobic region and alanine run in the c-region, we investigated if synony-mous codon pair bias is observed in the clones of PelB signal sequence libraries. The synonymous codon pairs were detected in all libraries and in both PelBs, apart from the light chain PelB of the C–0 library (Fig. 8a–c). Biased use of synonymous codon pairs was observed in the case of alanine pair (A8–A9) of the heavy chain PelB of the H–0 library (Fig. 8b). The alanine pair [Ala-8]–[Ala-9] with synonymous codon pair GCT–GCT or GCG–GCG exhibited, on average, almost twofold higher expression levels of immunoreactive Fab fragment than the alanine pair without synonymous codon pair. The difference between the two groups, with and without the synonymous codon pair, was statistically significant according to the T-test (Equal variances assumed, Sig. 2-tailed p= 0.006). In general, the H–0 library was highly occupied with synonymous codon pairs compared to the other libraries. Of the H–0 library clones, 90% had syn-onymous codon pair in the light chain PelB and 70% had synonymous codon pair in the heavy chain PelB. Respec-tive values for the N–0 library were 40% and 17% and for the C–0 library 6% and 56%.
Up‑scaled Fab fragment expression
To confirm that the results are applicable also in larger culture volume, the anti-digoxigenin Fab fragment was expressed in E. coli XL1-Blue in 500 ml culture volume with two different PelB codon sequences: the best library clone PelB codon sequence (N–0 2) (Additional file 1:
Fig S1) and the parental PelB (the parent Fab0) codon sequence. Both expressions were implemented in trip-licates. In order to determine the effect of codon usage on translocation efficiency of the Fab fragment, cells were fractionated to periplasmic fraction and cytoplas-mic fraction. Like in 5 ml culture volume, the best library clone outperformed the parent Fab0 also in 500 ml cul-ture volume. According to the immunoassay measure-ment of the periplasmic extract, the codon sequence of the best library clone PelB indeed enhanced the translo-cation of the immunoreactive Fab fragment to the peri-plasm. It was observed that in the case of the best library clone PelB, 78% of the total amount of the immunoreac-tive Fab fragment (1.97 µg in 1 ml volume) was found in the periplasm. The respective efficiency for the parental PelB was only 59% (0.56 µg in 1 ml volume). The differ-ence in the amount of immunoreactive Fab fragment in the periplasm between the two sequences was also statis-tically significant (T-test, Equal variances assumed, Sig. 2-tailed p= 0.005).
The best library clone light and heavy chain PelBs (N–0 2) together also improve the expression levels of other Fab fragments
Discussion
In the present study we introduced synonymous muta-tions into the PelB signal sequences of the light and heavy chain genes coding for a human anti-digoxigenin Fab molecule. The PelB signal sequence is composed of three
structurally distinguishable regions that were diversi-fied in parallel resulting in the signal sequence libraries N–0 (diversified n-region), H–0 (diversified hydropho-bic region) and C–0 (diversified c-region). Furthermore, the equivalent regions (n, h or c) were simultaneously
diversified in the light chain PelB and the heavy chain PelB. The screening of the three libraries with immuno-assays showed that the N–0 library was the best source for obtaining clones with improved expression. In the N–0 library, 43% of the clones exhibited at least twofold increase in expression and 17% at least threefold increase in expression compared to the Fab0. The highest express-ing variant exhibited over fivefold increase in expression. The respective percentages for twofold and threefold increases were 40% and 0% in the H–0 library and 22% and 6% in the C–0 library. However, 23%, 30% and 22% of the N–0, H–0 and C–0 library clones showed decreased expression in the secondary screening, which points towards the inherently high variation in the expression results in the primary screening campaign, which are caused by the challenges to normalize the cell number and growth phase of cells in 96-plate format.
A detailed analysis of positional effects of synonymous codon usage in PelB on Fab expression revealed that the identity of the fifth leucine codon in the light chain PelB affected the expression levels significantly. Especially CTG, the most optimal leucine codon, had deleterious effect on the expression, whereas the less optimal codons CTT and CTA had a beneficial effect on expression (Fig. 5). The finding was further confirmed with single codon variants of Leu-5 (Fig. 6) showing that the wild-type codon TTG does not yield the best result for Fab expression. Furthermore, the n-regions of the wild-type PelB and the parent PelB are identical (Fig. 2). The benefi-cial effect of non-optimal codons has been described ear-lier [11, 12, 32], but our results suggest that the position of non-optimal codon matters more than the mere num-ber of non-optimal codons since the non-optimal codon triplet [Leu-4]-[Leu-5]-[Pro-6] did not increase the expression levels (Fig. 6). Moreover, we did not observe any significant correlation between lower CAI values and increased expression levels.
Previously, it has been shown that the folding energy of mRNA secondary structures in the translation initia-tion region can have a major impact on expression and that non-optimal/rare codons are enriched at the N-ter-minus of genes, which typically reduce mRNA secondary structures in the translation initiation region as AT-rich codons [27–29]. Our findings support these results as reduced folding energy of mRNA secondary structures at the translation initiation region of the light chain coincided with increased Fab expression (Fig. 7). How-ever, we found that the N-terminal codon usage might also have an effect on expression, which is independent from the mRNA secondary structure. The single codon variant Leu-5 CTA and Leu-5 TTA had identical Gibbs free energy profiles indicating similar mRNA secondary structures, but the Fab expression of Leu-5 CTA variant
was 26% higher than that of Leu-5 TTA at 3 h time point post induction. Zalucki et al. hypothesized that the com-bination of rapid translation initiation and non-optimal codons in the leader peptide could be related to higher efficiency in protein translocation or recycling of chap-erones [33]. Our results suggest that reduced mRNA secondary structure at the translation initiation site and non-optimal codon usage at a particular position can have additive independent roles on protein translocation efficiency. Regarding the relationship between the mRNA secondary structure and the expression levels, it was interesting that the 30 nt region centered around position 886 nt, which was located just before the translation ini-tiation region of the heavy chain, increased mRNA sec-ondary structures correlated with increased expression levels.
In the H–0 library, only significant factor explaining the expression difference was the usage of synonymous codon pairs. In fact, the synonymous codon pairs were highly enriched in the H–0 library when compared to the other libraries (Fig. 8). This enrichment might be related to structural sensitivity of the regions with high hydro-phobicity. Pechmann and Frydman showed that optimal codons, which are translated faster, are enriched in the hydrophobic regions [34]. In addition, Cannarrozzi et al. found that usage of synonymous codon pairs can increase translation speed up to 30% [30]. Therefore, it is plausi-ble that enrichment of synonymous codon pairs is due to the structural sensitivity of the hydrophobic region. It is worth noticing that either hydrophobic region of the heavy chain of the parent PelB or the wild-type PelB don’t contain any synonymous codon pairs (Fig. 2). Moreo-ver, we demonstrate that improved PelB codon sequence obtained from the library screening enhances the expres-sion of the Fab fragment also in 500 ml culture scale, and in addition, in combination with different Fab genes.
Conclusions
mRNA secondary structures and synonymous codon pairs on the expression of Fab fragment.
Supplementary information
Supplementary information accompanies this paper at https ://doi. org/10.1186/s1293 4-019-1210-1.
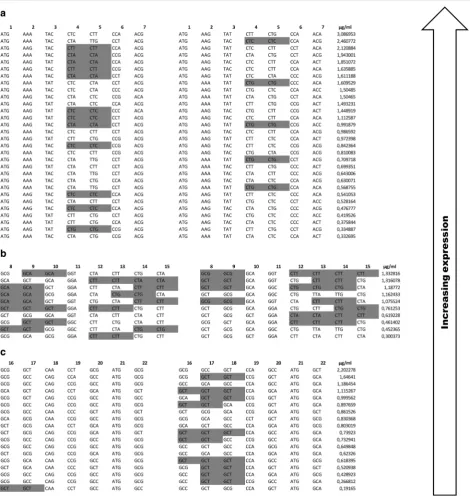
Additional file 1: Table S1. Primers used in the diversification of the regions of the PelB signal sequence. Fig. S1. Codon sequences of the ana-lyzed library clones. The light chain PelB codon sequences of the variants are shown in the left column and the heavy chain PelB codon sequences of the variants are shown in the right column.
Acknowledgements
Not applicable.
Authors’ contributions
AK performed the experiments, analyzed the data and wrote the paper. AK, TH and UL participated in designing the experiments. TH and UL reviewed the manuscript and gave notes to improve the manuscript. All authors read and approved the final manuscript.
Funding
This study was funded by the University of Turku Graduate School (UTUGS) and Business Finland (Grant no. 2448/31/2018).
Availability of data and materials
All data generated or analyzed during this study are included in the published article (and its additional file).
Ethics approval and consent to participate
Not applicable.
Consent for publication
Not applicable.
Competing interests
The authors declare that they have no competing interests.
Received: 9 May 2019 Accepted: 6 September 2019
References
1. Gaciarz A, Veijola J, Uchida Y, Saaranen MJ, Wang C, Hörkkö S, et al. Systematic screening of soluble expression of antibody fragments in the cytoplasm of E. coli. Microb Cell Fact. 2016. https ://doi.org/10.1186/s1293 4-016-0419-5.
2. Skerra A, Pluckthun A. Assembly of a functional immunoglobulin Fv frag-ment in E. coli. Science. 1988;240:1038–41.
3. Frenzel A, Hust M, Schirrmann T. Expression of recombinant antibodies. Front Immunol. 2013. https ://doi.org/10.3389/fimmu .2013.0021. 4. Baumgarten T, Ytterberg AJ, Zubarev RA, de Gier JW. Optimizing
recombi-nant protein production in the Escherichia coli periplasm alleviates stress. Appl Environ Microbiol. 2018;84:1–12.
5. Owji H, Nezafat N, Negahdaripour M, Hajiebrahimi A, Ghasemi Y. A com-prehensive review of signal peptides: structure, roles, and applications. Eur J Cell Biol. 2018;97:422–41.
6. Singh P, Sharma L, Kulothungan SR, Adkar BV, Prajapati RS, Ali PSS, et al. Effect of signal peptide on stability and folding of Escherichia coli thiore-doxin. PLoS ONE. 2013;8:e63442.
7. Thie H, Schirrmann T, Paschke M, Dübel S, Hust M. SRP and Sec pathway leader peptides for antibody phage display and antibody fragment production in E. coli. N Biotechnol. 2008;25:49–54.
8. Hust M, Dubel S. Phage display vectors for the in vitro generation of human antibody fragments. Methods Mol Biol. 2005;295:71–96.
9. Mergulhão FJM, Summers DK, Monteiro GA. Recombinant protein secre-tion in Escherichia coli. Biotechnol Adv. 2005;23:177–202.
10. de Marco A. Strategies for successful recombinant expression of disulfide bond-dependent proteins in Escherichia coli. Microb Cell Fact. 2009;8:26. 11. Zalucki YM, Gittins KL, Jennings MP. Secretory signal sequence
non-optimal codons are required for expression and export of beta-lactamase. Biochem Biophys Res Commun. 2008;366:135–41.
12. Zalucki YM, Jones CE, Ng PSK, Schulz BL, Jennings MP. Signal sequence non-optimal codons are required for the correct folding of mature malt-ose binding protein. Biochim Biophys Acta Biomembr. 2010;1798:1244–9. 13. Power PM, Jones RA, Beacham IR, Bucholtz C, Jennings MP. Whole
genome analysis reveals a high incidence of non-optimal codons in secretory signal sequences of Escherichia coli. Biochem Biophys Res Commun. 2004;322:1038–44.
14. Samant S, Gupta G, Karthikeyan S, Haq SF, Nair A, Sambasivam G, et al. Effect of codon-optimized E. coli signal peptides on recombinant Bacillus stearothermophilus maltogenic amylase periplasmic localization, yield and activity. J Ind Microbiol Biotechnol. 2014;41:1435–42.
15. Stemmer WPC, Morris SK, Kautzer CR, Wilson BS. Increased antibody expression from Escherichia coli through wobble-base library mutagen-esis by enzymatic inverse PCR. Gene. 1993;123:1–7.
16. Humphreys DP, Carrington B, Bowering LC, Ganesh R, Sehdev M, Smith BJ, et al. A plasmid system for optimization of Fab′ production in Escherichia coli: importance of balance of heavy chain and light chain synthesis. Protein Expr Purif. 2002;26:309–20.
17. Kulmala A, Huovinen T, Lamminmäki U. Effect of DNA sequence of Fab fragment on yield characteristics and cell growth of E. coli. Sci Rep. 2017.
https ://doi.org/10.1038/s4159 8-017-03957 -6.
18. Huovinen T, Syrjänpää M, Sanmark H, Brockmann E, Azhayev A, Wang Q, et al. Two ScFv antibody libraries derived from identical VL–VH framework with different binding site designs display distinct binding profiles. Protein Eng Des Sel. 2013;26:683–93.
19. Huovinen T, Brockmann E, Akter S, Perez-Gamarra S, Yla J, Liu Y, et al. Primer extension mutagenesis powered by selective rolling circle amplification. PLoS ONE. 2012;7:e31817. https ://doi.org/10.1371/journ al.pone.00318 17.
20. Sidhu SS, Lowman HB, Cunningahm BC, Wells JA. Phage display for selec-tion of novel binding peptides. Methods Enzymol. 2000;328:333–63. 21. Huovinen T, Julin M, Sanmark H, Lamminmäki U. Plasmid enhanced error-prone RCA mutagenesis by concatemer resolution. Plasmid. 2011;66:47–51.
22. Jung SK, McDonald K. Visual gene developer: a fully programmable bioinformatics software for synthetic gene optimization. BMC Bioinform. 2011;12:1–13.
23. Sharp PM, Li W. The codon adaptation index—a measure of directional synonymous codon usage bias, and its potential applications. Nucleic Acids Res. 1987;15:1281–95.
24. Nakamura Y, Gojobori T, Ikemura T. Codon usage tabulated from the international DNA sequence databases; its status 1999. Nucleic Acids Res. 1999;27:292.
25. Tuller T. Challenges and obstacles related to solving the codon bias rid-dles. Biochem Soc Trans. 2014;42:155–9.
26. Osterman IA, Evfratov SA, Sergiev PV, Dontsova OA. Comparison of mRNA features affecting translation initiation and reinitiation. Nucleic Acids Res. 2013;41:474–86.
27. Kudla G, Murray AW, Tollervey D, Plotkin JB. Coding-sequence determi-nants of gene expression in Escherichia coli. Science. 2009;324:255–8. 28. Goodman DB, Church GM, Kosuri S. Causes and effects of N-terminal
codon bias in bacterial genes. Science. 2013;342:475–9.
29. Bentele K, Saffert P, Rauscher R, Ignatova Z, Blüthgen N. Efficient transla-tion initiatransla-tion dictates codon usage at gene start. Mol Syst Biol. 2013.
https ://doi.org/10.1038/msb.2013.32.
30. Cannarrozzi G, Schraudolph NN, Faty M, von Rohr P, Friberg MT, Roth AC, et al. A role for codon order in translation dynamics. Cell. 2010;141:355–67.
31. Shao ZQ, Zhang YM, Feng XY, Wang B, Chen JQ. Synonymous codon ordering: A subtle but prevalent strategy of bacteria to improve transla-tional efficiency. PLoS One. 2012;7:e33547.
•fast, convenient online submission •
thorough peer review by experienced researchers in your field • rapid publication on acceptance
• support for research data, including large and complex data types •
gold Open Access which fosters wider collaboration and increased citations maximum visibility for your research: over 100M website views per year •
At BMC, research is always in progress.
Learn more biomedcentral.com/submissions
Ready to submit your research? Choose BMC and benefit from: 33. Zalucki YM, Beacham IR, Jennings MP. Biased codon usage in signal
peptides: a role in protein export. Trends Microbiol. 2009;17:146–50. 34. Pechmann S, Frydman J. Evolutionary conservation of codon optimality
reveals hidden signatures of cotranslational folding. Nat Struct Mol Biol. 2013;20:237–43.
Publisher’s Note