Geosci. Model Dev., 6, 263–282, 2013 www.geosci-model-dev.net/6/263/2013/ doi:10.5194/gmd-6-263-2013
© Author(s) 2013. CC Attribution 3.0 License.
EGU Journal Logos (RGB)
Advances in
Geosciences
Open Access
Natural Hazards
and Earth System
Sciences
Open Access
Annales
Geophysicae
Open Access
Nonlinear Processes
in Geophysics
Open Access
Atmospheric
Chemistry
and Physics
Open Access
Atmospheric
Chemistry
and Physics
Open Access
Discussions
Atmospheric
Measurement
Techniques
Open Access
Atmospheric
Measurement
Techniques
Open Access
Discussions
Biogeosciences
Open Access Open Access
Biogeosciences
DiscussionsClimate
of the Past
Open Access Open Access
Climate
of the Past
Discussions
Earth System
Dynamics
Open Access Open Access
Earth System
Dynamics
Discussions
Geoscientific
Instrumentation
Methods and
Data Systems
Open Access
Geoscientific
Instrumentation
Methods and
Data Systems
Open Access
Discussions
Geoscientific
Model Development
Open Access Open Access
Geoscientific
Model Development
Discussions
Hydrology and
Earth System
Sciences
Open Access
Hydrology and
Earth System
Sciences
Open Access
Discussions
Ocean Science
Open Access Open Access
Ocean Science
Discussions
Solid Earth
Open Access Open Access
Solid Earth
Discussions
The Cryosphere
Open Access Open Access
The Cryosphere
Discussions
Natural Hazards
and Earth System
Sciences
Open Access
Discussions
Development of a parameterization of black carbon aging for use in
general circulation models
N. Oshima1and M. Koike2
1Meteorological Research Institute, 1-1 Nagamine, Tsukuba, Ibaraki, 305-0052, Japan.
2Department of Earth and Planetary Science, Graduate School of Science, The University of Tokyo, 7-3-1 Hongo,
Bunkyo-ku, Tokyo, 113-0033, Japan
Correspondence to: N. Oshima ([email protected])
Received: 27 April 2012 – Published in Geosci. Model Dev. Discuss.: 16 May 2012 Revised: 31 January 2013 – Accepted: 31 January 2013 – Published: 1 March 2013
Abstract. A parameterization of black carbon (BC) aging
in the atmosphere is developed for use in general circula-tion models (GCMs) that separately treat hydrophobic BC and hydrophilic BC modes but do not explicitly calculate the aging processes of BC. The rate of BC aging is expressed as the conversion rate from hydrophobic BC to hydrophilic BC modes (i.e., inverse of the e-folding time of the conver-sion, 1/τBC). In this study, the conversion rates are estimated using results of detailed calculations by a size and mixing state resolved aerosol box model with numerous initial con-ditions. We introduce a new concept, the hydrophobic-BC-mass-normalized coating rate (VBC), defined as the rate of increase of the mass concentration of condensed materials on hydrophobic BC normalized by the hydrophobic BC mass concentration. Although the conversion rate largely varies depending on the atmospheric conditions and the concen-trations of chemical species, we find that the variations of the conversion rate are generally expressed well by a unique function of VBC for given lognormal size distributions of
hydrophobic BC. The parameterized conversion rate is ex-pressed as a function ofVBC, which enables the
representa-tion of diurnal and seasonal variarepresenta-tions of the BC aging rate and its spatial differences in polluted and clean air, while other widely used constant conversion rates cannot. Applica-tion of our newly developed parameterizaApplica-tion to GCMs will provide more reliable estimates of the spatial distribution of BC and its radiative effects at regional and global scales.
1 Introduction
Consequently, aging processes of BC particles play an im-portant role for the spatial distributions of BC and its radia-tive effects.
Recently, the number of general circulation mod-els (GCMs) that explicitly treat aerosol microphysics with a representation of the aerosol size distribution by modal or sectional methods has been growing rapidly. For example, GATOR-GCMM (Jacobson, 2001b), ECHAM5-HAM (Stier et al., 2005), ModelE-MATRIX (Bauer et al., 2008), WACCM/CARMA (Bardeen et al., 2008), EMAC/MADE-in (Aquila et al., 2011), and CAM5-MAM7 (Liu et al., 2012) provide detailed representations of the aging processes of BC through condensation and coagulation, and some of these models are used for global climate simulations. However, there are still many GCMs that treat the BC aging pro-cesses as a simple time scale conversion from hydropho-bic to hydrophilic states using the bulk method, in which only mass concentrations of aerosol species are predicted with the prescribed aerosol size distributions. For exam-ple, among a total of 15 models included in the Aerosol Model Intercomparison Initiative (AeroCom) Phase II direct aerosol effect experiment (Myhre et al., 2012), more than half either use a time scale conversion for the BC aging pro-cesses (e.g., HadGEM2; Bellouin et al., 2011; and NCAR-CAM3.5; Lamarque et al., 2012) or ignore BC aging pro-cesses altogether (e.g., GISS-ModelE (Koch et al., 2007) and SPRINTARS (Takemura et al., 2005)). Most models partici-pating in the Atmospheric Chemistry and Climate Model In-tercomparison Project (ACCMIP) (Lee et al., 2012) also treat the BC aging processes with the time scale conversion (e.g., GISS-E2-R; Koch et al., 2011, GFDL-AM3; Donner et al., 2011, and CICERO-OsloCTM2; Skeie et al., 2001). In addi-tion to some of these models, there are several models that participate in the Climate Model Intercomparison Project phase 5 (CMIP5) in support of the Intergovernmental Panel on Climate Change (IPCC) Fifth Assessment Report (AR5) and treat BC aging processes with a simple time scale conver-sion (e.g., MRI-CGCM3; Yukimoto et al., 2012). For climate calculations with long time integration (decades to centuries) and/or with fine spatial resolution by coupled atmosphere– ocean global climate models, a simple parameterization that can capture the essentials of BC aging processes is still de-sirable due to limited computational resources, instead of the explicit treatment of aerosol microphysics in models, which are computationally expensive.
In the GCMs that treat aerosol species on the basis of the bulk method, the aging processes of BC particles are gener-ally expressed as a conversion of BC from hydrophobic to hydrophilic modes with a characteristic time:
∂[BC phob] ∂t
= −[BCphob] τBC
; (1)
∂[BC phil] ∂t
=[BCphob]
τBC , (2)
where [BCphob] and [BCphil] are the hydrophobic and
hy-drophilic BC mass concentrations, respectively, and τBC is the e-folding time of the conversion. A simple approach us-ing constant values of the conversion rate from hydrophobic BC to hydrophilic BC, such as 24 or 36 h, has been widely used in several GCM studies (e.g., Cooke and Wilson, 1996; Cooke et al., 1999, 2002; Lohmann et al., 1999; Koch, 2001; Chung and Seinfeld, 2002; Bellouin et al., 2011; Donner et al., 2011; Lamarque et al., 2012), although the conversion rate is considered to vary depending on atmospheric condi-tions and concentracondi-tions of chemical species during the ag-ing process. Previously, Koch (2001) and Wilson et al. (2001) calculated the variable conversion rates of BC aging depend-ing on the condensation of sulfuric acid (H2SO4), produced
from gas-phase oxidation of sulfur dioxide (SO2). Riemer et al. (2004) presented a detailed parameterization of BC ag-ing usag-ing results of mesoscale aerosol model simulations that treated condensation and coagulation of several species of aerosols. They showed that the conversion time scale is 2 h above 250 m and 8 h below during daytime and a function of the number concentration of internally mixed particles during nighttime. However, their parameterization (i.e., the
τBCvalues of 2 and 8 h during daytime and Eq. (7) given by
Riemer et al. (2004) during nighttime) will be applicable only for a polluted region over land (e.g., Germany). Recently, Liu et al. (2011) developed a parameterization of BC aging using a function of hydroxyl (OH) radical concentration, defined as follows:
1
τBC = β· [OH] + δ, (3)
whereβ (i.e., a fast-aging term, such as condensation) andδ
(i.e., a slow-aging term such as coagulation, assuming an e-folding conversion time of 20 days) are constants with values 4.6×10⁻¹²cm3molecule−1s−1and 5.8×10⁻⁷s−1, respec-tively, and [OH] is the OH radical concentration. However, use of a constantβvalue in the fast-aging term neglects de-pendencies of BC aging on condensable materials and their precursors (e.g., SO2). Conversion rates have been
recog-nized as one of the key uncertainties in estimating the im-pacts of BC on climate (Cooke et al., 2002; Chung and Sein-feld, 2005; Goto et al., 2012). Recent studies pointed out the necessity of an advanced parameterization of BC aging pro-cesses applicable to various atmospheric conditions in GCMs in order to improve the quantitative estimation of the climate impacts of BC (Wilson et al., 2001; Riemer et al., 2004; Croft et al., 2005; Liu et al., 2005; Park et al., 2005; Tsyro et al., 2007; Koch et al., 2009; Liu et al., 2011).
the condensation process, because it is one of the most im-portant BC aging processes under most atmospheric condi-tions. The new parameterization is expressed as the conver-sion rate of BC particles from hydrophobic BC to hydrophilic BC modes, using results of detailed calculations by a size and mixing state resolved aerosol box model (Sects. 2 and 3). A method for applying our parameterization to GCMs is described in Sect. 4. Variations ofτBCdue to changes in
at-mospheric conditions and concentrations of chemical species derived from the calculations are shown in Sect. 5. Estimates of the time scale of BC aging due to coagulation and recom-mended treatments of the coagulation effects in our parame-terization are described in Sect. 6 and Appendix A.
2 Methodology
2.1 MADRID-BC
In this study, we use the Model of Aerosol Dynamics, Reaction, Ionization, and Dissolution (MADRID) (Zhang et al., 2004) with resolution of the mixing state of BC (MADRID-BC) (Oshima et al., 2009a). MADRID-BC is a stand-alone size and mixing state resolved aerosol box model that includes the gas-phase chemistry of the Carbon-Bond Mechanism Version IV (CBM-IV) photochemical mecha-nism (Gery et al., 1989). Photolysis rates of chemical re-actions treated in the Community Multiscale Air Quality (CMAQ) model are utilized in MADRID-BC (Byun and Ching, 1999). Heterogeneous reactions on the surface of par-ticles are also included in MADRID-BC (Zhang et al., 2004), in which the median values of the uptake coefficient (γ) recommended by Jacob (2000) are used (i.e., γHO2 =0.2,
γNO2=10 −4, γ
NO3=10
−3, and γ
N2O5=0.1). MADRID-BC uses a two-dimensional (2-D) aerosol representation in which aerosol mass and number are given for individual ranges of particle diameters and BC mass fractions (see Os-hima et al., 2009a, Fig. 1). In addition to BC-containing parti-cles, externally mixed BC-free particles are represented sep-arately. In the 2-D aerosol representation, the diameter and BC mass fraction of particles can vary between the low and high edges of the size and BC mass fraction bins, respec-tively, and the transfer of particle number and mass due to their growth and shrinkage can be simulated simultaneously in both directions (i.e., particle diameter and BC mass frac-tion) on the basis of the moving center approach (Jacob-son, 1997). Aerosol species treated in MADRID-BC include sulfate (SO24−), ammonium (NH+4), nitrate (NO−3), sodium (Na+), chloride (Cl−), aerosol water, BC, and organic mat-ter (OM). MADRID-BC treats mass transfer between gas and particulate phases using a dynamic (kinetic) non-equilibrium approach developed by Meng et al. (1998), and it enables accurate calculations of the time evolution of the entire BC mixing state resulting from condensation/evaporation processes. Condensation/evaporation involving secondary
organic aerosols (SOAs) and their precursors is not in-cluded in the dynamic approach in MADRID-BC, although the method presented in this paper can be extended when SOAs and their precursors are included in condensable ma-terials (see Sect. 3.3). The BC aging processes due to co-agulation and photochemical oxidation are not included in MADRID-BC, although contributions of coagulation to BC aging may be important under certain circumstances (e.g., over source regions and during nighttime) (Riemer et al., 2010). The effects of coagulation on BC aging are described in Sect. 6 and Appendix A. MADRID-BC treats homoge-neous nucleation processes (Zhang et al., 2004); however, they are not used in this study. The dilution of air, dry and wet deposition, and aqueous-phase chemistry in cloud parti-cles are not included in MADRID-BC. Meteorological con-ditions (e.g., air density, pressure, temperature (T), relative humidity (RH), and cloud/rain information) are kept constant throughout each MADRID-BC calculation.
MADRID-BC calculates the critical supersaturation of particles using the K¨ohler equation (Seinfeld and Pandis, 2006), in which the saturation ratio,S, at equilibrium over an aqueous solution droplet is expressed as
lnS= A Ddrop
− B
(Ddrop3 −d3 core)
, (4)
where
A=4Mwσw RT ρw , B=
6nsMw πρw ,
ns=
(1−εcore) Ms
υπ ds3
61−εcore
ρs +
εcore
ρcore
(5)
andDdrop,dcore, and ds are the volume equivalent
diame-ters of droplet, core, and dry particles, respectively, σw is the surface tension of water,Mw andMs are the molecular weights of water and solute, respectively,ρw,ρs, and ρcore
are the densities of water, solute, and core, respectively,υis the van’t Hoff factor, andεcoreis the insoluble mass fraction (i.e., BC mass fraction). BC is treated as an insoluble con-centric core for BC-containing particles, and other aerosol components are assumed to be soluble materials that con-dense onto BC-containing and BC-free particles. When the critical supersaturation of BC-containing particles is lower (greater) than a given air supersaturation, these particles are defined as hydrophilic (hydrophobic) BC, namely CCN (non-CCN). By estimating the CCN activity of BC-containing par-ticles for the entire BC mixing state (i.e., each grid cell in the 2-D aerosol representation), MADRID-BC can calculate mass concentrations of hydrophobic BC and hydrophilic BC for an air parcel at a given supersaturation (Oshima et al., 2009b).
2.2 Calculation of conversion rate (1/τBC)
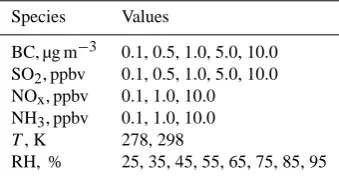
Table 1. Summary of all initial parameters used in the calculations.∗
Species Values
BC, µg m−3 0.1, 0.5, 1.0, 5.0, 10.0 SO2, ppbv 0.1, 0.5, 1.0, 5.0, 10.0
NOx, ppbv 0.1, 1.0, 10.0
NH3, ppbv 0.1, 1.0, 10.0
T, K 278, 298
RH, % 25, 35, 45, 55, 65, 75, 85, 95
∗To reduce the number of calculations, we only used
combinations of NOxand NH3values (NOx, NH3) of (0.1, 0.1), (0.1, 10.0), (1.0, 1.0), (10.0, 0.1), and (10.0, 10.0) with combinations of all the other parameters. A total of 48 000 calculations, namely 5 (BC) ×5 (SO2)×5 (NOxand NH3)× 2 (T)×8 (RH)×24 (hourly photolysis rates), were conducted for a given BC size distribution.
various atmospheric conditions, from polluted to clean air, using the MADRID-BC model with numerous initial condi-tions. Because MADRID-BC calculates mass concentrations of condensed materials (e.g., SO24−and NO−3) onto BC par-ticles and BC-free parpar-ticles from their precursor gases (e.g., H2SO4and nitrate acid (HNO3), principally produced from
the oxidation of SO2 and nitrogen oxides (NOx),
respec-tively), we used several combinations of initial concentra-tions of SO2, NOx, and ammonia (NH3) for several
combina-tions of initial values of BC mass concentration,T, and RH. Table 1 shows a summary of all the initial parameters used in the MADRID-BC calculations. Note that these initial param-eters cover concentrations of chemical species from polluted urban air (e.g., BC=10.0 µg m−3and SO
2=10.0 parts per
billion by volume (ppbv) at the surface in Beijing; Han et al., 2009; Takegawa et al., 2009) to free tropospheric air (e.g., BC=0.1 µg m−3and SO2=0.1 ppbv in the free troposphere
over the western Pacific; Russo et al., 2003; Oshima et al., 2012). The calculations were conducted using hourly photol-ysis rates for equinox at midlatitudes, although results ob-tained in this study can be applied irrespective of latitude and season (see Sects. 3 and 5). The size distribution of the bare BC particles was represented by a lognormal distribu-tion, which was divided into 40 size sections ranging from 0.0215 µm to 10 µm in MADRID-BC. Mass median diame-ters (Dm) and geometric standard deviations (σ) of the bare BC particles were chosen within ranges of those observed in the atmosphere (Kondo et al., 2006; Moteki et al., 2007; Schwarz et al., 2008a, b); namely combinations ofDm(100, 125, 150, 175, and 200 nm) andσ (1.5 and 1.8) values were used in this study (Fig. 1). An air supersaturation of 0.1 % was chosen for the definition of hydrophobic BC and hy-drophilic BC, because this value is reported as the median value of the measurements under ambient conditions in the literature (Seinfeld and Pandis, 2006), although the ambient supersaturation in clouds varies depending on the cloud dy-namics (e.g., updraft velocities) and on the aerosol micro-physics (e.g., Koike et al., 2012). The dependence of the
2500
2000
1500
1000
500
0
dM
/d
lo
g
D
(
n
g
m
-3 )
101
2 3 45 6 7 102
2 3 4 5 6 7 103
2 3 4 5 6 7 104 Particle Diameter, D (nm)
Dm = 100 nm, = 1.5 Dm = 100 nm, = 1.8 Dm = 125 nm, = 1.5 Dm = 125 nm, = 1.8 Dm = 150 nm, = 1.5 Dm = 150 nm, = 1.8 Dm = 175 nm, = 1.5 Dm = 175 nm, = 1.8 Dm = 200 nm, = 1.5 Dm = 200 nm, = 1.8
Fig. 1.
Fig. 1. Mass size distributions of bare BC particles used in this
study. Black, purple, green, blue, and red denote mass median diam-eters (Dm) of 100, 125, 150, 175, and 200 nm, respectively. Solid
and dashed lines denote geometric standard deviations (σ) of 1.5 and 1.8, respectively. The size distributions are shown for a mass concentration of BC particles of 1.0 µg m−3as an example.
conversion rate on the definitions of hydrophobic BC and hy-drophilic BC is presented in Appendix B.
3 Parameterization of BC aging due to condensation
3.1 Hydrophobic-BC-mass-normalized coating rate (VBC)
In this study we introduce a new concept, the hydrophobic-BC-mass-normalized coating rate,VBC(h−1), defined as
fol-lows:
VBC= 1 [BCphob]
1[Mcond.BCphob]
1t , (6)
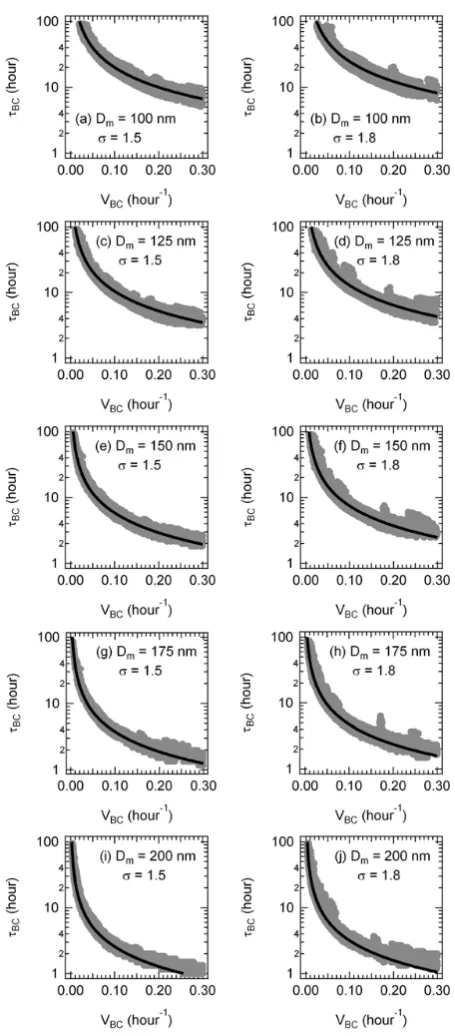
where 1[Mcond.BCphob]/1t is the increase rate of the total mass concentration of condensed materials onto initially hy-drophobic BC particles for each hour of calculation. Al-though the τBC value largely varies depending on the at-mospheric conditions and the concentrations of chemical species, we find that the variation ofτBC is generally cap-tured well by a unique function ofVBCfor a given lognormal size distribution of BC particles. Figure 2 shows the varia-tion ofτBCas a function ofVBC for all combinations of the initial parameters shown in Table 1 for each given lognormal BC size distribution (Dmandσ )shown in Fig. 1. Note that
each data point (i.e., each gray circle) shown in Fig. 2 corre-sponds to a result from the calculation for each initial condi-tion. For example, Fig. 2g shows the results for a lognormal BC size distribution with aDmof 175 nm andσof 1.5, which
is almost identical to that observed in outflow from anthro-pogenic sources in Japan (Moteki et al., 2007; Oshima et al., 2009a). Fitting the results shown in Fig. 2g, we obtain the following relationship betweenτBCandVBC(black curve):
τBC= a VBC
, (7)
where a= 0.3746±0.0004. This relationship is intuitive; namely, when a large amount of condensable materials is produced for a certain amount of hydrophobic BC particles, the BC particles are quickly coated with condensed species (i.e., greaterVBC), and the time required for the conversion
from hydrophobic BC to hydrophilic BC becomes shorter (i.e., smallerτBC). It is noted thatVBC is expressed by the total mass concentration of hydrophobic BC and that of con-densed amounts on the BC particles, although theτBCvalues shown in Fig. 2g are derived from the calculations of growth rates of coating amounts on the BC particles for each size bin.
The relationship betweenτBCandVBCin Eq. (7) indicates that when the total condensed amount on hydrophobic BC particles is given for a given size distribution of BC parti-cles,τBC can be uniquely derived as long as the given BC
size distribution is the same. Although variations ofτBCcan
primarily be represented by VBC,τBC can also change
de-pending on various factors, such as the chemical composi-tion of coating materials. The spread inτBC for individual VBCvalues, shown in Fig. 2g, reflects the differences in the
Fig. 2.
Fig. 2. Relationships betweenτBC(e-folding time of the conversion
from hydrophobic BC to hydrophilic BC) andVBC
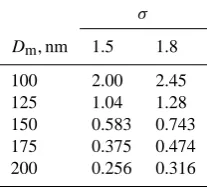
Table 2. Summary of theA(Dm,σ) values shown in Eq. (8) for
combinations of theDmandσvalues of hydrophobic BC particles.∗
σ
Dm, nm 1.5 1.8
100 2.00 2.45
125 1.04 1.28
150 0.583 0.743
175 0.375 0.474
200 0.256 0.316
∗D
mis the mass median diameter andσis the geometric standard deviation of a lognormal size distribution of hydrophobic BC particles.
chemical compositions of coating materials through changes in the atmospheric conditions, which affect the critical su-persaturation of particles through the solute effect in K¨ohler theory.
3.2 Dependence on size distribution of BC
Oshima et al. (2009b) showed that the time evolution of the mass fraction of hydrophilic BC particles with respect to total BC particles due to aging processes depends on the size dis-tribution of initially hydrophobic BC particles. In this section we describe the dependence ofτBCon the shape of the
log-normal BC size distribution for ranges ofDmof 100–200 nm andσ of 1.5–1.8 (Fig. 1). We estimatedτBC for these log-normal BC size distributions using the same procedure de-scribed in the previous sections. Using the same approach for the Fig. 2g case (Sect. 3.1), we obtain the following rela-tionship betweenτBC andVBC for any given lognormal BC size distribution (black curves in Fig. 2):
τBC=A(Dm, σ ) VBC
, (8)
whereA(Dm,σ) is a constant value representing the
depen-dence on the lognormal BC size distribution. The values of
A(Dm,σ) forDmof 100–200 nm andσ of 1.5–1.8 are sum-marized in Table 2.
According to Eq. (8) and Table 2, the lognormal BC size distribution with the smallerA(Dm, σ) value has the smaller conversion time from hydrophobic BC to hydrophilic BC (i.e., faster BC aging). TheA(Dm, σ) value decreases with the increase in Dm when the A(Dm, σ) values with the sameσ are compared (Table 2), because the greaterDm
shifts the entire BC size distribution to the larger diameter range (see Fig. 1), and dry particles with larger diameters generally tend to become CCN active according to K¨ohler theory (i.e., the maximum of the equilibrium saturation ratio is smaller for the larger particles, and hence they can activate at lower environmental supersaturations). When theA(Dm, σ) values with the sameDmvalues are compared, theA(Dm,
1.8) values are greater than theA(Dm, 1.5) values (Table 2). BecauseτBCis defined as the time required for the hydropho-bic BC mass concentration to decay to 1/eof its initial value in our calculations and BC-containing particles with greater diameters generally preferentially become CCN active, the particles greater than the minimum CCN particle diameter (Dmin) become CCN active at τBC for a given
supersatura-tion due to BC aging. The minimum CCN particle diameter is roughly located where the integral of the size distribution from 0 to Dmin equals 1/eof that of the entire size range.
Note thatDminis located over the left-hand side of the log-normal size distribution (i.e., range with diameters smaller thanDm). The greaterσ value generally distributes BC par-ticles over a wider size range (see Fig. 1) and shifts Dmin
to smaller diameters (i.e., increase in the number of smaller size BC particles over the left-hand side of the lognormal dis-tribution), and therefore the greaterσ case needs longerτBC
for activation of all particles greater thanDminfor a given su-persaturation, at least within a range ofDmof 100–200 nm.
Large variations in theA(Dm,σ )values, shown in Table 2,
indicate the importance of the size distribution of BC for the BC aging rate.
3.3 Formula for the parameterization
The formula for the parameterized conversion rate from hy-drophobic BC to hydrophilic BC due to condensation is rep-resented as follows:
1
τBC
= VBC A(Dm, σ )
, (9)
where VBC (h−1)is the hydrophobic-BC-mass-normalized
coating rate (given by Eq. 6) and A(Dm,σ) is a constant value representing the dependence on the lognormal BC size distribution (shown in Table 2). Note that although the
A(Dm,σ) values in Eq. (9) depend on theDmandσvalues of
the size distribution of BC, our parameterization can be used for models that do not explicitly calculate size distributions of aerosols. TheDmandσ values can be chosen arbitrarily
on the basis of the size distributions of BC that one wants to assume in models. Because the conversion rate in Eq. (9) is expressed as a function of VBC, which depends on the condensed amount onto the hydrophobic BC particles, the newly developed parameterization can represent large varia-tions of the BC aging rate. Therefore, our parameterization of the conversion rate is a more accurate representation than the constant conversion rates widely used in previous stud-ies. Our parameterization is simple and computationally effi-cient, allowing its application in GCMs.
a range ofDmof 100–200 nm. Note that our parameteriza-tion is not applicable to coarse (e.g., dust) particles. In ad-dition, even though our parameterization is derived based on condensation of inorganic species, the relationship in Eq. (9) is applicable to particles including SOAs if values of hygro-scopic parameters (κ) (e.g., Petters and Kreidenweis, 2007) for water-soluble organic and inorganic species are simi-lar (i.e., the CCN activities of those particles are simisimi-lar). Our parameterization is also applicable to models that have several aerosol modes other than hydrophobic BC and hy-drophilic BC modes, because the conversion rate is derived according to the condensed amounts onto the hydrophobic BC mode. The presence of other aerosol modes changes the condensed amounts onto the hydrophobic BC mode (i.e.,
VBC)but does not affect the formula in Eq. (9) (see Sect. 4). It is also noted that although we conducted the MADRID-BC calculations for one hour for each initial condition (Sect. 2), additional MADRID-BC calculations with different time du-rations (e.g., one minute) give the same relationship shown in Eq. (9), supporting the validity of Eq. (9) for use in GCMs with any time steps.
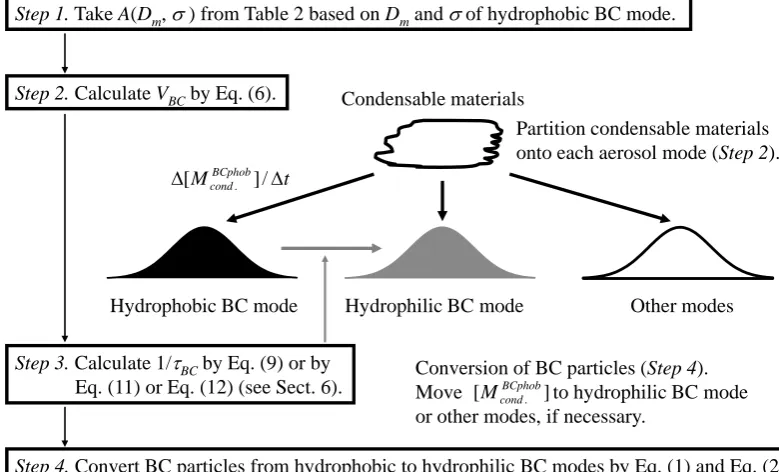
4 Application of parameterization to GCMs
In this section, we describe an application method of our pa-rameterization to GCMs, as illustrated in Fig. 3. Our param-eterization is applicable to models that do not explicitly treat aerosol microphysics (i.e., do not need explicit calculations of size distributions of aerosols), but it requires the separate treatment of hydrophobic BC and hydrophilic BC modes and the calculations of condensation of bulk amounts of aerosols (at least sulfate aerosols) in models.
Step 1. TheA(Dm,σ) value is taken from Table 2, based
on the size distribution of the hydrophobic BC mode that the user wants to assume in the GCM.
Step 2. To derive the VBC value by Eq. (6) at each time step in the GCM, the user needs to derive condensed amounts distributed over the hydrophobic BC mode (i.e.,
1[Mcond.BCphob]/1t ). If the model explicitly calculates the con-densed amounts onto the hydrophobic BC mode, the user can directly derive1[Mcond.BCphob]/1t. If the model does not calcu-late the condensed amounts, the user may use the following weighting factors,Wi, for each aerosol modei(Pandis et al., 1993; Capaldo et al., 2000):
Wi= NiDp,i 2λm
αiDp,i+1
, (10)
whereNi is the number concentration of particles in modei, Dp,iis the mode diameter of the particles in modei,λmis
the air mean free path, andαi is the accommodation coeffi-cient in modeion the atmospheric aerosol. These weighting factors are normalized and then used to partition condensable materials, which are produced at each time step, among the aerosol modes, and thus1[Mcond.BCphob]/1t is derived.
Step 3. The conversion rate, 1/τBC, is calculated using Eq. (9) at each time step in the GCM. Alternatively, the user can choose other representations of our parameteriza-tions that include the coagulation effects on BC aging (see Sect. 6).
Step 4. Finally, a portion of the BC particles in the
hy-drophobic BC mode is converted to the hydrophilic BC mode using Eqs. (1) and (2). Note that the derived condensed amounts onto the hydrophobic BC mode (i.e.,[Mcond.BCphob])
have to move to the hydrophilic BC mode (or other internally mixed modes) together with the conversion of the hydropho-bic BC particles, because the array of the hydrophohydropho-bic BC mode may not be allowed to have the condensed amounts (i.e., coatings) in the model.
It is noted that models using the bulk methods generally assume external mixtures for aerosol representations, and therefore they may not treat the internally mixed hydrophilic BC (e.g., BC/sulfate mixture) mode. The difference in the representations of the mixing state of BC in models can sig-nificantly impact estimates of aerosol radiative forcing (e.g., Jacobson, 2001a). Because our parameterization can derive the condensed amount onto the hydrophobic BC mode (i.e.,
[Mcond.BCphob])from the bulk amounts of aerosols together with the conversion rate (see Steps 2 and 4), the use of our pa-rameterization enables representation of the internally mixed hydrophilic BC mode in models that treat aerosols with the bulk method (e.g., Goto et al., 2012).
Condensable materials
Conversion of BC particles (Step 4). Move to hydrophilic BC mode or other modes, if necessary.
Step 1.Take A(Dm, ) from Table 2 based on Dmand of hydrophobic BC mode.
Step 2.Calculate VBCby Eq. (6).
Hydrophobic BC mode Hydrophilic BC mode Other modes
Step 3.Calculate 1/BCby Eq. (9) or by Eq. (11) or Eq. (12) (see Sect. 6).
Step 4.Convert BC particles from hydrophobic to hydrophilic BC modes by Eq. (1) and Eq. (2). Partition condensable materials onto each aerosol mode (Step 2).
t MBCphob
cond
[ . ]/
]
[ .
BCphob cond
M
Fig. 3.
Fig. 3. Schematic diagram of an application method of the parameterization developed in this study to GCMs.
rates of the condensed materials, such as SOAs, in models can lead to errors in the estimation of the conversion rates.
5 Variations ofτBCandVBC
Our parameterization can represent diurnal and seasonal variations of the BC aging rate (i.e., conversion rate, 1/τBC)
and its spatial variations through changes in the VBC
val-ues. Some examples of these variations ofτBCand the
corre-spondingVBC values for several initial conditions shown in
Table 1 are presented for the lognormal BC size distribution with aDmof 175 nm andσ of 1.5 in this section.
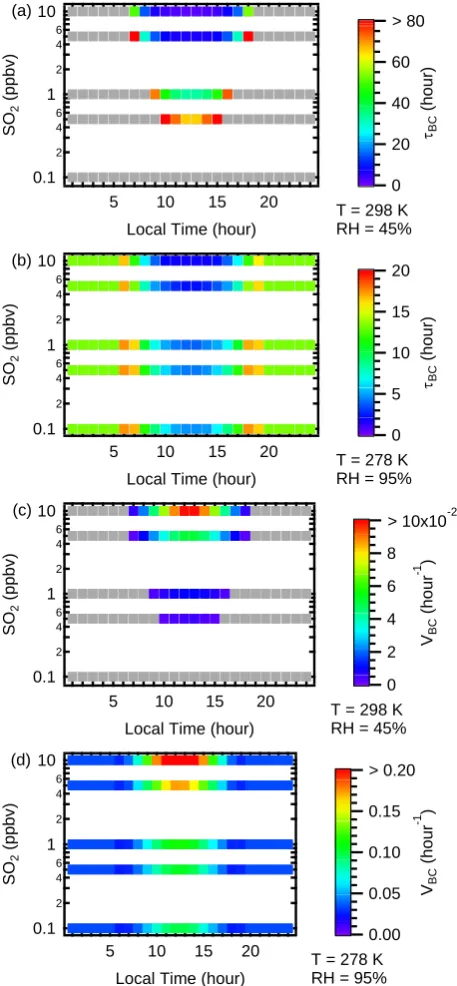
Figures 4a and b show temporal variations ofτBC as a
function of the initial SO2concentration for given initial BC,
NOx, and NH3concentrations for aT of 298 K and RH of
45 % and those of 278 K and 95 %, respectively. A detailed description of the initial conditions of the chemical species is given in the figure caption. Figures 4c and d show the cor-respondingVBCvalues for eachτBCvalue shown in Figs. 4a and b, respectively. Note that each τBC value (i.e., colored squares shown in Fig. 4) corresponds to the results of calcu-lations for each initial condition. For the highT and low RH condition (Fig. 4a), BC aging is fast during daytime, with a minimum value ofτBCat noontime (e.g.,τBCis 6.5 h for SO2
of 5.0 ppbv at noontime) due to condensation of H2SO4,
pro-duced from the oxidation of SO2 by OH radical; however,
there is no BC aging during nighttime. This result indicates thatτBCclearly has temporal variations and dependencies on
the production of H2SO4directly and OH radical indirectly,
as presented by previous studies (e.g., Koch, 2001; Wilson et al., 2001; Riemer et al., 2004; Liu et al., 2011). On the other hand, for the lowT and high RH condition (Fig. 4b), BC aging is systematically faster (e.g.,τBCis 2.5 h for SO2
of 5.0 ppbv at noontime) than the highT and low RH con-dition (Fig. 4a) during daytime due to condensation of both H2SO4and HNO3, produced from the oxidation of nitrogen
dioxide (NO2)by OH radical, and there is relatively slow
BC aging during nighttime (e.g.,τBC is about 13 h for any
SO2concentration) due to condensation of HNO3, produced
from the heterogeneous hydrolysis of dinitrogen pentoxide (N2O5), which occurs in aerosol particles. This result
indi-cates that the atmospheric conditions, such asT and RH, are important forτBCby changing the chemical compositions of condensed materials on BC particles.
In order to examine the dependence ofτBCon RH in detail, variations ofτBCas functions of both the initial SO2
concen-tration and RH for the given initial BC, NOx, and NH3
con-centrations atT of 278 K at noontime and correspondingVBC
are shown in Figs. 5a and b, respectively. Figures 5c and d show mass fractions of SO24−and NO−3 in condensed materi-als (i.e., coatings) on BC particles, respectively, for eachτBC
calculation shown in Fig. 5a. When the lower RH (<60 %) and the higher RH (>60 %) conditions are compared,τBCin
the lower RH condition is greater for any given initial SO2
concentration (Fig. 5a), and the dominant condensed mate-rial of BC particles is found to be SO24−(about 70 % mass fraction, shown in Fig. 5c). For the higher RH condition,τBC
0.1 2 4 6 1 2 4 6 10 SO 2 (ppbv) 20 15 10 5
Local Time (hour)
80 60 40 20 0 BC (hour) > 80 (a)
T = 298 K RH = 45%
0.1 2 4 6 1 2 4 6 10 SO 2 (ppbv) 20 15 10 5
Local Time (hour)
20 15 10 5 0 BC (hour) (b)
T = 278 K RH = 95%
0.1 2 4 6 1 2 4 6 10 SO 2 (ppbv) 20 15 10 5
Local Time (hour)
10 8 6 4 2 0 VBC (hou r -1 )
> 10x10-2 (c)
T = 298 K RH = 45%
0.1 2 4 6 1 2 4 6 10 SO 2 (ppbv) 20 15 10 5
Local Time (hour)
0.20 0.15 0.10 0.05 0.00 VBC (hou r -1 ) (d) > 0.20
T = 278 K RH = 95%
Fig. 4. Fig. 4. Temporal variations of (a)forT of 298 K and RH of 45 % and (b)τBCand (c) correspondingτBCand (d) correspond-VBC
ingVBCforT of 278 K and RH of 95 % as a function of the
ini-tial SO2concentration for a given initial BC mass concentration of
1.0 µg m−3, NOxmixing ratio of 1.0 ppbv, and NH3mixing ratio
of 1.0 ppbv for the lognormal BC size distribution with aDm of
175 nm andσ of 1.5. Note thatτBCvalues greater than 120 h are
indicated in gray.
1.0 0.8 0.6 0.4 0.2 RH
0.1 2 4 6 81 2 4 6 810 SO2 (ppbv)
50 40 30 20 10 0 BC (hour) > 50 (a) 1.0 0.8 0.6 0.4 0.2 RH 0.1
2 4 6 8
1
2 4 6 8
10 SO2 (ppbv)
10 8 6 4 2 0 VBC (hou r -1 )
> 10x10-2 (b) 1.0 0.8 0.6 0.4 0.2 RH 0.1
2 4 6 8
1
2 4 6 8
10 SO2 (ppbv)
1.0 0.8 0.6 0.4 0.2 0.0 Ma s s Fra c ti on of S O4 2-(c) 1.0 0.8 0.6 0.4 0.2 RH 0.1
2 4 6 8
1
2 4 6 8
10 SO2 (ppbv)
1.0 0.8 0.6 0.4 0.2 0.0 M a ss F ractio n of N O3 -(d)
Fig. 5. Fig. 5. Variations of (a)of both the initial SO τBCand (b) correspondingVBCas functions
2concentration and RH for a given initial BC
mass concentration of 1.0 µg m−3, NOxmixing ratio of 1.0 ppbv,
and NH3mixing ratio of 1.0 ppbv for a lognormal BC size
distribu-tion with aDmof 175 nm andσof 1.5 atT of 278 K at noontime.
0.1
2 4
1
2 4
10
BC
(
g m
-3 )
0.1 2 4 6 81 2 4 6 810 SO2 (ppbv)
80
60
40
20
0 BC
(hour)
> 80 (a)
T = 298 K RH = 45%
0.1
2 4
1
2 4
10
BC
(
g m
-3 )
0.1
2 4 6 8
1
2 4 6 8
10 SO2 (ppbv)
10
8
6
4
2
0
VBC
(hou
r
-1 )
> 10x10-2 (b)
T = 298 K RH = 45%
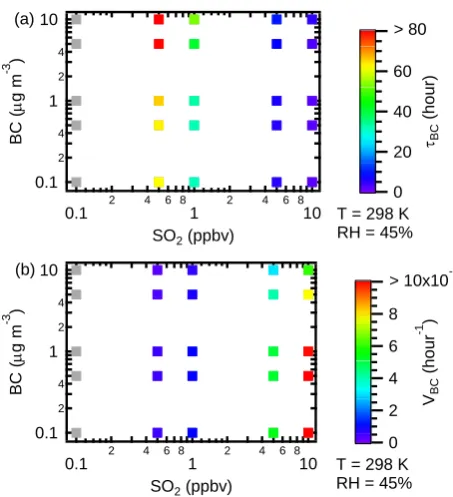
Fig. 6. Fig. 6. Variations of (a)of both the initial SO τBCand (b) correspondingVBCas functions
2concentration and BC mass concentration for
a given initial NOxmixing ratio of 1.0 ppbv and NH3mixing ratio
of 1.0 ppbv for the lognormal BC size distribution with aDm of
175 nm andσ of 1.5 forT of 298 K and RH of 45 % at noontime. Note thatτBCvalues greater than 120 h are indicated in gray.
in condensed materials generally increases with the increase in RH in addition to SO24− amount (e.g., the mass fraction of NO−3 in condensed materials is about 40–50 % for SO2of
1.0 ppbv at RH of 75–95 %, shown in Fig. 5d). This result suggests the importance of nitrate aerosols for the aging and the CCN activity of BC particles especially in uplifting air parcels over anthropogenic source regions, because the up-ward transport of the air parcels is generally associated with high RH conditions.
Figures 6a and b show variations ofτBCand corresponding VBC, respectively, as functions of both the initial SO2
con-centration and BC mass concon-centration for given initial NOx
and NH3concentrations forT of 298 K and RH of 45 % at
noontime.τBCdepends on the ratio of the SO2and BC
val-ues, indicating that spatial distributions of emission ratios of precursors of condensable materials to BC (e.g., SO2/BC
ra-tio) play important roles for the BC aging rate.
It is noted that the inverse relationship betweenVBC and τBC, presented in Sect. 3, can also be seen in Figs. 4, 5,
and 6. For example, as shown in Fig. 6,τBC decreases and VBCincreases with the increase in the initial SO2
concentra-tion for any given initial BC mass concentraconcentra-tions, because the greater initial concentration of precursors (i.e., SO2)
pro-duces greater condensable materials (i.e., H2SO4) onto the
given hydrophobic BC particles (i.e., greaterVBC), resulting
in a smaller conversion time from hydrophobic BC to hy-drophilic BC (i.e., smallerτBC). It is also noted thatVBCcan represent several dependencies of τBC on the atmospheric conditions and the concentrations of chemical species, as shown in Figs. 4, 5, and 6, through changes in the condensed amounts onto hydrophobic BC. The use ofVBC enables the
representation of the temporal and the spatial variations of the BC aging rate in our parameterization.
6 Parameterization of BC aging including coagulation effects
The parameterization of BC aging shown in Eq. (9) only in-cludes condensation effects and does not take in to account coagulation. In this section, we provide two representations of a parameterization including both condensation and co-agulation effects (i.e., Eqs. 11 and 12), on the basis of the estimates of the time scale of BC aging due to coagulation described in Appendix A. The first representation of the pa-rameterization, which uses a constant conversion rate due to coagulation, is expressed as
1
τBC
= VBC A(Dm, σ )
+ δ, (11)
where the first term on the right-hand side is the conden-sation term (i.e., same as the right-hand side of Eq. 9) and
δ is the coagulation term with a constant conversion rate. One may use a conversion time of 20 days forδ to repre-sent the slow aging outside BC source regions. In this case, it is recommended to make a suitable assumption regarding the mixing state of BC upon emission; namely some fraction of BC is emitted as hydrophilic BC (e.g., 80 % hydrophobic and 20 % hydrophilic) to represent the fast aging over the BC source regions. Because the BC aging due to coagula-tion proceeds efficiently over the source regions, the coagu-lation effect can be treated implicitly in the emission process (see Appendix A). These values (i.e., hydrophilic fraction of 20 % and a conversion time of 20 days) are considered to be more or less reasonable to represent coagulation effects over the source regions and outside those regions, as described in Appendix A.
An alternative representation of the parameterization ex-presses the coagulation effects as a function of the mass con-centration of soluble aerosols as follows:
1
τBC = VBC A(Dm, σ ) +
X j
kcoag.,j[Mj], (12)
where the first term on the right-hand side is the conden-sation term (i.e., Eq. 9) and the second term represents the coagulation effects between hydrophobic BC and soluble aerosol mode j (see Eq. A3 in Appendix A). The kcoag.,j
size distributions (Dmandσ) of hydrophobic BC and solu-ble aerosol modej, and [Mj] is the mass concentration of the soluble aerosol modej. Table 3 summarizes thekcoag.,j
values for several combinations of theDmandσ values of
hydrophobic BC and the soluble aerosol modej. The sum-mation is over all coagulation effects between hydrophobic BC and several soluble aerosol modes (e.g., several soluble BC-free and hydrophilic BC modes). Note that although the
kcoag.,jvalue depends on the size distributions (Dmandσ) of
hydrophobic BC and the soluble aerosol modej, one need not explicitly calculate the size distributions of aerosols in models and can arbitrarily chooseDmandσ values from Ta-ble 3.
It is noted that we focus on condensation and treat coag-ulation effects additionally in this study, because the repre-sentations of the condensation effects are more accurate than those of coagulation in our parameterization. The condensa-tion effects in our parameterizacondensa-tion (e.g., Eq. 9) are derived using the results of detailed calculations by the MADRID-BC model. On the other hand, the coagulation effects (e.g., the second term on the right-hand side of Eq. 12) are simply estimated from the instantaneous coagulation rates between hydrophobic BC and soluble aerosols (see Appendix A), be-cause the coagulation process is highly non-linear so that the time scales estimated from detailed box model calculations for a specific time interval may not be the same as those for other time intervals. Nevertheless, Eqs. (11) or (12) is sidered to be a more accurate representation than the con-stant conversion rates widely used in previous studies. The parameterized conversion rates shown in Eqs. (11) and (12) are still simple and computationally efficient, allowing their application in GCMs by replacing Eq. (9) with Eq. (11) or Eq. (12) in Step 3 in Sect. 4.
Our newly developed parameterization (i.e., Eq. 11) has been implemented into a global three-dimensional aerosol transport-radiation model, SPRINTARS (Takemura et al., 2005; Goto et al., 2011a, b) driven by a GCM. The useful-ness of our parameterization and impacts of BC aging pro-cesses on the spatial distribution of BC and aerosol radiative forcing using the SPRINTARS model is presented in a sub-sequent paper (Goto et al., 2012).
7 Summary and conclusions
This study develops a new parameterization of the BC ag-ing process for use in GCMs that separately treat hydropho-bic BC and hydrophilic BC modes using the bulk method, in which only mass concentrations of aerosols are predicted and their size distributions are not explicitly treated. The rate of BC aging is expressed by the conversion rate of BC particles from hydrophobic BC to hydrophilic BC modes (i.e., 1/τBC).
We estimate theτBCvalues due to condensation using results
from the MADRID-BC model calculations for several com-binations of initial concentrations of chemical species and
atmospheric conditions (see Table 1) for several given log-normal size distributions of BC particles (see Fig. 1). In spite of the large variations in the τBC values depending on the atmospheric conditions and the concentrations of chemical species, we find that the variation ofτBC is generally
cap-tured well by a unique function ofVBC(the
hydrophobic-BC-mass-normalized coating rate, defined by Eq. 6) for any given lognormal size distributions of BC particles forDmof 100–
200 nm andσ of 1.5–1.8 (Fig. 1). The parameterized con-version rate from hydrophobic BC to hydrophilic BC modes due to condensation is expressed as a function ofVBCwith a constant valueA(Dm,σ) representing the dependence on the lognormal BC size distribution (listed in Table 2) and is pre-sented in Eq. (9). Alternative representations of the parame-terized conversion rates of BC aging additionally including the coagulation effects are also presented in Eqs. (11) and (12). Our newly developed parameterization can represent diurnal (e.g., faster and slower BC aging during daytime and nighttime, respectively) and seasonal (e.g., faster and slower aging in summer and winter, respectively) variations of the BC aging rate and its spatial variations (e.g., over source and remote regions) due to changes in the emission ratios of pre-cursors of condensable materials to BC (e.g., SO2/BC and
NOx/BC ratios), whereas other widely used constant
conver-sion rates cannot. Use of our parameterization will provide more reliable estimates of the spatial distribution of BC and its radiative effects in GCMs.
Appendix A
Estimates of the time scale of BC aging due to coagulation
The time scale of BC aging due to coagulation is estimated in this appendix. The instantaneous coagulation rate (Ji,j)
be-tween bare (hydrophobic) BC in size biniand soluble BC-free particles in size binj can be expressed using the Fuchs form of the Brownian coagulation coefficient (Ki,j)
(Sein-feld and Pandis, 2006):
Ji,j=Ki,jNBCphob,iNBCfree,j, (A1)
where NBCphob,i and NBCfree,j are number concentrations of hydrophobic BC in size biniand soluble BC-free parti-cles in size binj, respectively. The size distributions of the hydrophobic BC and soluble BC-free particles were repre-sented by lognormal distributions, which were divided into 40 size sections ranging from 0.0215 µm to 10 µm. The in-stantaneous coagulation rates were calculated for various combinations of the size distributions (mass median diameter
Dmand geometric standard deviationσ) of the hydrophobic
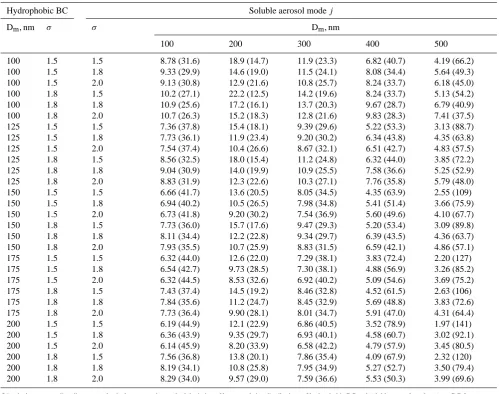
Table 3. Summary of thekcoag.,jvalues for several combinations of theDmandσ values of hydrophobic BC and soluble aerosol modej
and the corresponding conversion time of BC aging due to coagulation over the source regions as examples.∗
Hydrophobic BC Soluble aerosol modej
Dm, nm σ σ Dm, nm
100 200 300 400 500
100 1.5 1.5 8.78 (31.6) 18.9 (14.7) 11.9 (23.3) 6.82 (40.7) 4.19 (66.2)
100 1.5 1.8 9.33 (29.9) 14.6 (19.0) 11.5 (24.1) 8.08 (34.4) 5.64 (49.3)
100 1.5 2.0 9.13 (30.8) 12.9 (21.6) 10.8 (25.7) 8.24 (33.7) 6.18 (45.0)
100 1.8 1.5 10.2 (27.1) 22.2 (12.5) 14.2 (19.6) 8.24 (33.7) 5.13 (54.2)
100 1.8 1.8 10.9 (25.6) 17.2 (16.1) 13.7 (20.3) 9.67 (28.7) 6.79 (40.9)
100 1.8 2.0 10.7 (26.3) 15.2 (18.3) 12.8 (21.6) 9.83 (28.3) 7.41 (37.5)
125 1.5 1.5 7.36 (37.8) 15.4 (18.1) 9.39 (29.6) 5.22 (53.3) 3.13 (88.7)
125 1.5 1.8 7.73 (36.1) 11.9 (23.4) 9.20 (30.2) 6.34 (43.8) 4.35 (63.8)
125 1.5 2.0 7.54 (37.4) 10.4 (26.6) 8.67 (32.1) 6.51 (42.7) 4.83 (57.5)
125 1.8 1.5 8.56 (32.5) 18.0 (15.4) 11.2 (24.8) 6.32 (44.0) 3.85 (72.2)
125 1.8 1.8 9.04 (30.9) 14.0 (19.9) 10.9 (25.5) 7.58 (36.6) 5.25 (52.9)
125 1.8 2.0 8.83 (31.9) 12.3 (22.6) 10.3 (27.1) 7.76 (35.8) 5.79 (48.0)
150 1.5 1.5 6.66 (41.7) 13.6 (20.5) 8.05 (34.5) 4.35 (63.9) 2.55 (109)
150 1.5 1.8 6.94 (40.2) 10.5 (26.5) 7.98 (34.8) 5.41 (51.4) 3.66 (75.9)
150 1.5 2.0 6.73 (41.8) 9.20 (30.2) 7.54 (36.9) 5.60 (49.6) 4.10 (67.7)
150 1.8 1.5 7.73 (36.0) 15.7 (17.6) 9.47 (29.3) 5.20 (53.4) 3.09 (89.8)
150 1.8 1.8 8.11 (34.4) 12.2 (22.8) 9.34 (29.7) 6.39 (43.5) 4.36 (63.7)
150 1.8 2.0 7.93 (35.5) 10.7 (25.9) 8.83 (31.5) 6.59 (42.1) 4.86 (57.1)
175 1.5 1.5 6.32 (44.0) 12.6 (22.0) 7.29 (38.1) 3.83 (72.4) 2.20 (127)
175 1.5 1.8 6.54 (42.7) 9.73 (28.5) 7.30 (38.1) 4.88 (56.9) 3.26 (85.2)
175 1.5 2.0 6.32 (44.5) 8.53 (32.6) 6.92 (40.2) 5.09 (54.6) 3.69 (75.2)
175 1.8 1.5 7.43 (37.4) 14.5 (19.2) 8.46 (32.8) 4.52 (61.5) 2.63 (106)
175 1.8 1.8 7.84 (35.6) 11.2 (24.7) 8.45 (32.9) 5.69 (48.8) 3.83 (72.6)
175 1.8 2.0 7.73 (36.4) 9.90 (28.1) 8.01 (34.7) 5.91 (47.0) 4.31 (64.4)
200 1.5 1.5 6.19 (44.9) 12.1 (22.9) 6.86 (40.5) 3.52 (78.9) 1.97 (141)
200 1.5 1.8 6.36 (43.9) 9.35 (29.7) 6.93 (40.1) 4.58 (60.7) 3.02 (92.1)
200 1.5 2.0 6.14 (45.9) 8.20 (33.9) 6.58 (42.2) 4.79 (57.9) 3.45 (80.5)
200 1.8 1.5 7.56 (36.8) 13.8 (20.1) 7.86 (35.4) 4.09 (67.9) 2.32 (120)
200 1.8 1.8 8.19 (34.1) 10.8 (25.8) 7.95 (34.9) 5.27 (52.7) 3.50 (79.4)
200 1.8 2.0 8.29 (34.0) 9.57 (29.0) 7.59 (36.6) 5.53 (50.3) 3.99 (69.6)
∗D
mis the mass median diameter andσis the geometric standard deviation of lognormal size distributions of hydrophobic BC and soluble aerosol modej(e.g., BC-free particles). Thekcoag.,jvalues (µg−1m3s−1)are×10−8. Values in parentheses are the corresponding conversion times of BC aging due to coagulation (i.e., theτBCcoag.values, in hours) for a mass concentration of soluble aerosol modejof 100 µg m−3(see Appendix A).
Table A1. Summary of parameters used in the estimation of coagulation effects.∗
Species Dm, nm σ Mass concentrations, µg m−3
Hydrophobic BC 100, 125, 150, 175, 200 1.5, 1.8 0.1, 0.5, 1.0, 5.0, 10.0
Soluble BC-free 100, 200, 300, 400, 500 1.5, 1.8, 2.0 0.1, 0.2, 0.5, 1.0, 2.0, 5.0, 10, 20, 50, 100, 200, 500
∗D
mis the mass median diameter andσis the geometric standard deviation of lognormal size distributions of hydrophobic BC and soluble BC-free particles. A total of 9 000 calculations, namely 5 (Dmof BC)×2 (σof BC)×5 (mass of BC)×5 (Dmof BC-free)×3 (σof BC-free)×12 (mass of BC-free), were conducted.
the CCN activity of the produced BC-containing particles (Eq. A1) for the entire size range using the K¨ohler equation (see Sect. 2) and by integrating the total BC mass concen-trations in the hydrophilic state, we calculated the instanta-neous conversion rate of mass concentration of BC from hy-drophobic to hydrophilic states due to coagulation between
the size distributions of hydrophobic BC and soluble BC-free particles (1[BCphob]/1t ). Although the1[BCphob]/1t
value largely varies depending on the mass concentrations of hydrophobic BC ([BCphob]) and soluble BC-free ([BCfree])
particles, the1[BCphob]/1tvalue can be expressed in terms
150
125
100
75
50
25
0
BC
due
t
o
Coagu
lat
ion
(
hou
r)
200 175
150 125
100
Dm of Hydrophobic BC (nm)
500
400
300
200
100
Dm
of Solu
ble
BC-fre
e
(n
m)
BC-free = 100 g m-3 Left: = 1.5 (BC) Right: = 1.8 (BC)
= 1.5 (BC-free) = 1.8 (BC-free) = 2.0 (BC-free)
(a)
2.5x10⁻⁷
2.0
1.5
1.0
0.5
0.0
kcoag
.
(
g
-1 m 3 s -1 )
200 175
150 125
100
Dm of Hydrophobic BC (nm)
500
400
300
200
100
Dm
of Solu
ble
BC-fre
e
(n
m)
Left: = 1.5 (BC) Right: = 1.8 (BC)
= 1.5 (BC-free) = 1.8 (BC-free) = 2.0 (BC-free)
(b)
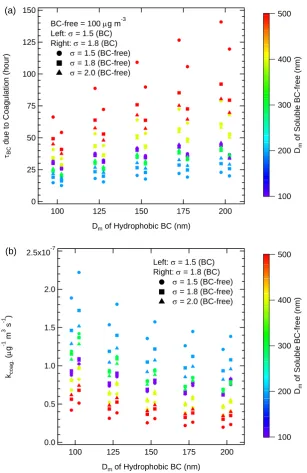
Fig. A1.
Fig. A1. Variations of (a)τBCcoag.and (b) correspondingkcoag.values for the coagulation between all combinations of theDmandσ values
of the size distributions of hydrophobic BC and soluble BC-free particles shown in Table A1. TheτBCcoag. values are shown for a mass concentration of soluble BC-free particles of 100 µg m−3. The left-hand and right-hand sides of eachDmof hydrophobic BC particles
denote the values forσ of hydrophobic BC particles of 1.5 and 1.8, respectively. Circles, squares, and triangles denote the values forσ of soluble BC-free particles of 1.5, 1.8, and 2.0, respectively. Colors indicate the values forDmof soluble BC-free particles.
(µg−1m3s−1), which represents the dependences on the log-normal size distributions (Dmandσ )of the hydrophobic BC
and soluble BC-free particles:
1[BCphob]
1t = −kcoag.[BCfree] [BCphob]. (A2)
It is noted that the coefficient kcoag. includes not only the
coagulation effects (e.g.,Ki,j in Eq. A1) but also the mass
fraction of hydrophilic BC with respect to total BC particles that experiences the coagulation process. Assuming that the [BCfree] value is constant and analytically solving Eq. (A2)
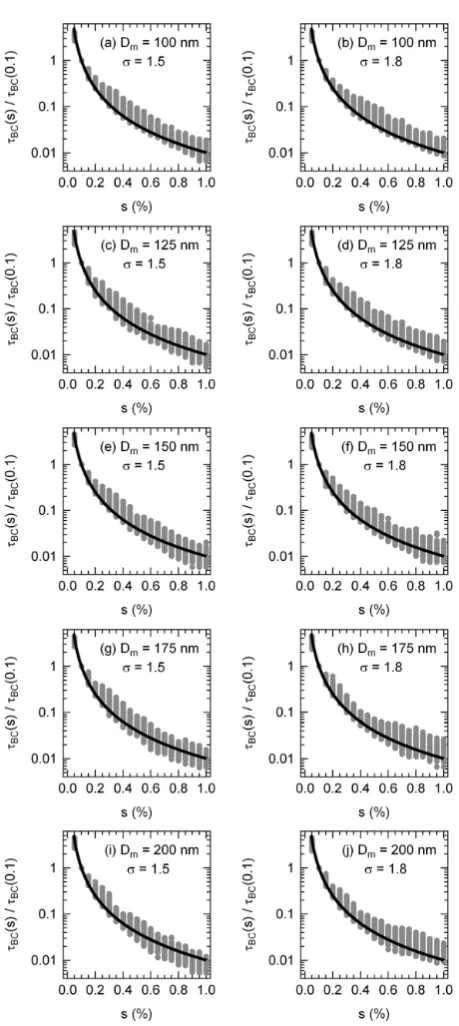
Table A2. Summary of the calculations for estimates of errors included in Eq. (9) due to neglect of coagulation effects on BC aging over the
source and the outflow regions.∗
Concentration of chemical species Size distribution (Dm,σ ) Conversion time scale Reference Calculation name SO2, ppbv BC, µg m−3
BC-free, µg m−3
Hydrophobic BC
Soluble BC-free
τBCcond., hour
τBCcoag., hour
Fcoag., %
Polluted source (Beijing)
10 10 100 (125, 1.5) (300, 2.0) 31.3 32.1 49.4 Takegawa et al. (2009) Matsui et al. (2009) Kondo et al. (2006) Source
(Beijing)
10 5.0 30 (125, 1.5) (300, 2.0) 13.8 107 11.4
Polluted outflow (western Pacific)
1.0 1.0 10 (175, 1.5) (300, 2.0) 25.2 402 5.90 Moteki et al. (2007) Oshima et al. (2009a) Whitby (1978) Outflow
(western Pacific)
0.5 0.5 5.0 (175, 1.5) (300, 2.0) 20.1 803 2.44
∗D
mis the mass median diameter andσis the geometric standard deviation of lognormal size distributions of hydrophobic BC and soluble BC-free particles. The τBCcond.andτBCcoag.values are the conversion time scales from hydrophobic BC to hydrophilic BC due to condensation and coagulation, respectively, and these values are estimated by the MADRID-BC model calculations and from Eq. (A3), respectively.Fcoag.is the contribution of the coagulation effects to the overall conversion rate of BC aging. Values of the concentrations of chemical species and the size distributions are taken from the corresponding observations (see references in this table).
τBCcoag.= 1 kcoag.[BCfree]
, (A3)
whereτBCcoag.is the characteristic (e-folding) time of the con-version due to the coagulation between the size distributions of hydrophobic BC and soluble BC-free particles. Table 3 summarizes thekcoag. values (thekcoag.,j values in Table 3) for all combinations of theDm andσ values of hydropho-bic BC and soluble BC-free particles (soluble aerosol mode
j in Table 3) shown in Table A1. Equation (A3) indicates thatτBCcoag.can be estimated from the mass concentration of soluble BC-free particles ([BCfree]) using the pre-determined
constant coefficient (kcoag.) for the given lognormal size
dis-tributions (Dmandσ) of hydrophobic BC and soluble
BC-free particles.
Using Eq. (A3), we estimated the time scales of BC ag-ing due to coagulation (i.e., τBCcoag.) for polluted source re-gions and outside those rere-gions. According to Seinfeld and Pandis (2006), typical values of mass concentrations of fine aerosol particles for polluted urban air are 30–150 µ g m−3. The Campaigns of Air Quality Research in Beijing and Sur-rounding Region 2006 (CAREBeijing 2006) also showed that the observed mass concentrations of fine aerosol par-ticles were about 30–100 µg m−3 on average in the Beijing region (Matsui et al., 2009). Although these mass concen-trations included both BC-containing and BC-free particles, we applied these bulk values to mass concentrations of solu-ble BC-free particles in our estimates. The variations of the
τBCcoag.values for coagulation between all combinations of the size distributions (i.e.,Dm andσ) of hydrophobic BC and
soluble BC-free particles (shown in Table A1) are shown for a [BCfree] of 100 µg m−3in Fig. A1a and Table 3. The
cor-respondingkcoag. values are also shown in Fig. A1b and
Ta-ble 3. As shown in Fig. A1a, theτBCcoag. value largely varies
especially depending on theDmof soluble BC-free and hy-drophobic BC particles. Previous studies showed that a size distribution of BC particles withDm=125 andσ =1.5 was often observed over the urban region in Tokyo (Kondo et al., 2006). For fine aerosol size distributions, values ofDm=300
andσ =2.0 were reported by Whitby (1978) based on near-source observations (Binkowski and Roselle, 2003). Using these values, theτBCcoag. values are estimated to be 21–107 h for urban polluted air conditions (i.e., [BCfree] range of 30–
150 µg m−3). For the air outside polluted source regions, as-suming a typical mass concentration of fine aerosol parti-cles of 5–10 µg m−3, the τBCcoag. values are estimated to be 17–33 days for a size distribution of hydrophobic BC with
Dm=175 andσ=1.5 (Moteki et al., 2007; Oshima et al., 2009a) and soluble BC-free particles with Dm=300 and
σ=2.0 (Whitby, 1978).
We estimated the error included in Eq. (9) due to neglect of coagulation effects on BC aging. For this purpose, we calculated the conversion time from hydrophobic BC to hy-drophilic BC due to condensation (τBCcond.) by the MADRID-BC model using the same methods described in Sect. 2 for the source (Beijing) and outflow (western Pacific) regions. Table A2 shows a summary of the parameters used in the MADRID-BC calculations. The concentrations shown in Ta-ble A2 over the source and the outflow regions are taken from the CAREBeijing campaign conducted in the Beijing region and the Pacific Exploration of Asian Continental Emission phase C (PEACE-C) aircraft campaign conducted over the western Pacific around Japan, respectively. Using these val-ues, we calculated the diurnal variations ofτBCcond.for the high
T and low RH (i.e.,T =298 K and RH=45 %) and the low
T and high RH (i.e.,T =278 K and RH=95 %) conditions for each case. By simply averaging the 1/τBCcond. values for both conditions, the diurnally averagedτBCcond.values were es-timated for each case (Table A2). Comparing theτBCcond. val-ues with the correspondingτBCcoag.values for each case (esti-mated from Eq. A3 and shown in Table A2), we esti(esti-mated contributions of the coagulation effects to the overall conver-sion rate of BC aging (see Fcoag. in Table A2). The result
shown in Table A2 indicates that the conversion rates shown in Eq. (9) can give smaller values by 11–49 % and 2.4–5.9 % over the source and outflow regions, respectively, due to ne-glect of the coagulation effects. This estimate suggests that the use of Eq. (9) can include approximately 50 % and 10 % errors over the polluted source regions and outside those re-gions, respectively. Note that the large difference in the error values estimated for the polluted source regions and outside those regions also gives confidence in the validity of our ap-proach to separately treat the coagulation effects on BC aging in Eq. (11) for those two regions.
Appendix B
Dependence on definitions of hydrophobic BC and hydrophilic BC
In this study, an air supersaturation of 0.1 % is used for def-initions of hydrophobic BC and hydrophilic BC by calculat-ing the CCN activity of particles uscalculat-ing the K¨ohler equation (Sect. 2). Most GCMs generally define hydrophilic BC as particles experiencing water uptake and wet deposition pro-cesses in the model and hydrophobic BC as particles not experiencing these processes. For GCMs that treat aerosols with the bulk method, this classification may only provide arrays of hydrophobic BC and hydrophilic BC in models, and there may not be a clear threshold value to distinguish between hydrophobic and hydrophilic states of BC parti-cles. However, our definition can give the degree of the threshold values between the hydrophobic BC and the hy-drophilic BC modes based on supersaturation. It is noted that
supersaturation is initially used for the definition of BC par-ticles in models, and we do not need to calculate supersat-uration itself in models (e.g., we do not need to calculate supersaturations for aerosol activation).
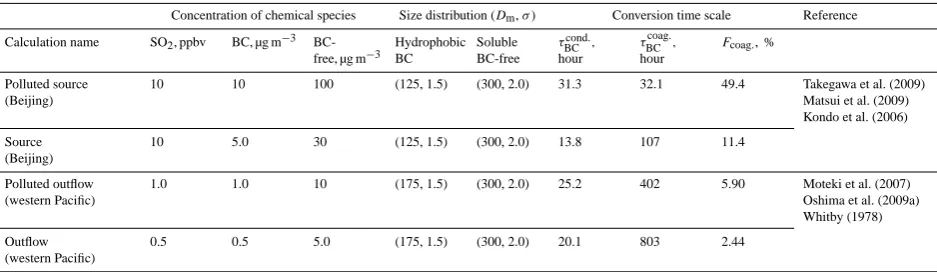
In this appendix, we describe the dependence ofτBCon the
definitions of hydrophobic BC and hydrophilic BC, namely supersaturation,s( %), between 0.05 % and 1 % for all log-normal BC size distributions shown in Fig. 1. The depen-dence is expressed byF (s)≡τBC(s)/τBC(0.1), whereτBC(s)
andτBC(0.1) are theτBCvalues for a supersaturation of any s% and 0.1 %, respectively. F (s)is approximately derived from K¨ohler theory as follows (see latter half of this ap-pendix):
F (s)≡ τBC(s) τBC(0.1)
=
ln1+0.1 100
ln 1+ s 100
2
. (B1)
Figure B1 shows comparisons of theF (s)values as a func-tion of s calculated by Eq. (B1) (black curves) with the
τBC(s)/τBC(0.1) values derived from the calculation results
using all combinations of the initial parameters (shown in Ta-ble 1) between 0.05 % and 1 % with a 0.05 % interval (gray circles) for each given lognormal BC size distribution (shown in Fig. 1). The good agreements shown in Fig. B1 indicate the validity of the use of Eq. (B1) to represent the dependence on the supersaturation, at least between 0.05 % and 1 %, for the given lognormal BC size distributions shown in Fig. 1.
Taking into account this dependence, a formula for the parameterized conversion rate from hydrophobic BC to hy-drophilic BC presented in Eq. (9) is represented as follows:
1
τBC
= VBC A(Dm, σ )·F (s)
, (B2)
where VBC (h−1)is the hydrophobic-BC-mass-normalized
coating rate (given by Eq. 6),A(Dm,σ) is a constant value
representing the dependence on the lognormal BC size distri-bution (shown in Table 2), andF (s)is a correction factor for the definition of hydrophobic BC and hydrophilic BC (given by Eq. B1).
Finally, an application method of this parameteriza-tion (Eq. B2) to GCMs is described here. If the user wants to change the definition of hydrophobic BC and hydrophilic BC in the user’s GCM, one value of supersaturation,s%, has to be chosen by the user to calculateF (s)using Eq. (B1). For example, if the user wants to give the degrees of hydrophilic particles as those activated for stratiform clouds, the user can give smaller values ofs, such as 0.05 %, for the correction factorF (s). The subsequent method is described in Sect. 4.
Fig. B1.
Fig. B1. Comparisons of theF (s) (≡τBC(s)/τBC(0.1)) values as
a function ofs(supersaturation, %) calculated by Eq. (B1) (black curves) with theτBC(s)/τBC(0.1) values derived from the calcula-tion results using all combinacalcula-tions of the initial parameters shown in Table 1 between 0.05 % and 1 % with a 0.05 % interval (gray cir-cles) for each given lognormal BC size distribution shown in Fig. 1.
lnS= A Ddrop
− B
D3drop, (B3)
where
A=4Mwσw RT ρw , B=
6υmsMw
π Msρw (B4)
andmsis the mass concentration of solute. The critical satu-ration,Sc, is derived analytically:
lnSc=
4A3
27B !1/2
, (B5)
and substituting Eq. (B4) into Eq. (B5) gives lnSc=
C √
msc
, (B6)
where
C= 2A 3πρwMs
81υMw !1/2
(B7)
andmscis the mass concentration of the particle to become
CCN active for the critical saturation. Here we consider the case that the small particle grows and subsequently has a suf-ficient coating amount to become CCN active for a given air supersaturation. We define a growth rate of coating on the particle (Vs), and when the particle has the sufficient coating
to have CCN activity for a given air supersaturation,msc is
approximately given by
msc=Vsτsc, (B8)
whereτscis the time required for the particle to become CCN active due to condensational growth. Substituting (B8) into (B6) gives
τsc= C 2
Vs(lnSc)2. (B9)
In order to derive a relationship betweenτsc and a supersat-uration (s, in %) for the same particle with the same growth rate (Vs), we divideτsc(s)byτsc(0.1) (i.e., theτscvalues for a supersaturation of anys% and 0.1 %, respectively) and ob-tain
τsc(s) τsc(0.1)
=
ln1+0.1 100
ln 1+ s 100
2
. (B10)
This expression indicates that τsc(s) can be derived from τsc(0.1). We need to derive the dependence ofτBCon
values are given. Applying Eq. (B10) for the case that the BC particle has a sufficient coating amount to become CCN active due to condensational growth, we can approximately replaceτsc byτBC in Eq. (B10), and therefore Eq. (B1) is
obtained.
Acknowledgements. This work was supported by the Ministry of Education, Culture, Sports, Science, and Technology and Japan Society for the Promotion of Science (MEXT/JSPS) through the Grant-in-Aid for Young Scientists (B) (KAKENHI) 23710029. This work was supported in part by the MEXT/JSPS Grant-in-Aid for Scientific Research (S) (KAKENHI) 23221001 and the global environment research fund of the Japanese Ministry of the Environment (A-0803 and A-1101). This study was conducted as a part of the Mega-Cities: Asia Task under the framework of the International Global Atmospheric Chemistry (IGAC) project. We thank T. Takemura, D. Goto, M. Kajino, and T. Y. Tanaka for providing helpful comments on this paper.
Edited by: A. Lauer
References
Adachi, K., and Buseck, P. R.: Atmospheric tar balls from biomass burning in Mexico, J. Geophys. Res., 116, D05204, doi:10.1029/2010JD015102, 2011.
Aquila, V., Hendricks, J., Lauer, A., Riemer, N., Vogel, H., Baum-gardner, D., Minikin, A., Petzold, A., Schwarz, J. P., Spackman, J. R., Weinzierl, B., Righi, M., and Dall’Amico, M.: MADE-in: a new aerosol microphysics submodel for global simulation of insoluble particles and their mixing state, Geosci. Model Dev., 4, 325–355, doi:10.5194/gmd-4-325-2011, 2011.
Bardeen, C. G., Toon, O. B., Jensen, E. J., Marsh, D. R., and Harvey, V. L.: Numerical simulations of the three-dimensional distribu-tion of meteoric dust in the mesosphere and upper stratosphere, J. Geophys. Res., 113, D17202, doi:10.1029/2007JD009515, 2008. Bauer, S. E., Wright, D. L., Koch, D., Lewis, E. R., Mc-Graw, R., Chang, L.-S., Schwartz, S. E., and Ruedy, R.: MA-TRIX (Multiconfiguration Aerosol TRacker of mIXing state): an aerosol microphysical module for global atmospheric models, Atmos. Chem. Phys., 8, 6003–6035, doi:10.5194/acp-8-6003-2008, 2008.
Bellouin, N., Rae, J., Jones, A., Johnson, C., Haywood, J., and Boucher, O.: Aerosol forcing in the Climate Model Intercom-parison Project (CMIP5) simulations by HadGEM2-ES and the role of ammonium nitrate, J. Geophys. Res., 116, D20206, doi:10.1029/2011jd016074, 2011.
Binkowski, F. S. and Roselle, S. J.: Models-3 Commu-nity Multiscale Air Quality (CMAQ) model aerosol compo-nent. 1. Model description, J. Geophys. Res., 108(D6), 4183, doi:10.1029/2001JD001409, 2003.
Bond, T., Habib, G., and Bergstrom, R. W.: Limitations in the en-hancement of visible light absorption due to mixing state, J. Geo-phys. Res., 111, D20211, doi:10.1029/2006JD007315, 2006. Byun, D. W. and Ching, J. K. S.: Science algorithms of the EPA
Models-3 Community Multi-scale Air Quality (CMAQ) model-ing system, US Environmental Protection Agency, Office of
Re-search and Development, Washington, DC, EPA/600/R-99/030, 1999.
Capaldo, K. P., Pilinis, C., and Pandis, S. N.: A computationally efficient hybrid approach for dynamic gas/aerosol transfer in air quality models, Atmos. Environ., 34, 3617–3627, 2000. Chung, S. H. and Seinfeld, J. H.: Global distribution and climate
forcing of carbonaceous aerosols, J. Geophys. Res., 107, 4407, doi:10.1029/2001JD001397, 2002.
Chung, S. H. and Seinfeld, J. H.: Climate response of direct ra-diative forcing of anthropogenic black carbon, J. Geophys. Res., 110, D11102, doi:10.1029/2004JD005441, 2005.
Cooke, W. F. and Wilson, J. J. N.: A global black carbon aerosol model, J. Geophys. Res., 101, D14, 19395–19409, 1996. Cooke, W. F., Liousse, C., Cachier, H., and Feichter, J.:
Con-struction of a 1×1 fossil fuel emission data set for carbona-ceous aerosol and implementation and radiative impact in the ECHAM4 model, J. Geophys. Res., 104, 22137–22162, 1999. Cooke, W. F., Ramaswamy, V., and Kasibhatla, P.: A general
circu-lation model study of the global carbonaceous aerosol distribu-tion, J. Geophys. Res., 107, 4279, doi:10.1029/2001JD001274, 2002.
Croft, B., Lohmann, U., and von Salzen, K.: Black carbon ageing in the Canadian Centre for Climate modelling and analysis atmo-spheric general circulation model, Atmos. Chem. Phys., 5, 1931– 1949, doi:10.5194/acp-5-1931-2005, 2005.
Donner, L. J., Wyman, B. L., Hemler, R. S., Horowitz, L. W., Ming, Y., Zhao, M., Golaz, J. C., Ginoux, P., Lin, S. J., Schwarzkopf, M. D., Austin, J., Alaka, G., Cooke, W. F., Delworth, T. L., Freiden-reich, S. M., Gordon, C. T., Griffies, S. M., Held, I. M., Hurlin, W. J., Klein, S. A., Knutson, T. R., Langenhorst, A. R., Lee, H. C., Lin, Y., Magi, B. I., Malyshev, S. L., Milly, P. C. D., Naik, V., Nath, M. J., Pincus, R., Ploshay, J. J., Ramaswamy, V., Se-man, C. J., Shevliakova, E., Sirutis, J. J., Stern, W. F., Stouffer, R. J., Wilson, R. J., Winton, M., Wittenberg, A. T., and Zeng, F.: The dynamical core, physical parameterizations, and basic simu-lation characteristics of the atmospheric component AM3 of the GFDL global coupled model CM3, J. Climate, 24, 3484–3519, doi:10.1175/2011jcli3955.1, 2011.
Gery, M. W., Whitten, G. Z., Killus, J. P., and Dodge, M. C.: A photochemical kinetics mechanism for urban and regional scale computer modeling, J. Geophys. Res., 94, 12925–12956, 1989. Goto, D., Nakajima, T., Takemura, T., and Sudo, K.: A study of
uncertainties in the sulfate distribution and its radiative forc-ing associated with sulfur chemistry in a global aerosol model, Atmos. Chem. Phys., 11, 10889–10910, doi:10.5194/acp-11-10889-2011, 2011a.
Goto, D., Schutgens, N. A. J., Nakajima, T., and Takemura T.: Sen-sitivity of aerosol to assumed optical properties over Asia using a global aerosol model and AERONET, Geophys. Res. Lett., 38, L17810, doi:10.1029/2011GL048675, 2011b.
Goto, D., Oshima, N., Nakajima, T., Takemura, T., and Ohara, T.: Impact of the aging process of black carbon aerosols on their spa-tial distribution, hygroscopicity, and radiative forcing in a global climate model, Atmos. Chem. Phys. Discuss., 12, 29801–29849, doi:10.5194/acpd-12-29801-2012, 2012.