Analysis of soil physical properties of different land forms in and around
Nagal Hatnala region, Dehradun
1Brij M Upreti, 2 Manveer Singh Kandari
#1Head department of Botany, 2*Head Department of Zoology
Uttaranchal College of Science and Technology, Dehradun. Email - 1[email protected], 2 [email protected]
1. INTRODUCTION:
Soil is defined as, an independent body in nature with a unique morphology from the surface down to the parent material as expressed by the sample profiles[1], which has been derived from the Latin word “Solum”. The study of soil is known as the ‘Pedology’ (pedos means earth) or ‘Edaphology’ (edaphos means soil). Soil may also be defined as the part of the earth crust in which humus is present [2]. Soil can also be defined as “A dynamic natural body on the surface of earth, in which plants grow composed. Soil plays a vital role in the survival of living beings on earth. It provides Soil fertility,Soil microbiology,Soilorganic matter, Soil a source of minerals,the soil is used for making utensils, Soil a source of medicines, Home for animals, bird & insects. Soil profiling of various forest were also done by researchers in Pithoragarh, Uttarakhand [3][4][5]. Present study is focused on soil profiling of different land forms at Dehradun, Uttarakhand.
2. AREA OF STUDY:
Fig 1. Google earth image of study area. A. Water resource, B. Agricultural area, C. Construction area.
Selection of site: Present study has been conducted in three land forms Dehradun district of Uttarakhand, India, namely: AGRICULTURAL LAND, CONSTRUCTION AREA, and WATER RESOURCE. The traditional names of water resources in Uttarakhand are: Gul, Naula, Dhara, Simar, Chuptaula, Khal, and Dhaan.
Abstract: Soil is defined as, an independent body in nature with a unique morphology from the surface down to the parent material as expressed by the sample profiles. Different parameters were used to analyse the soil physical properties viz soil texture, Water holding capacity, moisture content, bulk density, porosity. Present study shows maximum sand percentage (53.03%) in construction area while minimum percentage (38%) in water resource area. Maximum and minimum silt percentage recorded from construction area (37.75%) and water resource area (33.24%) respectively likewise water resource area shows maximum and minimum clay percentage i.e. 23.94% and 14.13%.Water resource area and construction area shows maximum and minimum bulk density i.e. 1.12g/cm3 and 0.97 g/cm3 respectively. Maximum and minimum water holding capacity was recorded at Agriculture land (19.29%) and construction area (10.42%) respectively. Construction area shows maximum porosity (63.45%), pH (6.8) while minimum at water resource area i.e. 57.72% and 5.2 respectively. As per above observation this can be estimated that water source area and agriculture land having better soil physical properties as compare to construction area, it is due to over constriction and deforestation around construction area.
Soil Physical Analysis: Samples collected from four different depths viz., (i) upper (0–10 cm), (ii) middle (11–20 cm) and (iii) lower middle (21–30 cm) for assessing the physical properties of the soil in all the selected areas. All the samples were brought separately to the laboratory in polythene bags for the analysis of physical properties.
Soil moisture: Soil moisture was determined by the following for formula [6]. Fresh weight of the soil- Dry weight of the soil
Moisture content (%) = --- x 100 Dry weight of the soil
Soil bulk density: Soil bulk density was calculated by following formula [7]. Mass (g)
Bulk density = ---Volume (cm3)
.Soil porosity: Soil porosity was calculated by following formula [8]. Bulk density
Porosity (%) = --- x 100 Particle density (2.65)
Soil water holding capacity: WHC determined by the following formula [9]. W2 – W3 – W4
WHC (%) = --- x 100 W3 – W1
Where,
W1 =weight of sieve + filter paper
W2 = weight of sieve + filter paper + wet soil W3 = weight of sieve + filter paper + oven dried soil W4 = water absorbed by filter paper
Statistical Analysis: The value for each sample was calculated as the Mean, SE, and SD. were tested on mean values by one way ANOVA; using SPSS 22.
3. ANALYSIS AND DISCUSSION:
Water Resource Area
Soil Texture: Results shows maximum sand percentage(52.63%) at the depth of 0-10 cm., minimum (38.61%) at the depth of 11-20 cm.Maximum silt (37.71%) recorded at 21-30cm depth while minimum(33.24%) at 0-10 cm depth. And maximum clay (23.94%) at the depth of 11-20 cm and minimum (14.13%) at the depth of 0-10cm was recorded. Bulk Density: Observations shows maximum bulk density (1.12g/cm3) at the depth of 21-30 cm while minimum (0.97 g/cm3) at the depth of 0-10 cm.
Water Holding Capacity: Results shows maximum water holding capacity (13.60) at the depth of 0-10 cm while minimum (12.93) at the depth of 21-30 cm.
Porosity: Results shows maximum porosity (61.85%) at the depth of 0-10 cm while minimum (57.72%) at the depth of 21-30 cm.
Moisture Content: Results shows maximum moisture content (21.95%) at the depth of 21-30 cm while minimum (11.11%) at the depth of 0-10 cm.
Construction Area
Soil Texture: Results shows maximum sand percentage(53.03%) at the depth of 0-10 cm., minimum (38.55%) at the depth of 11-20 cm.Maximum silt (37.75%) recorded at 11-20cm depth while minimum(33.43%) at 0-10 cm depth. And maximum clay (23.69%) at the depth of 11-20 cm and minimum (13.54%) at the depth of 0-10cm was recorded. Bulk Density: Observations shows maximum bulk density (1.12g/cm3) at the depth of 21-30 cm while minimum (0.97 g/cm3) at the depth of 0-10 cm.
Water Holding Capacity: Results shows maximum water holding capacity (13.60) at the depth of 0-10 cm while minimum (12.93) at the depth of 21-30 cm.
Agricultural Land
Soil Texture: Results shows maximum sand percentage (52.79%) at the depth of 0-10 cm., minimum (39.75%) at the depth of 11-20 cm.Maximum silt (36.30%) recorded at 21-30cm depth while minimum (35.64%) at 0-10 cm depth. And maximum clay (22.95%) at the depth of 11-20 cm and minimum (14.37%) at the depth of 0-10cm was recorded. Bulk Density: Observations shows maximum bulk density (1.08g/cm3) at the depth of 21-30 cm while minimum (1.0 g/cm3) at the depth of 0-10 cm.
Water Holding Capacity: Results shows maximum water holding capacity (19.29) at the depth of 0-10 cm while minimum (9.87) at the depth of 21-30 cm.
Porosity: Results shows maximum porosity (62.38%) at the depth of 0-10 cm while minimum(59.17%) at the depth of 21-30 cm.
Moisture Content: Results shows maximum moisture content (19.05%) at the depth of 21-30 cm while minimum (6.38%) at the depth of 0-10 cm.
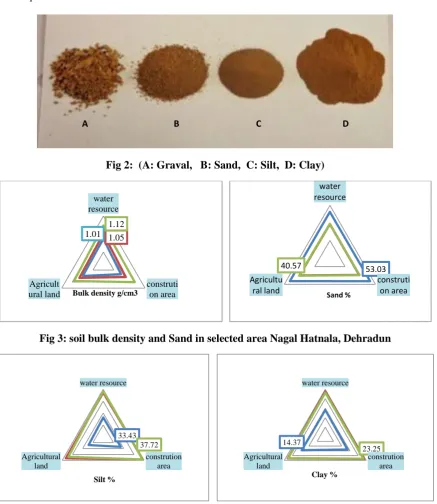
Fig 2: (A: Graval, B: Sand, C: Silt, D: Clay)
Fig 3: soil bulk density and Sand in selected area Nagal Hatnala, Dehradun
Fig 4: soil silt and clay percentage in selected area Nagal Hatnala, Dehradun
1.01 1.05 1.12 water resource
construti on area Agricult
ural land Bulk density g/cm3
53.03 40.57
water resource
construti on area Agricultu
ral land Sand %
33.43 37.72 water resource
constrution area Agricultural
land
Silt %
14.37
23.25 water resource
constrution area Agricultural
land
Clay %
Fig 5: soil porosity and Moisture content in selected area Nagal Hatnala, Dehradun
Fig 6: soil water holding capacity in selected area Nagal Hatnala, Dehradun
Table I. Physical Properties of Soil collected from different sites of Nagal Hatnala, Dehradun.( BD = Bulk Density, WHC = Water Holding Capacity)
4. CONCLUSION:
Present study shows maximum sand percentage is recorded at 0-10 cm depth in construction area while minimum percentage at 11 – 20 cm depth in water resource area. Maximum and minimum silt percentage recorded from
63.45 61.65 59.17
water resource
constrution area Agricultural
land
Porosity %
11.11 16.28 21.95 water resource
constrution area Agricultura
l land
Moisture content %
14.96 16.72 19.29 water resource
constrution area Agricultural land
Water holding capacity
Depth (cm.)
Sand silt Clay BD g/cm3 WHC Porosity Moisture
content
pH
Water resource area
0-10 52.63±0.40 b 33.24±0.37 a 14.13±0.22 a 1.01±0.02 abc 14.96±0.27 c 61.85±0.15 fg 11.11±0.12 c 5.2±0.33c 11-20 38.61±0.25 a 37.45±0.17 b 23.94±0.19 b 1.05±0.02 abcd 13.60±0.24 b 60.30±0.13 d 16.28±0.04 d 5.7±0.26b 21-30 38.98±0.23 a 37.71±0.20 b 23.31±0.28 b 1.12±0.06 d 12.93±0.23 b 57.72±0.12 a 21.95±0.05 f 6.2±0.19a
Construction area
0-10 53.03±2.02 b 33.43±1.11 a 13.54±0.55 a 0.97±0.02 a 16.72±0.24 d 63.45±0.22 h 2.04±0.05 a 6.0±0.16a 11-20 38.55±1.33 a 37.75±1.27 b 23.69±0.97 b 1.02±0.02 abc 15.41±0.23 c 61.65±0.04 ef 6.38±0.10 b 6.3±0.39c 21-30 39.04±1.72 a 37.72±1.24 b 23.25±0.74 b 1.10±0.02 cd 10.42±0.23 a 58.43±0.20 b 11.11±0.11 c 6.8±0.30b
Agricultural land
0-10 52.79±0.39 b 36.13±1.45 a 14.37±0.26 a 1.00±0.03 ab 19.29±0.32 f 62.38±0.19 g 6.38±0.17 b 5.5±0.49c 11-20 39.75±0.71 a 36.30±1.44 b 22.95±0.25 b 1.03±0.02 abcd 17.65±0.21 e 61.12±0.06 e 16.28±0.09 d 6.3±0.22a 21-30 40.57±0.74 a 35.64±1.41 b 22.64±0.16 b 1.08±0.02 bcd 9.87±0.16 a 59.17±0.46 c 19.05±0.08 e 6.4±0.24b
capacity was recorded at Agriculture land at 0-10cm depth and construction area at 21-30cm depth respectively. Construction area shows maximum porosity at 0-10cm depth.
As per above observation this can be estimated that water source area and agriculture land having better soil physical properties as compare to construction area, it is due to over constriction and deforestation around construction area.
REFERENCES:
1. Tan Kim, (1995),Soil Sampling, Preparation and Analysis, Marcel Dekker, Inc. New York,.
2. Shukla R.S & Chandel PS, (1991), Plant Ecology and Soil Science, S. Chand and Co. Ltd., New Delhi, VII edition.
3. Upreti BM, Tewari L, Tewari A & Joshi N, (2016), Physiochemical Characterization of Soil Collected from Sacred and Non- sacred Forests of Uttarakhand: A Comparative Study. J. Chem. Eng. Chem. Res., 3(11), 989-992.
4. Upreti BM, (2018), Eco –taxonomical exploration of major sacred forests in Pithoragarh district of Kumaun Himalaya and their significance in phytodiversity conservation. Ph.D Thesis submitted to Kumaun University, Nainital, Uttarakhand.
5. Upreti Brij Mohan, Tewari Lalit M, Tewari Ashish, Pandey Naveen, (2019), Sacred Forests of Pithoragarh, Western Himalaya, India, (INDU BOOK SERVICES PVT. LTD.).
6. Bouyoucos G.J, (1921), A new classification of soil moisture, Soil Sci. 11, 33-48.