R E S E A R C H
Open Access
The genomic underpinnings of eukaryotic
virus taxonomy: creating a sequence-based
framework for family-level virus
classification
Pakorn Aiewsakun and Peter Simmonds
*Abstract
Background:The International Committee on Taxonomy of Viruses (ICTV) classifies viruses into families, genera and species and provides a regulated system for their nomenclature that is universally used in virus descriptions. Virus taxonomic assignments have traditionally been based upon virus phenotypic properties such as host range, virion morphology and replication mechanisms, particularly at family level. However, gene sequence comparisons provide a clearer guide to their evolutionary relationships and provide the only information that may guide the incorporation of viruses detected in environmental (metagenomic) studies that lack any phenotypic data.
Results:The current study sought to determine whether the existing virus taxonomy could be reproduced by examination of genetic relationships through the extraction of protein-coding gene signatures and genome organisational features. We found large-scale consistency between genetic relationships and taxonomic assignments for viruses of all genome configurations and genome sizes. The analysis pipeline that we have called‘Genome Relationships Applied to Virus Taxonomy’ (GRAViTy) was highly effective at reproducing the current assignments of viruses at family level as well as inter-family groupings into orders. Its ability to correctly differentiate assigned viruses from unassigned viruses, and classify them into the correct taxonomic group, was evaluated by threefold cross-validation technique. This predicted family membership of eukaryotic viruses with close to 100% accuracy and specificity potentially enabling the algorithm to predict assignments for the vast corpus of metagenomic sequences consistently with ICTV taxonomy rules. In an evaluation run of GRAViTy, over one half (460/921) of (near)-complete genome sequences from several large published metagenomic eukaryotic virus datasets were assigned to 127 novel family-level groupings. If corroborated by other analysis methods, these would potentially more than double the number of eukaryotic virus families in the ICTV taxonomy.
Conclusions:A rapid and objective means to explore metagenomic viral diversity and make informed recommendations for their assignments at each taxonomic layer is essential. GRAViTy provides one means to make rule-based assignments at family and order levels in a manner that preserves the integrity and underlying organisational principles of the current ICTV taxonomy framework. Such methods are increasingly required as the vast virosphere is explored.
Keywords:Virus, Metagenomic, Taxonomy, Virus classification, Taxon, Hidden Markov model, Baltimore classification
* Correspondence:[email protected]
Nuffield Department of Medicine, University of Oxford, Peter Medawar Building, South Parks Road, Oxford OX1 3SY, UK
Background
Virus taxonomy is a man-made construct that seeks to describe and catalogue the vast diversity of known viruses and their genetic interrelationships. Viruses are formally classified into orders, families, genera and species by the International Committee on Taxonomy of Viruses (ICTV; https://talk.ictvonline.org/). This organ-isation maintains a universal taxonomy of viruses that encapsulates their extraordinary genetic and structural diversity. Viral diversity is far greater than encountered in other organisms, with major differences in their genetic material (RNA or DNA) and configurations (double or single stranded) and orientation of their encoded genes. Viral genomes may be segmented, often co-packaged together or, more frequently, into separate virions that are then required to productively infect a cell. Virion morphology and size varies from particles with icosahedral or more complex symmetries or may form filamentous, rectangular, bullet, even bottle-shaped nucleocapsids. Some viruses are enveloped in a host-derived lipid bilayer. Finally, viral genomes are hugely variable in size and their complements of genes, ranging from less than 2000 bases encoding 2 genes to 2.5 million base pairs encoding over 2500 genes [1].
So diverse are viruses in terms of their replication strategy and structure that viruses lack a common set of genes by which their deeper evolutionary rela-tionships may be inferred. Unlike bacteria, fungi and other microorganisms, universal trees depicting their evolutionary histories cannot be constructed. Indeed, it is most likely that viruses may not share a common origin, but originate as parasitic companions of prokaryotes and eukaryotes at varying times in their host’s evolution.
The broadest division of viruses is the Baltimore classification, assignments that are based on their genome configurations as follows: I: dsDNA, II: ssDNA, III: dsRNA, IV: ssRNA sense orientation of genes, V: ssRNA, antisense orientation, VI: ssRNA with reverse transcription of a dsDNA replication inter-mediate and VII: dsDNA with a ssRNA replication intermediate [2]. With the exception of groups VI
and VII, members of which show substantial
similarities in genome organisation and replication strategies, this functional division splits viruses into groups that are largely or entirely unrelated to each other in evolutionary terms. However, the division is coarse with several groups, most evidently group I, containing several unlinked virus groups.
While current ICTV taxonomy has incorporated this diverse collection of evolutionarily related and unre-lated groups into a single, overarching framework, there are further challenges from the explosion in virus nucleotide sequence data that have been accrued from
next generation or high-throughput sequencing (HTS) methods. Their application to aquatic and terrestrial environmental samples, as well as to the gut micro-biome, has revealed an astonishing diversity of virus sequences, many bacteriophages, but others likely infecting a range of eukaryotes, including amoebae, algae, insects, fish and plants [3–7]. The majority of such sequences do not match any of those of viruses in currently assigned taxa, and clearly, the ICTV classification would have to be greatly expanded to incorporate this much greater dataset of viruses.
Recently, the ICTV, on advice from an expert group [8], expressed the intention to consider the incorpor-ation of viruses known only by their nucleotide sequences into the formal taxonomy. Classification of such viruses would be subject to there being coding complete genome sequences available and with appro-priate quality control to ensure sequence accuracy and avoid problems of misassembly [8]. However, these newly described viruses lack information on their pheno-typic properties that have historically been used in their classification, such as virion structure, pathogenicity in their hosts, replication mechanisms and epidemiology/ transmission routes. It was therefore proposed that the genome sequence itself may be used to infer a number of properties that may be used as attributes that assist in their taxonomic assignments.
The policy to accept metagenomic-derived sequences into the ICTV taxonomy is not entirely new, and large numbers of recent assignments of further species and genera within existing families have been made in recent years [9]. Many such taxonomy additions, particularly at the level of species or genus, can be justified because there is an existing framework of taxon assignments within such families, often based upon phenotypic properties of isolates of their founder members.
discovered in recent HTS and related investigations are to proceed on a rational and consistent basis in the future.
In the current study, we have extracted genomic features recoverable from genome sequences of currently classified eukaryotic viruses and sought to determine which are best predictive of their family or order assignments in the most recent ICTV taxonomy. Eukaryotic viruses are the main focus of this study as their taxonomy is well established and populated, and can be used to validate a taxonomic assignment frame-work. Degrees of relatedness that underpin current family and order divisions were estimated by extraction from viral genome sequences both their organisational features (gene complements and gene orders), sharing of homologous genes and their amino acid sequence identity. Features in these multi-parameter datasets were evaluated for their ability to recover the taxonomy of all currently classified eukaryotic viruses in the ICTV Master Species List. The identification of informative genome features that can precisely recapitulate the current ICTV taxonomy allows classification of currently unassigned viruses from their sequences alone. This is a process we have termed‘genome relationships applied to virus taxonomy (GRAViTy) assignments’, and its use may contribute to the foundation of a future, com-prehensive, internally consistent sequence-only classi-fication of viruses.
Results
Virus sequence and taxonomy information sources A complete list of 3854 eukaryotic viruses for which complete genome sequences are available was assembled (Additional file1: Table S1, Additional file 2: Table S2). These exemplify each of the current ICTV taxonomy assignments down to species level. This information was drawn from the ICTV Master Species List, the Virus Metadata Repository and further assignments approved by the ICTV Executive Committee in July 2017, currently under ratification vote. This collection provides the most complete and up-to-date collection of viruses with defined assignments.
Relationship among viruses within each Baltimore classification group
The first step in the analysis was the extraction of information on those genomic features from complete genome sequences of each virus. This use of multiple features extracted from viral sequences as potential contributors to taxonomy assignments contrasts with traditional phylogenetic methods, in which viruses are often represented by only small, highly conserved portions of their genomes, such as the catalytic core of
RNA-dependent RNA polymerase (RdRp) gene sequences for different groups of RNA viruses. Features extracted included gene complements, genomic organisation and metrics of gene homology. Herein, viruses are anno-tated with databases of protein profile hidden Markov models (PPHMMs) and genomic organisation models (GOMs). Instead of a molecular sequence, each virus is represented by a PPHMM signature and a GOM signature. A PPHMM signature is simply a list of the degrees of similarity of genes present in the virus to various PPHMMs in the database at the amino acid level. Similarly, a GOM signature is a list of the degrees of similarity of its genomic organisation to various GOMs in the database. Additional file 3: Table S3 summarises PPHMMs used in this study.
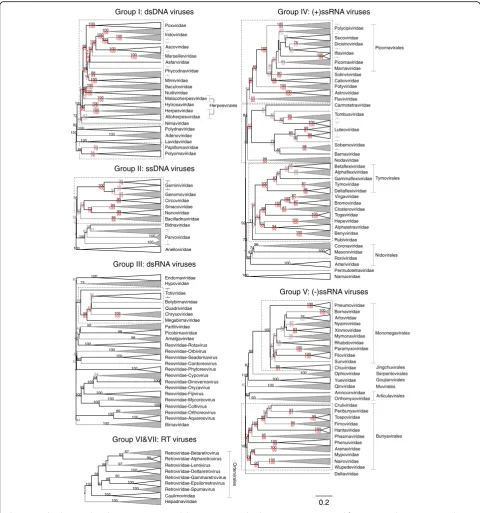
The second step was to estimate the degrees of virus relatedness through a multi-dimensional distance calculation based on a comparison of their PPHMM and GOM signatures. Sets of distances were trans-formed into a composite generalised Jaccard (CGJ) similarity index, J, which ranges in value between 0 (no detectable similarity) and 1 (sequence identity). Pairwise distances, D, simply 1−J, were used to con-struct dendrograms with the unweighted pair group method with arithmetic mean (UPGMA) algorithm. This method circumvents the need to first identify and align homologous genes that are often highly divergent in sequence. The GRAViTy method, in contrast, al-lows dendrograms to be constructed across very diver-gent viruses within a Baltimore group (see the ‘Methods’section) without prior intervention, modelling or evolutionary assumptions.
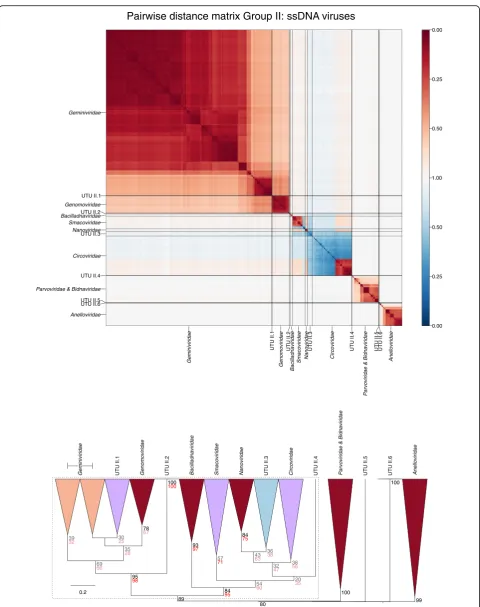
Sets of pairwise distances between members within each Baltimore group were visualised through colour-indexed heat maps (Fig. 1; Additional file 9: Figures S1– S6). Phylogeny relations between individual group and viral sequences were determined through
construc-tion of a UPGMA dendrograms (Fig. 2;
Add-itional file 10: Figures S7–S12). All dendrograms preserved the pairwise distances well (cophenetic correl-ation between the dendrogram and the distance matrix of group I = 0.994, group II = 0.984, group III = 0.995, group IV = 0.964, group V = 0.993, groups VI and VII = 0.990), indicating that the two are consistent.
Group I: dsDNA viruses Group II: ssDNA viruses
Group III: dsRNA viruses Group IV: (+)ssRNA viruses
Group V: (-)ssRNA viruses Group VI&VII: RT viruses
0.00 0.25 0.50 1.00
lengths and separation from other clades (Fig. 2; Additional file 10: Figures S7–S12) and, more impres-sionistically, were typically visualised as squares of intense colour in a background of yellow (Fig. 1; Additional file 9: Figures S1–S6).
Further detailed examination of dendrograms constructed from CGJ distances revealed, however, a small number of instances of families not being monophyletic, includ-ing separation of rubella virus (genus Rubivirus) from the rest of togaviruses, and polyphyletic groupings of
0.2
Ortervirales
Group VI&VII: RT viruses
Caulimoviridae Retroviridae-Alpharetrovirus Retroviridae-Betaretrovirus Retroviridae-Deltaretrovirus Retroviridae-Epsilonretrovirus Retroviridae-Gammaretrovirus Retroviridae-Lentivirus Retroviridae-Spumavirus Hepadnaviridae 100 100 100 100 100 100 90 86 91 98 99 97 99 9387 Mononegavirales Serpentovirales Goujianvirales Muvirales Articulavirales Bunyavirales Jingchuvirales
Group V: (-)ssRNA viruses
Amnoonviridae Orthomyxoviridae Arenaviridae Cruliviridae Fimoviridae Hantaviridae Mypoviridae Nairoviridae Peribunyaviridae Phasmaviridae Phenuiviridae Tospoviridae Wupedeviridae Yueviridae Chuviridae Artoviridae Bornaviridae Filoviridae Mymonaviridae Nyamiviridae Paramyxoviridae Pneumoviridae Rhabdoviridae Sunviridae Xinmoviridae Qinviridae Ophioviridae Deltaviridae 100 100 76 67 93 34 48 100 100 90 100 99 87 100 100 100 100 82 93 93 99 94 100 96 100 95 95 74 100 100 86 76 95 100
Group II: ssDNA viruses
Anelloviridae Bacilladnaviridae Circoviridae Genomoviridae Nanoviridae Smacoviridae Bidnaviridae 100 44 15 34 98 99 99 96 73 27 100 100 62 100 100 32 57 59 36 58 74 22 61 41 100 99 100 99 78 54 64 94
Group III: dsRNA viruses
Amalgaviridae Birnaviridae Botybirnaviridae Chrysoviridae Endornaviridae Hypoviridae Megabirnaviridae Partitiviridae Picobirnaviridae Quadriviridae Reoviridae-Aquareovirus Reoviridae-Cardoreovirus Reoviridae-Coltivirus Reoviridae-Cypovirus Reoviridae-Dinovernavirus Reoviridae-Fijivirus Reoviridae-Mycoreovirus Reoviridae-Orbivirus Reoviridae-Orthoreovirus Reoviridae-Oryzavirus Reoviridae-Phytoreovirus Reoviridae-Rotavirus Reoviridae-Seadornavirus 100 73 32 99 77 100 92 98 98 100 100 100 93 100 54 94 100 100 100 99 100 100 100 100 89 100 100 100 69 61 44 41 45 51 53 44 Totiviridae 24 100 78 95 Picornavirales Nidovirales Tymovirales
Group IV: (+)ssRNA viruses
Arteriviridae Coronaviridae Mesoniviridae Roniviridae Dicistroviridae Iflaviridae Marnaviridae Picornaviridae Secoviridae Alphaflexiviridae Betaflexiviridae Deltaflexiviridae Gammaflexiviridae Tymoviridae Alphatetraviridae Astroviridae Barnaviridae Benyviridae Bromoviridae Caliciviridae Carmotetraviridae Closteroviridae Flaviviridae Hepeviridae Narnaviridae Nodaviridae Permutotetraviridae Potyviridae Rubiviridae Solinviviridae Togaviridae Virgaviridae 100 53 13 76 33 100 44 80 84 100 85 87 100 100 68 95 100 99 94 85 98 84 99 81 48 68 87 100 81 96 87 87 100 100 87 100 100 94 100 88 96 93 97 100 100 100 70 72 71 73 92 74 Polycipiviridae Luteoviridae Sobemoviridae Tombusviridae 49 12 77 40 99 62 33 46 38 50 68 64 88 88 99 100 49 100 100 78 80 82 61 62 59 53 35 98 100 66 60 67 96 46 66 97 99 19 46 100 99 50 46 55 55 50 46 91 78 98 100 87 84 100 100 100 89 92 100 100 99 88 74 31 58 54 68 27 44 44 43 40 31 3358 63 40 100 69 89 54 51 100 100 42 24 91 22 100 40 61 58 100 87 66 60 100 97 96 100 99 89 92 80 99 99 91 86 93 100 100
Group I: dsDNA viruses
Baculoviridae Lavidaviridae Nudiviridae Papillomaviridae Herpesviridae Hytrosaviridae Alloherpesviridae Malacoherpesviridae Adenoviridae Asfarviridae Marseilleviridae Mimiviridae Nimaviridae Polydnaviridae Polyomaviridae Poxviridae 100 98 86 100 100 100 100 100 100 97 77 100 100 88 100 98 100 100 100 100 87 57 100 92 100 98 64 58 100 100 72 59 49 44 76 79 100 99 100 100 100 100 100 100 100 88 50 87 4184 100 97 100 100 99 100 50 100 100 90 58 Herpesvirales Iridoviridae 78 Ascoviridae Phycodnaviridae 51 48 58 50 Geminiviridae Parvoviridae
reoviruses. A detailed analysis of these exceptions and the extent to which other analyses support the GRAV-iTy groupings or the current ICTV classification is provided in Additional files 11 and 13. Summarising, most differences in grouping between GRAViTy ana-lysis of these virus groups and their current taxonomy have been reported previously and are consistent with virus relationships determined by other methods such as genome phylogenies (Additional file 11: Figures S13–S15). For most, CGJ distances provide further
evidence to support their future taxonomic
reassignments.
Virus taxonomy at the level of order could also be recovered with members in different families generally having much lower and distinct CGJ similarity scores than those between members of the same family. GRAViTy relationships that recapitulated currently assigned orders included Tymo-,Nido- and Bunyavirales
with 100, 88 and 100% bootstrap support, respectively. Further supported grouping at the level of order included the recently proposed Jingch-, Serpento-, Goujian-,
Mu-, Aricula- and Ortervirales (Fig. 2). Although not
formally assigned as an order, the evolutionarily related nucleo-cytoplasmic large DNA viruses (NCLDV; [10]), including Asco-, Irido-, Asfar-, Marseille-,
Phycodna-, Pox- and Mimiviridae families, formed a
separate grouping from other large DNA viruses, with 98% bootstrap support.
Picorna-, Mononega- and Herpesvirales were however
not monophyletic. ForPicornavcirales, members of the
CaliciviridaeandSolinviviridaefamilies, which are not
classified into this order, were embedded within the clade, while Potyviridae showed a sister relationship. However, this phylogeny is indeed consistent with the previously noted relationships of these groups based on RdRp phylogenies and originates from discrepancies in replication gene relationships from structural protein structures that define their capsid morphology and symmetry [11].
Chuviridae, the sole family of the orderJingchuvirales,
was positioned within the clade of Mononegavirales
and separated Pneumoviridae from the rest of the order, although the branch separating them was short and not bootstrap supported (Fig.2; Additional file 10: Figure S9). Collectively, however, the two orders form a monophyletic clade with 100% bootstrap support.
The inclusion of the three families (Herpes-,Alloherpes
-and Malacoherpesviridae) in the orderHerpesvirales is
primarily based upon their characteristic capsid morph-ology, without readily detectable sequence homology that defines this order [12]. We found that the only shared profile across these three families was between their genes coding for DNA packaging terminase, consistent with previous analyses [13]. Nevertheless,
the herpesvirus families were collectively embedded within a larger clade of large DNA virus which exhibit detectable, similarity to each other through homologous DNA polymerase, protein kinase and ribonucleotide reductase genes (Baculo-, Nudi-, Hytrosa-, Asco-,
Irido-, Asfar-, Marseille-, Phycodna-, Pox-, Mimi- and
Nimaviridae). This higher level grouping showed
100% bootstrap support but excluded thePolydnaviridae
that showed a much less degree of relatedness to other large DNA viruses (74% bootstrap support). For this latter virus family, its two genera are considered to be inde-pendently derived from perhaps an ancestral nudivirus
(Bracovirus) and another large cytoplasmic DNA virus
(Ichnovirus) [14]. They nevertheless formed a bootstrap
supported but highly divergent clade, reflecting shared profiles of their cysteine-rich protein-coding genes (c4.1 and d9.2 of the Hyposoter fugitivus ichnovirus, homologues in Campoletis sonorensis ichnovirus and CRP1 and CRP3 proteins of the Cotesia congregate brachovirus [15–17]). Finally, there was further support for all DNA viruses possessing DNA polymerase creating a larger clade that encompassed Adenoviridae and
Lavidaviridaefrom which the small DNA virus families of
Polyomavirdae and Papillomaviridae were excluded
(100% bootstrap support). These two latter families were, however, linked through PPHMM matches of their E1 and NS proteins corresponding to the previously noted protein sequence homology [18, 19], creating a relatively deeply branching clade with 98% bootstrap support.
In group II,Gemini-,Genomo-,Circo-,Smaco-,Nano
-and Bailladnaviridae families, clustered together
through possession of the rep gene (78% bootstrap support), corresponding to membership of the circular replication-associated protein encoding single-stranded (CRESS) group of ssDNA viruses [20,21] whileParvoviridae
and Anelloviridae fell into separate groups. Among the
dsRNA viruses in group III, we observed unrecognised inter-family relationships included groupings of Chryso-,
Quadri-, Megabirna-, Botybirna- and Totiviridae (77%
bootstrap support). There was a similar grouping between
Bromo-,Virga-,Clostero- andTogaviridaeof group IV (88%
bootstrap support), a grouping partly congruent with the previously proposed‘alpha-like’group of viruses [22]. This clade in turn grouped within a larger clade with 71% bootstrap support that included Alphatetraviridae,
Hepeviridae, Benyviridae, Rubivirus, the four established
families within the Tymovirales (Alpha-, Beta- and
GammaflexiviridaeandTymoviridae) andDeltaflexiviridae
(a recently proposed new family within the order
Tymovirales). Lists of protein profiles connecting
Methods for bootstrap resampling
While all classified virus families formed distinct clusters in the dendrograms and heat maps, a minority of families (n= 10) showed bootstrap support below 70%, a commonly accepted measure indicative of the robustness of group-ings. These comprised the Papilloma- (64% bootstrap support), and Polyomaviridae (58% bootstrap support) in Baltimore group I, Gemini- (34/15% bootstrap support),
andGenomoviridae(44%) in group II,Totiviridae(32%) in
group III, and Picornaviridae (44%) and several other families in group IV, and finally, Mymona- (34%) and
Rhabdoviridae(48%) in group V (Fig.2). Apart from
sim-ply representing a more diverse group of viruses, the lower bootstrap support values for some virus families may have originated from possession of mosaic genomes and conflicting PPHMM and GOM signature relationships with other viruses. Another contributor may have arisen through the nature of bootstrapping resampling of a relatively sparse table of PPHMM and GOM signatures and the failure to sample the intended number of entries, or in extreme cases, any at all.
To investigate this, we separated the dataset into sub-groups that shared no signatures between them. Examples included the separation of Polyomavirdae
andPapillomaviridaefrom other DNA viruses that shared
PPHMM signatures associated with DNA polymerase and other replicative geners. We then reformulated separate signature tables for the two groups to exclude PPHMMs and GOMs that were not relevant to members of each (see the ‘Methods’ section for details). This substantially re-duced the bootstrap sampling space, particularly for
Polyomavirdae and Papillomaviridae, that possess
rela-tively small genomes compared to other dsDNA viruses. Using these modified tables, bootstrap support did increase substantially forPapilloma- (64 to 79% bootstrap support, Fig. 2, red labelling), and Polyomaviridae (58 to 76%). Similar improvements in bootstrap support were noted in several further virus families in other Baltimore groups including Geminiviridae (74%), Genomoviridae
(61%) and Flaviviridae (82%). Nevertheless, bootstrap support for many other families remained relatively unchanged, suggesting other underlying causes for their less robust groupings (see the‘Discussion’section).
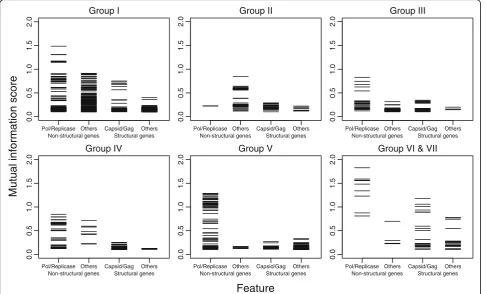
Informative genome features that group viruses according to ICTV taxonomy
Mutual information (MI) scores were calculated to evaluate what genes were predictive of virus taxonomic relationships. The greater the value, the higher the dependency between the feature and the taxonomic assignment (Fig. 3; Additional file 5: Table S5). In general, PPHMMs of genes involved in replication, particularly those encoding polymerases, showed the
highest MI scores. There was a sharp drop in MI scores between the features associated with non-structural proteins and with structural proteins (Fig. 3). This result reflects the generally greater se-quence conservation of many replication-related pro-teins of eukaryotic viruses within the same families but, at the same time, indicates that they are differ-ent enough among viruses of differdiffer-ent families to be useful for virus classification purpose.
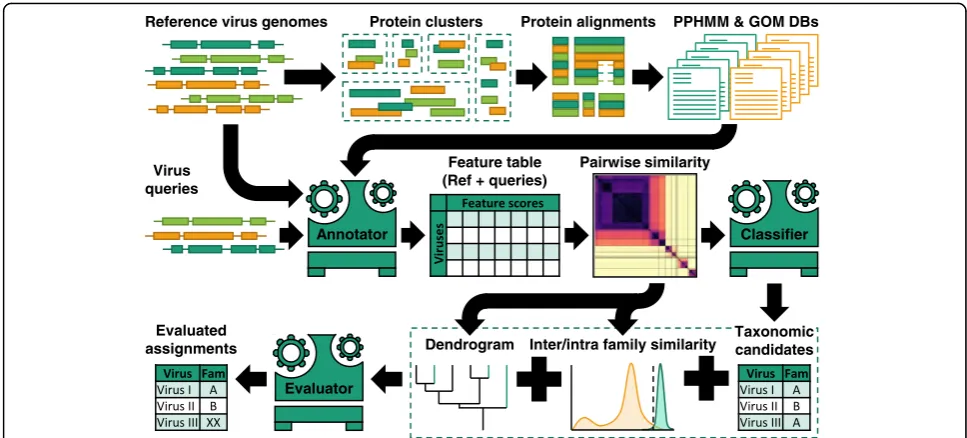
Taxonomic assignment framework and cross-validation To investigate the ability of the framework to correctly assign known and unknown viruses, sequences from the classified dataset were sampled and analysed through six sub-pipelines, one for each Baltimore group. Each possesses three compartments: (i) feature annotator—-annotates viruses of interest with databases of PPHMMs and GOMs; (ii) classifier—assigns taxonomic groups to sequences based on their genome annotation; and (iii) classification evaluator—decides whether or not to accept or reject the taxonomic proposals (Fig.4). Briefly, in each sub-pipeline, feature annotator produces PPHMM and GOM signatures for virus queries. Pair-wise similarities between the signatures of the queries and those of viruses in the database are then computed. The classifier in turn proposes taxonomic groups to vi-ruses according to their most similar counterparts in the database (1-nearest neighbour). The taxonomic pro-posals were then either accepted or rejected depending on the immediate neighbourhood of the viruses in the dendrogram.
These results indicate that the genome features and distance metrics we have developed were both ex-tremely sensitive and accurate. It therefore may guide genome only based classification of viral sequences in wider metagenomic datasets in a way that is consist-ent with currconsist-ent ICTV taxonomy.
Taxonomy relationships of currently unclassified viral gene sequences
GRAViTy was used to explore the diversity and potential future taxonomy assignments of real-world sequences described in recently published virus sequence datasets [23–28]. These include a wide range of small DNA virus and RNA virus sequences from environmental samples and from arthropods whose virome is known to be highly diverse but currently poorly characterised (Additional file7: Table S7).
Viruses characterised as possessing ssDNA circular genomes [23–26] showed detectable similarity only to viruses in the Baltimore group II dataset. Through CGJ distance measurements and positions in the den-drograms, several fell into genetically divergent clades
within the broader group of rep-containing viruses. These groups termed ‘unassigned taxonomy units’ (labelled as UTU II.1–UTU II.4; Fig. 5; Table 2; Additional file12: Figure S16) were bootstrap supported and represent potentially additional virus families should these relationships be corroborated by further analysis, such as rep-gene phylogeny and other comparative genomic metrics. Other viruses expanded the diversity of the existing assigned virus families Circoviridae and
Smacoviridae.
There was a similar mix of novel groups and further examples of existing families on analysis of unclassified RNA viruses linked to Baltimore group III (Fig. 6; Table 2; Additional file12: Figure S17). Examples of the former included a series of clusters (UTU III.3 and UTU III.4) most similar to, but grouping separately from,
Toti-viridaeand theGiardiavirusgenus sequences. There were
several further examples of Totiviridae, Partitiviridae
(forming two new within-family groups) andHypoviridae
and viruses related to theFijivirusandSeadornavirus gen-era within separate branches of the Reoviridae. Finally, there were potentially as many as four new families of pre-sumed dsRNA viruses in the data set.
Mutual information score
Feature
0.0
0.5
1.0
1.5
2.0
0.0
0.5
1.0
1.5
2.0
0.0
0.5
1.0
1.5
2.0
0.0
0
.5
1.0
1
.5
2.0
0.0
0
.5
1.0
1
.5
2.0
0.0
0
.5
1.0
1
.5
2.0
Group I Group II Group III
Group IV Group V Group VI & VII
Pol/Replicase Others Capsid/Gag Others Non-structural genes Structural genes
Pol/Replicase Others Capsid/Gag Others Non-structural genes Structural genes
Pol/Replicase Others Capsid/Gag Others Non-structural genes Structural genes
Pol/Replicase Others Capsid/Gag Others Non-structural genes Structural genes
Pol/Replicase Others Capsid/Gag Others Non-structural genes Structural genes Pol/Replicase Others Capsid/Gag Others
Non-structural genes Structural genes
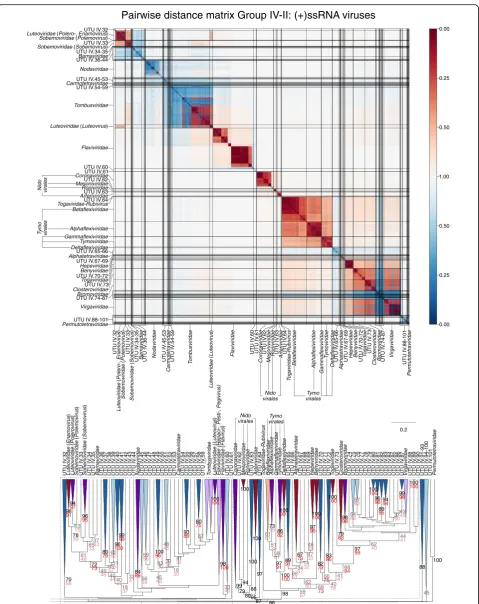
A very large number of newly described viruses grouped with members of thePicornaviralesand related viruses and their addition both expanded this order and changed inter-family relationships of currently classified viruses within it (Fig. 7; Table 2; Additional file 12: Figure S18). As described above, both GRAViTy and RdRp phylogenies did not fully resolve existing viruses into the families to which they are assigned (Iflaviridae,
Polycipriviridaeand Picornaviridae), and the addition of
further metagenomically derived viruses created several new groups and additions to existing families, often though at the expense of decreasing the resolution of their groupings (Fig. 7, lower panel). Elsewhere, a re-markable number of new groupings might be assigned family status on further analysis (UTU IV.1–UTU IV.101; Figs. 7 and 8; Additional file 12: Figure S18; Additional file7: Table S7).
The metagenomic datasets further contained over 80 genome sequences showing closest links to group V (Fig. 9; Table 2; Additional file 12: Figure S19) and represent presumed negative-stranded RNA viruses. Of these, a large number grouped with species of
Rhabdoviridae (Fig. 9) while others formed a total of
16 separate UTUs with variable bootstrap support (Fig.9, lower panel).
Discussion
Virus classification methods
GRAViTy provides the means to perform large-scale, multiple sequence alignment-free analysis of genetic re-lationships between virus datasets. The analysis pre-sented in the current study (Figs. 1 and 2; Additional files 9 and 10: Figures S1–S12) provides evi-dence for large-scale consistency between genomic fea-tures and existing taxonomy assignments across Baltimore groups and between viruses ranging in size from 2700 bases to > 2.5 million bps. It can additionally reliably identify and assign known viruses to their correct families and reliably not assign viruses that are not in the training set, analogous to novel viruses (Table 1). The close linkage between traditional family assignments and their genomic features can therefore be exploited at least as an initial guide to the classifi-cation of larger datasets of viral sequences obtained from metagenomic studies using their sequences
Taxonomic
alone. Furthermore, because it is operating in the same overall framework as that reproduced the exist-ing classification of eukaryotic viruses, its predictions can be represented as an extension of the ICTV tax-onomy by the same assignment rules. It is, in effect, expanding what was originally a disease- and virion morphology-based classification of viruses into one that can incorporate viruses where such phenotypic information may never be obtained.
The use of PPHMMs for all coding sequences within a viral genome and collection of other information on its organisation to construct metrics of relatedness provides a holistic assessment of overall virus relatedness. It there-fore avoids, at least in part, potentially unrepresentative assignments of viruses with mosaic genomes in which in-dividual gene phylogenies may be misleading. It further avoids the need for pre-alignment of, often highly diver-gent, (multiple) sequences to construct evolutionary
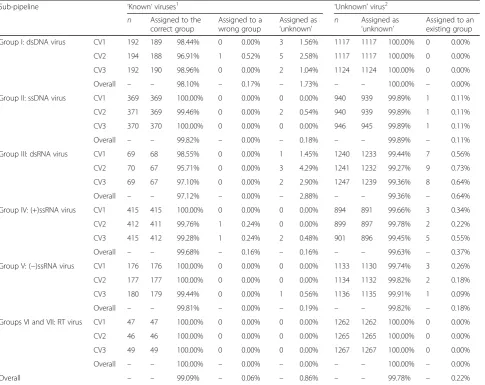
trees or calculate pairwise distances—these require mak-ing many assumptions and are potentially distorted through the inclusion of often non-homologous gene re-gions. The use of whole genome data by GRAViTy simi-larly avoids the need to pre-suppose which individual genes are informative for classification and which ones are not. There is the additional practical issue that, while GRAViTy can rapidly establish similarity metrics across an entire virus reference dataset, the alternative of mul-tiple sequence alignment-based evolutionary reconstruc-tions is intrinsically subjective in gene and regions selected and produces results that can be problematic to interpret on an automated platform. The requirement of GRAViTy for (near-) complete genome sequences has the converse effect of restricting its use for virus assign-ments where such coverage is available. This highlights the difference between virusassignments, in which new taxa may be characterised and assigned genomically Table 1Performance of GRAViTy as evaluated by threefold cross-validation analysis
Sub-pipeline ‘Known’viruses1 ‘Unknown’virus2
n Assigned to the correct group
Assigned to a wrong group
Assigned as
‘unknown’ n
Assigned as
‘unknown’
Assigned to an existing group
Group I: dsDNA virus CV1 192 189 98.44% 0 0.00% 3 1.56% 1117 1117 100.00% 0 0.00%
CV2 194 188 96.91% 1 0.52% 5 2.58% 1117 1117 100.00% 0 0.00%
CV3 192 190 98.96% 0 0.00% 2 1.04% 1124 1124 100.00% 0 0.00%
Overall – – 98.10% – 0.17% – 1.73% – – 100.00% – 0.00%
Group II: ssDNA virus CV1 369 369 100.00% 0 0.00% 0 0.00% 940 939 99.89% 1 0.11%
CV2 371 369 99.46% 0 0.00% 2 0.54% 940 939 99.89% 1 0.11%
CV3 370 370 100.00% 0 0.00% 0 0.00% 946 945 99.89% 1 0.11%
Overall – – 99.82% – 0.00% – 0.18% – – 99.89% – 0.11%
Group III: dsRNA virus CV1 69 68 98.55% 0 0.00% 1 1.45% 1240 1233 99.44% 7 0.56%
CV2 70 67 95.71% 0 0.00% 3 4.29% 1241 1232 99.27% 9 0.73%
CV3 69 67 97.10% 0 0.00% 2 2.90% 1247 1239 99.36% 8 0.64%
Overall – – 97.12% – 0.00% – 2.88% – – 99.36% – 0.64%
Group IV: (+)ssRNA virus CV1 415 415 100.00% 0 0.00% 0 0.00% 894 891 99.66% 3 0.34%
CV2 412 411 99.76% 1 0.24% 0 0.00% 899 897 99.78% 2 0.22%
CV3 415 412 99.28% 1 0.24% 2 0.48% 901 896 99.45% 5 0.55%
Overall – – 99.68% – 0.16% – 0.16% – – 99.63% – 0.37%
Group V: (−)ssRNA virus CV1 176 176 100.00% 0 0.00% 0 0.00% 1133 1130 99.74% 3 0.26%
CV2 177 177 100.00% 0 0.00% 0 0.00% 1134 1132 99.82% 2 0.18%
CV3 180 179 99.44% 0 0.00% 1 0.56% 1136 1135 99.91% 1 0.09%
Overall – – 99.81% – 0.00% – 0.19% – – 99.82% – 0.18%
Groups VI and VII: RT virus CV1 47 47 100.00% 0 0.00% 0 0.00% 1262 1262 100.00% 0 0.00%
CV2 46 46 100.00% 0 0.00% 0 0.00% 1265 1265 100.00% 0 0.00%
CV3 49 49 100.00% 0 0.00% 0 0.00% 1267 1267 100.00% 0 0.00%
Overall – – 100.00% – 0.00% – 0.00% – – 100.00% – 0.00%
Overall – – 99.09% – 0.06% – 0.86% – – 99.78% – 0.22%
1
Known in the sense that members of the family were in the reference dataset and that viruses in the same family in the test dataset should be classifiable 2
using methods such as GRAViTy, and virus identifica-tion. For the latter, high-throughput methods such as BLASTn or BLASTx are more suitable large-scale virus identification of shorter, unassembled sequences that might typically be present in raw sequence data in the metagenomic dataset.
As a final methodological point, virus relationships in the current study have been displayed as dendrograms and as heat maps, in which the multi-parameter relationships between viruses are condensed into a single CGJ distance. However, these data presentations are a simplification of actual virus relationships since equivalent CGJ distances between one sequence and its neighbours may be based upon quite different profiles and sequence features. An alternative methodological approach would be to use bipartite networks [29, 30]. Unlike a typical ‘monopartite’ network which only encodes the degree of overall (dis)similarity among viruses, a bipartite network does not summarise virus similarity into a single number, but retains information about which genes viruses possess, and thus allows shared genes and/or horizontal gene transfers to be readily identified. These multi-dimensional relation-ships provide a fuller account of both genetic relatedness and the existence of modularity of different gene blocks in virus evolution [30,31].
Pragmatically, however, GRAViTy was able to repro-duce taxonomy relationships quite effectively despite potential problems of mosaic genomes (Table 1). This ‘monopartite’ approach was similarly successful in analysing sequence relationships among prokaryotic viruses using a clustering algorithm based on shared
gene profiles [32]. In this latter study, viral clusters showed a reasonable match to their genus assignments (75% concordance). As the authors discussed, this comparative exercise was, however, hampered by the incomplete nature of phage taxonomy, the under-sampling of many existing taxa and a potentially greater degree of gene exchange in many groups of phage that distorts simpler metrics of virus related-ness. A methodological comparison with GRAViTy would be of considerable value in evaluating the effectiveness of these two related methodological approaches.
Virus evolution and taxonomy
As in other areas of biology, virus classification strives to reproduce natural divisions that match evolutionary histories and degrees of genetic relatedness. In pursuing this for virus taxonomy, there is the necessary caveat that different types of virus may not share a common evolutionary origin that is separate from their hosts. A complete taxonomy of viruses is therefore always going to be an assemblage of several groups that are unre-lated or not detectably reunre-lated to each other, quite different from the monophyletic domains of eubacteria, archaea and eukaryotes and their ultimate hypothesised last common universal ancestor [33–35]. In general, the base-level groups identified by GRAViTy corresponded closely to those established by other means. To take the example of dsDNA viruses, it assigned viruses into five groups between which sequence similarity could not be detected. These groups were large DNA viruses (including NCLDVs), adenoviruses, Sputnik viruses
(Lavidaviridae), Polydnaviridae and a grouping of
polyomaviruses and papillomaviruses, the latter linked through possession of homologous early proteins. In group II, relatedness through possession of a commonRep
gene allowed most ssDNA circular viruses to be grouped together, leaving only parvoviruses and anelloviruses as separate groups, again consistent with virus relationships established by other means.
All RNA viruses and reverse transcribing viruses in Baltimore groups III–VII possess structurally homolo-gous ‘right-handed’group I viral RNA polymerases and reverse transcriptases and may therefore potentially (See figure on previous page.)
Fig. 5Genome relationships of metagenomic-derived viruses in Baltimore group II. Pairwise distance matrices (upper panel) and dendrogram (lower panel) for ssDNA viruses classified by ICTV (red) and newly described, currently unclassified viruses (blue). Novel taxa predicted by GRAViTy are labelled as unassigned taxonomy units (UTU) and numbered sequentially. Bootstrap clade support values (≥30%) are shown on the branches. Those in black (≥70%) and grey (< 70%) were calculated for the entire dendrograms. Several clades were re-bootstrapped with pruned signature tables (dotted boxes), and the re-bootstrap clade support values are shown in red (≥70%) or pink (< 70%). The shading of clades depicts the degree of bootstrap support;≥70% dark shading; < 70% light shading. Clades containing both classified and unclassified viruses were shaded in purple
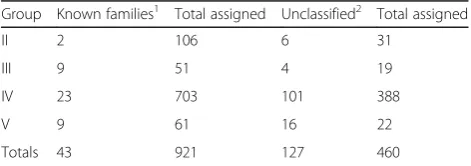
Table 2Taxonomic groups predicted by GRAViTy in metagenomic datasets
Group Known families1 Total assigned Unclassified2 Total assigned
II 2 106 6 31
III 9 51 4 19
IV 23 703 101 388
V 9 61 16 22
Totals 43 921 127 460
1
Number of existing families into which metagenomic sequences fell (total numbers of metagenomic sequences assigned to these are listed in column 3) 2
share a common evolutionary origin for at least their replication module. However, this similarity extends to RNA and DNA polymerases of cellular origins [36], and it is not currently clear at what stage in the origins of viruses this diversification of polymerases occurred. The degree of similarity in viral RNA polymerases is indeed highly restricted and extends typically only to those amino acid sites associated with defined catalytic func-tions with little or no identifiable sequence similarity elsewhere, even for regions of the polymerase that are clearly homologous in protein secondary structure. While it is very clearly possible that all RNA viruses do share a common evolutionary origin, this was not detected by GRAViTy which divided RNA viruses into a large number of separate, apparently unrelated groups (eight in Baltimore group III, four in group IV, three in group V and one in group VI/VII). While the use of PPHMMs to detect protein homologies is widely regarded as an effective and highly sensitive method [37–39], our use of E values < 0.001 and percentage identities of > 30% were relatively conservative and designed to maximise specificity in its detection of distant protein homology [37, 40–42]. The use of lower thresholds may detect more distantly related genes but at the risk of introducing false homologies that would severely distort predicted virus taxonomic relationships.
The detected groupings did, however, correspond to, or incorporate, many of the order assignments in the current ICTV taxonomy, including Tymo-, Nido- and
Bunyavirales and provide a tentative basis for further
groupings of more closely related viruses, such as alpha-like viruses (Fig. 2). Instances where the classifier was unable to reproduce existing order assignments included
theHerpesviralesandPicornavirales. In the former, their
current order assignments are based on their common morphology, with a characteristic appearance of capsid and tegument proteins [12]. Their implied evolutionary relatedness was, however, not apparent on genomic analysis, with little or no detectable structural or non-structural protein sequence homology or com-monality in genome organisational features. Similarly, their polymerase gene phylogeny was paraphyletic (Additional file 11: Figure S15; Additional file 13). Membership of the Picornavirales presents an analo-gous situation, being based upon a particular capsid morphology (pseudo T= 3; [11]) even though the phylogeny of their RdRp and other replicative proteins genes is interspersed with other positive-stranded viruses (such as Caliciviridae which possess structurally distinct virions). In both examples, relatedness in the classifier largely followed phylogeny relationships of genes for replicative proteins.
These observations bring in a wider question of whether the continued use of structure/morphology
based classifications is compatible with the planned classification of viruses in metagenomic datasets that may lack information on these phenotypic attributes. At least in the medium term, virion structure-based taxonomy assignments may become increasingly imprac-tical as knowledge of viral diversity expands through metagenomics approaches, irrespective of the great power of structure-based classification to discern evolu-tionary relationships that lie far beyond the resolution of current genomic sequence-based methods [43–47]. We can predict a similar impasse with the classification of many groups of bacteriophages that are currently primarily morphology-based without the genomics underpinning that would enable metagenomically derived bacteriophages to be added to their taxonomy.
That is not to say that this will always be a restriction. Ongoing improvements in predictive structure-based sequence alignment method and their potentially greater ability to detect homologies in protein structure for genes that possess no detectable primary amino acid sequence similarity may enable these much more distance evolutionary connections at the virion level to be detected [36, 47]. The power of multi-parameter classifications described in the current study and elsewhere [32] is that outputs from improved structure modelling methods can be directly slotted into the processing pipeline and virus relationships re-evaluated within the same overall computational framework. Such methods may greatly expand the depth of phylogenetic trees constructed from CGJ distances and reveal considerably more about their deeper evolutionary relationships, perhaps including those currently apparent by morphology alone [36,43,44,47,48].
reassignment of Diadromus pulchellus ascovirus 4a (DpAV-4a) to the Iridoviridae is likely [49] and supported by GRAViTy. Another major discrepancy was the polyphyletic nature of members of the
Reoviridae, which fell into four separate groups even
though classified into a single family in the ICTV taxonomy [50]. In this case, the phylogeny of the RdRp gene was similarly polyphyletic with members of the family interspersed with those of other dsRNA families. Furthermore, the two sub-families of Reoviridae differ substantially in both genome organisation and in virion morphology, features that would typically lead to the assignments of other dsRNA viruses to separ-ate virus families. Although GRAViTy is only one of many currently available guides to reovirus classifica-tion, its depiction of the substantial diversity of members of this currently assigned family may be of value in a re-evaluation of its ICTV status and comparability with family divisions elsewhere among dsRNA viruses.
Identification of potential new virus families
Having developed and validated the methodology under-lying GRAViTy, we conducted a preliminary analysis of several of the recently published virus metagenomic datasets to investigate its ability to depict relationships at the family and higher levels relative to those of existing taxa. GRAViTy is just one of many tools that may be used in virus classification, and we do not propose any specific taxonomic assignments based on the current analysis; these should be corroborated by methods such as core gene phylogenies and more detailed analyses of assignments of their most closely related viruses by expert groups. However, the results obtained indicate that the method is readily capable of distinguishing between those viruses that might be assigned as further variants within known families from those that cluster separately and are formally assigned as new by GRAViTy (Table2; Additional file7: Table S7).
We have therefore generated a list of potential novel virus groups that might be taken further for investigation and potentially for formal classification by experts in their respective areas of viral taxonomy (Additional file7: Table S7). Sub-groupings of metagenomic-derived viruses within existing families may similarly provide the basis for future genus assignments if cor-roborated by the established criteria used within these families.
Conclusions
The current analysis and taxonomic identifications incorporated sequence information from all of the eukaryotic viruses present in the current ICTV
taxonomy. Analysis of larger datasets of metagenomic-derived sequences creates further PPHMMs that augment the original dataset, and their step-wise incorporation as GRAViTy is used to analyse these wider datasets will therefore increase its powers of identification and taxon prediction. Increasing the dataset size will provide opportunities for re-training as these newer groups become formally incorporated into the ICTV taxonomy.
As described above, eukaryotic viruses represent the best explored and categorised set of viruses for develop-ment of programs such as GRAViTy, but its current abilities are circumscribed to these viruses—it is currently blind to the much larger diversity of bacterial and archaeal viruses that populate marine and other environments. Future comparative evaluation of other approaches to systematic phage and archaeal virus classification, such as vConTACT [32] with bipartite methods and GRAViTy will be helpful in the future development of a combined, comprehensive classifica-tion tool that can take on the vast diversity of the virosphere.
Methods Datasets
Viral genomes and associated information were compiled from (i) the ICTV 2016 Master Species List 31V1.1 (MSL; https://talk.ictvonline.org/files/master-species-lists/); (ii) Virus Metadata Resource (https://talk.ictvon-line.org/taxonomy/vmr/); (iii) newly assigned viruses
from the ICTV Executive Committee meeting,
Singapore, 2017; and (iv) the NCBI virus RefSeq database (https://www.ncbi.nlm.nih.gov/genomes/Gen-omesGroup.cgi?taxid=10239January 2017). Our dataset comprised 3854 whole genomic records of viruses, sampled across 7 Baltimore groups, 12 orders, 103 families, and 472 genera. Taxonomic assignments followed those of the ICTV MSL and an extended list of viruses in the Virus Metadata Resource and Refseq databases.
were 141 GenBank files in total that lack protein annotations (I: 58 records, II: 21 records, III: 22 records, IV: 15 records, V: 24 records, VI and VII: 1 record).
We noted that many of these hypothetical proteins were likely artefacts and not actual virus proteins. Indeed, the majority of the predicted sequences were very short, < 10 amino acids long, necessitating a length filter to exclude these from downstream analyses. This filter was also applied to the annotated virus proteins to maintain the consistency and to minimise false-positive similarity detection. To determine an appropriate thresh-old value, sensitivity (retention of annotated genes) and specificity (exclusion of non-annotated genes) was compared for different minimum protein lengths in several example sequences. Measurable loss of annotated virus proteins (~ 1%) was observed when using a length threshold of 50 amino acids, but this also led to the inclu-sion of between 50 and 80% of non-annotated, likely arte-factual, gene predictions in each viral genome sequence. For example, for the human betaherpesvirus 6A (Acces-sion number: X83413), we would have retained all anno-tated genes at the 50 amino acid cut-off, but 67% of its predicted proteins, if the virus were not to be annotated, would have been a false positive. The more conservative cut-off at 100 amino acids, which was selected as our length threshold in the protein extraction step, led to 5–10% loss of annotated genes but increased specificity to > 75%.
After the protein sequence extraction, all-versus-all pairwise protein comparisons were then performed by using BLASTp 2.2.28 [51] with default parameters ex-cept for the alignment number, which was specified to 1,000,000 to ensure that all significant hits were re-trieved (see https://www.ncbi.nlm.nih.gov/books/ NBK279684/ for BLASTp default parameter values). Hits withEvalue > 0.001, percentage identity < 30% and query/subject coverage < 75% were discarded. These highly conservative cut-offs were used to ensure that the resultant protein alignments that underpin PPHMMs (see below) will be of high quality.
Protein clusters were subsequently determined based on BLASTp bit scores by using a Markov clustering (MCL) algorithm (MCL 12–135) [52] with default parameters. The MCL algorithm is an unsupervised cluster algorithm based on simulation of random walks through a graph [52]. Herein, a graph refers to a net-work of protein similarity, in which proteins are re-presented as nodes and their pairwise similarity are represented by edges weighted by BLASTp bit scores (seehttps://micans.org/mcl/for more details and default parameter values). If multiple BLASTp hits were returned for a pair of proteins, only the bit score of the best hit was used in the clustering computation. Proteins within each cluster were then aligned by
using MUSCLE [53], with the gap opening and gap extension cost of −3.0 and −0.0, respectively. Finally, PPHMMs were generated from the resultant align-ments using hmmbuild function, implemented in HMMER 3.1b1 (http://hmmer.org/), with default settings.
Genomic organisation model databases
Similar to PPHMM databases, six databases of GOMs were constructed, one for each Baltimore group. Each GOM represents a genomic organisation of a particular taxonomic group; it is a matrix with each row being a list (i.e. a vector) of the locations of protein-coding regions within a particular genome. To locate protein-coding regions within a genome, we six-frame translated the sequence, concatenated them and scanned it against the PPHMM database of its respective Baltimore group using hmmscan function, implemented in HMMER 3.1b1 (http://hmmer.org/) with ‘nobias’ option. Herein, locations of protein-coding regions were defined as the middle of the HMM hits, transformed so that they referred to the locations in the original (translated) sequence. Hits with conditional E values (c-Evalues) > 0.001 and/or with negative hidden Markov model (HMM) scores were discarded. If a PPHMM exhibited significant similarity to multiple regions within the genome, the middle of the best hit was used to define its location. Values of genes’ locations can be either positive or negative depending on which strand the genes were found on. Gene locations with positive values indicate that the coding regions can be read off directly from the input sequence, while negative values mean that the coding regions can be found on the complementary strand. If coding regions could not be detected in the sequence, their locations were set to zero.
Feature annotators
to smallest segments, to form a single genomic represen-tation prior the annorepresen-tation. For circular genomes, there was no need for us to determine a breakpoint to linearise them in this study as all genomes were directly obtained the NCBI database, and they were all already provided in a linear form.
The PPHMM score is used to quantify the presence of protein-coding regions, with zero meaning no significant similarity could be detected. If a PPHMM exhibits significant similarity to multiple regions, an overall score computed across the entire sequence by the program is used. A PPHMM signature of a particular virus is simply a list of similarity scores of its genes to various PPHMMs in the database at the amino acid level. Locations of the detected protein-coding regions (as defined above) are also recorded and used to construct the GOM signature. Each element of a GOM signature is the ‘distance correlation coefficient’ [54] between the locations of query’s protein-coding regions and a GOM. Locations of the genes that are both absent in the query and the GOM were ignored in the distance correlation computation. The value of distance correlation ranges between 0 and 1, and it is unaffected by the choice of the input strand.
Pairwise (dis)similarity measurement between a pair of genomes
Herein, an overall similarity between two genomes is quan-tified by a geometric mean of generalised Jaccard similarity scores, computed for the PPHMM signature (Jp), and the GOM signature (Jo). We term this index‘a composite gen-eralised Jaccard (CGJ) similarity index’, J ¼ ffiffiffiffiffiffiffiffiffiffiffiffiffiffiffiJpJo
p
. A generalised Jaccard similarity index for the PPHMM signa-tureJp, for example, can be computed as follows:
Jpðx;yÞ ¼
P
i minðxi;yiÞ
P
i maxðxi;yiÞ
wherexandyare two genomes, of which the possession of their protein-coding regions is represented by the PPHMM signatures (x1,x2,⋯,xn) and (y1,y2,⋯,yn), respectively. Jo is also defined in the same way. The value of Jranges between 0 and 1, and thus, the overall similarityJ also ranges between 0 and 1. The degree of dissimilarity, i.e. the distance, between two genomes x
and y is simply D(x,y) = 1−J(x,y), also ranges between 0 and 1.
UPGMA dendrogram construction
All dendrograms in this study were constructed from complete pairwise distance matrices, by using the UPGMA algorithm, implemented inlinkage and to_tree
methods available in SciPy python library (http:// www.scipy.org/). Cophenetic correlation [55] was used to measure how well a dendrogram preserved the original pairwise distances. The calculation was per-formed using cophenet method, also available in SciPy
python library.
Dendrogram bootstrapping
The resultant dendrograms were bootstrapped to evalu-ate the robustness of their topology. To bootstrap a dendrogram, we first randomly sampled its underlining PPHMMs with replacement such that the size of the resampled PPHMM database was the same as the original one. Each PPHMM was sampled with equal probability. Virus genomes were then re-annotated, and the GOM database was reconstructed based on the resampled PPHMM database. Subsequently, a complete pairwise distance matric was recomputed in order to build a bootstrapped UPGMA dendrogram sample. The process was repeated 100 times to obtain a distribution of bootstrap dendrograms. We then computed bootstrap support for branches on the best-estimate UPGMA dendrogram by using SumTrees [56] based on the obtained dendrogram distribution.
It is possible that several low bootstrapped support values might be caused by empty profile sampling—i.e. all elements in the bootstrapped signature are zero, containing information pertaining only to genes that are absent from the genome. This can happen with small viruses, such as members ofPapilloma- andPolyomaviridae
in group I and Geminiviridae in group II, which may exhibit similarity to only a small number of PPHMMs.
To investigate this effect, we perform re-bootstrap analyses on several sub-clades in the dendrograms (see Figs. 2, 5, 6, 7, 8 and 9 for clades that were re-bootstrapped). In re-bootstrap analyses, ‘irrelevant’ PPHMMs—i.e. those that none of the viruses in the clade exhibit similarity to—was excluded from the analyses. GOMs of virus families outside the clade were also excluded from the analyses. The same protocol as described above was used in re-bootstrapping.
Classifiers and taxonomic assignment evaluation
Six classifiers were built; each simply computes pairwise CGJ similarities between the virus of interest and all reference (training) viruses and classifies it to the taxonomic group of the reference virus to which it exhibits the highest similarity with (1-nearest neighbour algorithm).
group. The CGJ similarity threshold is group specific. To estimate the threshold for a particular taxonomic group, we built distributions of its inter-group and intra-group CGJ similarity scores (n≤10,000) and computed the score that best separates the two distributions using the support vector machine (SVM) algorithm, with ‘balanced’ class weight option. The SVM algorithm used in this study was implemented in
SVC function, available from Scikit-learn python library [57]. If the observed CGJ similarity is less than the thresh-old, the candidate taxonomic assignment is rejected, and the sample is immediately relabelled as ‘unclassi-fied’; otherwise, the second step of the evaluation will be employed to further evaluate the candidate taxo-nomic assignment.
In the second step, an UPGMA dendrogram containing all reference viruses and the virus of interest is used, and the evaluator will look at its neighbourhood. The taxo-nomic proposal will be accepted if any of the following conditions are met:
i) The sister clade is composed entirely of the members of the proposed candidate taxonomic group
ii) The immediate outgroup is composed entirely of the members of the proposed candidate taxonomic group iii) One of the two basal branches of its sister clade
leading to a clade that is composed entirely of the members of the proposed candidate taxonomic group.
To best estimate the placement of viruses, if multiple viruses are to be analysed at the same time, a dendro-gram containing all viruses of interest will be used. Furthermore, since there are six classifiers, there are possibilities that a virus might be assigned to multiple taxonomic groups by multiple sub-pipelines. In such cases, the finalised taxonomic assignment is the one associated with the highest CGJ similarity score.
Feature importance
Mutual information (MI) is used to determine features that are predictive of current virus taxonomy. MI mea-sures the mutual dependence between two variables, which, in this case, are virus taxonomic assignments and PPHMM scores. A MI score of 0 means that the two variables are independent; otherwise, it has a positive value. The greater the value, the higher the dependency.
mutual_info_classif method, which is available in
Scikit-learn python library [57], was used to estimate
MI scores. This method is stochastic however, and thus, mean values computed from 100 estimates were used in the result interpretation. We also noted that the sample size per taxonomic class can affect the MI score calcula-tion, and the number of viruses can vary greatly from
groups to groups. To take this into account, we sampled at most only two viruses from each taxonomic group in each of the 100 instances of the MI calculation.
Features that are shared by viruses in a particular set of families were also determined through inspection of MI scores. In this case, viruses that belong to the families of interest were relabelled so that they were in the same group, and the rest were in another separate group. Features that were not associated with the investigated families were removed from the analyses. As described above, mean MI values computed from 100 MI estimates were used in the result interpretation, and in each of the 100 instances of the MI calculation, at most only two viruses were sampled from each family.
We also examined whether or not non-structural and structural genes differ in their virus taxonomy predictive power. Features associated with polymerase and replic-ase (non-structural genes: replication) are labelled separ-ately from other non-structural genes (non-structural genes: others), including genes encoding for reductase, kinase, T antigen, protease and helicase, as well as genes with their names containing the word ‘NS’, ‘non(-)struc-tural’,‘replication’ and ‘transcription’. Similarly, features associated with genes coding for viral particle shell proteins, i.e. capsid and gag genes, as well as those with their names containing the word ‘coat’,‘shell’,‘core’ and ‘nucleocapsid’, are labelled separately from other struc-tural genes, including glycoprotein, matrix, tegument and envelop genes, and those with their names con-taining the word ‘surface’,‘membrane’ and ‘structural’ (but not ‘non(-)structural’) (structural genes: Capsid/ Gag and structural genes: others, respectively) (see Additional file5: Table S5 for the values of MI scores).
To classify these viruses, we ran the dataset through the GRAViTy pipeline using the PPHMM and GOM databases constructed from the reference viruses (Additional file 1: Table S1) (see the ‘Classifiers and taxonomic assignment evaluation’section for details).
We also ran the dataset through the GRAViTy pipe-line updated with genes from these unclassified vi-ruses. Genes from viruses that did not pass through the length filter were also included in the updated PPHMM and GOM databases to maximise the power of virus classification. To update the databases, again, it required to know which Baltimore group these unclassified viruses belong to, and this information was derived from the initial taxonomic assignments pro-posed in the original studies. Finally, we manually inspected the heat maps (Figs. 5, 6, 7, 8 and 9) and dendrograms (Additional file 12: Figures S16–S19) depicting relationship of these unclassified viruses to-gether with reference viruses to finalise the taxonomic assignments. Additional file7: Table S7 summarises the results.
Code availability
We wish to emphasise that our primary goal is to propose, investigate and evaluate a sequence-based framework for virus classification, rather than creating a ready-to-be-used bioinformatic tool. Nevertheless, the code and python scripts used in this study are available from GitHub: PAiewsakun/GRAViTy.
Additional files
Additional file 1:Table S1.Viruses used in this study and their associated information. Listing of classified virus sequences used in the analysis. (XLSX 381 kb)
Additional file 2:Table S2.Summary of the virus taxa analysed in this study. Listing of ICTV assigned taxa of the sequences analysed in the study. (DOCX 17 kb)
Additional file 3:Table S3.Summary of protein profile hidden Markov model databases. Complete list and description of PPHMMs assigned from viral genome sequences. (XLSX 1181 kb)
Additional file 4:Table S4.Protein profile hidden Markov models responsible for inter-family relationships. List of PPHMMs that link together different virus families. (DOCX 23 kb)
Additional file 5:Table S5.Mutual information scores. Informativeness of different PPHMMs in the assignment of sequences to ICTV taxa expressed as a mutual information score. (XLSX 538 kb)
Additional file 6:Table S6.Cross-validation analysis. Scoring table for cross-validation analysis used to test specificity and sensitivity of GRAViTy. (XLSX 586 kb)
Additional file 7:Table S7.Classification of viruses from metagenomic data. A full listing of metagenomic sequences analysed by GRAViTy and their provisional assignments. (XLSX 110 kb)
Additional file 8:Table S8.Length thresholds used to identify (near) complete virus sequences in metagenomic datasets. Length thresholds used to exclude partial RNA virus sequences from metagenomic datasets. (XLSX 11 kb)
Additional file 9:Figures S1–S6.Heat maps of CGJ distances of classified viruses in Baltimore groups I–V and VI/VII. Versions of the summary heat maps shown in Fig.1with annotations for families and orders. (ZIP 2051 kb)
Additional file 10:Figures S7–S12.Dendrograms of individual virus sequences of classified viruses in Baltimore groups I–V and VI/VII. Full dendrograms that correspond to the collapsed dendrograms shown in Fig.2.
(ZIP 425 kb)
Additional file 11:Figures S13–S15.Phylogenetic trees of classified virus groups. Analysis of phylogeny relationships of viruses whose classification by GRAViTy conflicts with their ICTV assignments. (DOCX 825 kb)
Additional file 12:Figures S16–S19.Dendrograms of individual virus sequences of classified and metagenomic viruses in Baltimore groups II, III, IVa and IVb. Full dendrograms that correspond to the collapsed dendrograms shown in Figs.5,6,7,8and9(lower panels). (ZIP 417 kb)
Additional file 13:Analysis of GRAViTy groupings that conflict with ITCV family assignments. Analysis of sequences whose assignment by GRAViTy conflicts with their ICTV classification. (PDF 59 kb)
Abbreviations
CGJ:Composite generalised Jaccard; GOM: Genome organisation
model; GRAViTy: Genome relationships applied to virus taxonomy; HTS: High-throughput sequencing; ICTV: International Committee on Taxonomy of Viruses; MI: Mutual information; MSL: Master Species List; PPHMM: Protein profile hidden Markov model; RdRp: RNA-dependent RNA polymerase; UTU: Unassigned taxonomy unit
Acknowledgements
The authors would like to thank the members of the ICTV Executive Committee for the valuable discussion of classification challenges and the need for bioinformatic solutions.
Funding
This project was funded by a Wellcome Trust Bioresource Grant (WT108418AIA).
Availability of data and materials
The principal datasets of numerical data are provided in an extensive set of supplementary data files (Additional file1: Table S1; Additional file2: Table S2; Additional file3: Table S3; Additional file4: Table S4; Additional file5: Table S5; Additional file6: Table S6; and Additional file7: Table S7). All other lower level data is available from PA on request.
Authors’contributions
PS originated the project and the strategic approach towards genomic-based virus family-level classification. PA developed the programming and the implementation of GRAViTy, data curation and analysis. PS and PA both contributed to the development and refinement of the analysis and its evaluation and application to metagenomic sequences. PS and PA co-wrote the manuscript and designed the figures. Both authors read and approved the final manuscript.
Ethics approval Not applicable
Consent for publication Not applicable
Competing interests
Both authors declare that they have no competing interests.
Publisher’s Note