Open Access
R E S E A R C H A R T I C L E
© 2010 Lu et al; licensee BioMed Central Ltd. This is an Open Access article distributed under the terms of the Creative Commons Attri-bution License (http://creativecommons.org/licenses/by/2.0), which permits unrestricted use, distriAttri-bution, and reproduction in any medium, provided the original work is properly cited.
Research article
An algorithm for classifying tumors based on
genomic aberrations and selecting representative
tumor models
Xin Lu*
1, Ke Zhang
2, Charles Van Sant
3, John Coon
4and Dimitri Semizarov*
1Abstract
Background: Cancer is a heterogeneous disease caused by genomic aberrations and characterized by significant variability in clinical outcomes and response to therapies. Several subtypes of common cancers have been identified based on alterations of individual cancer genes, such as HER2, EGFR, and others. However, cancer is a complex disease driven by the interaction of multiple genes, so the copy number status of individual genes is not sufficient to define cancer subtypes and predict responses to treatments. A classification based on genome-wide copy number patterns would be better suited for this purpose.
Method: To develop a more comprehensive cancer taxonomy based on genome-wide patterns of copy number abnormalities, we designed an unsupervised classification algorithm that identifies genomic subgroups of tumors. This algorithm is based on a modified genomic Non-negative Matrix Factorization (gNMF) algorithm and includes several additional components, namely a pilot hierarchical clustering procedure to determine the number of clusters, a multiple random initiation scheme, a new stop criterion for the core gNMF, as well as a 10-fold cross-validation stability test for quality assessment.
Result: We applied our algorithm to identify genomic subgroups of three major cancer types: non-small cell lung carcinoma (NSCLC), colorectal cancer (CRC), and malignant melanoma. High-density SNP array datasets for patient tumors and established cell lines were used to define genomic subclasses of the diseases and identify cell lines representative of each genomic subtype. The algorithm was compared with several traditional clustering methods and showed improved performance. To validate our genomic taxonomy of NSCLC, we correlated the genomic classification with disease outcomes. Overall survival time and time to recurrence were shown to differ significantly between the genomic subtypes.
Conclusions: We developed an algorithm for cancer classification based on genome-wide patterns of copy number aberrations and demonstrated its superiority to existing clustering methods. The algorithm was applied to define genomic subgroups of three cancer types and identify cell lines representative of these subgroups. Our data enabled the assembly of representative cell line panels for testing drug candidates.
Background
Cancer is a disease of the genome that is characterized by substantial variability in the clinical course, outcome, and response to therapies. A key factor underlying this vari-ability is the genomic heterogeneity of human tumors: individual tumors of the same histopathological subtype
and anatomical origin typically carry different aberra-tions in their cellular DNA. Many of the most efficacious recent drugs target specific genetic aberrations rather than histological disease subtypes, for example trastu-zumab and lapatinib for treating HER2-positive breast cancers [1], tamoxifen for treating ER-positive breast can-cers[2,3], and gefitinib and erlotinib for non-small cell lung cancer with EGFR mutations [4-8].
Several subtypes of common cancers have been identi-fied based on the aberrations of individual cancer genes,
* Correspondence: [email protected], [email protected]
Global Pharmaceutical Research and Development, Abbott Laboratories, 100 Abbott Park Road, Building AP-10, Dep. R4CD, Abbott Park, IL 60064, USA
for example HER2-amplified breast cancer [1,9,10], EGFR-mutated and EGFR-amplified non-small-cell lung cancer [5,8], and others. However, cancer is a complex disease driven by the interaction of multiple genes and pathways [11,12]. Therefore, the copy number status of individual genes may not be sufficient to define cancer subtypes and predict the response to treatments. More comprehensive cancer taxonomy needs to be designed based on genome-wide patterns of DNA copy number abnormalities.
Previous ground-breaking studies have reported molecular classifications for key cancer types based on their global patterns of gene expression [13-16]. As the high-density array technology became a reliable tool for copy number profiling, multiple gene copy number data-sets were generated, revealing the genomic heterogeneity of key cancer types at the gene copy number level [17]. Various clustering methodologies have been applied to comparative genomic hybridization (CGH) data sets to classify cancers based on their copy number patterns and identify copy number aberration hotspots [17-23]. Tax-onomies based on gene copy number have a number of advantages over gene expression-based classifications. In particular, copy number alterations are stable events, not affected by cell cycle or cytokine stimulation. Addition-ally, they show greater consistency between primary human tumors and cultured cell lines.
Here we developed a copy number-based methodology for cancer classification in order to enable identification of genomic subgroups of major cancer types and facilitate rational selection of tumor models representative of indi-vidual subgroups. The methodology is based on the pre-viously published genomic non-negative matrix factorization (gNMF) algorithm [23-26], with several major modifications to enhance the performance. We applied the algorithm to three major tumor types: non-small cell lung carcinoma (NSCLC), colorectal carcinoma (CRC), and malignant melanoma, identified distinct genomic subtypes for each cancer, and identified cell lines representative of each subtype. Our data enabled the assembly of representative cell line panels for testing drug candidates.
Methods
Development of a tumor classification methodology based on genome-wide copy number profiles
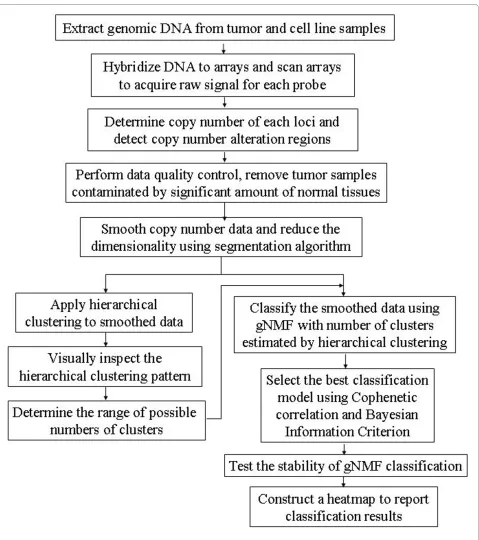
The overall flow of our tumor classification methodology is illustrated in Fig. 1. After data pre-processing, a sample quality control procedure was applied to eliminate con-taminated samples. For the remaining samples, a pilot hierarchical clustering was first applied to the segment smoothed tumor and cell line CGH data to determine the range of possible numbers of clusters, because the num-ber of clusters needs to be fed into the gNMF algorithm,
but is usually unknown for a given data set. The modified gNMF algorithm was then applied to the same set of seg-ment smoothed CGH data to classify it into the initial numbers of clusters suggested by the hierarchical cluster-ing. Using divergence as a stopping criterion and averag-ing results over multiple initiations, this modification significantly improved the accuracy of clustering at the cost of a higher computational complexity.
To determine the best of the models built by gNMF algorithm with different numbers of clusters, we calcu-lated the Cophenetic correlation coefficient and Bayesian Information Criterion (BIC) for these models, and then selected the one with the minimum BIC or the greatest decrease of Cophenetic correlation. In our study, the minimum BIC and greatest decrease of Cophenetic cor-relation often pointed to the same model. Finally, the 10-fold stability test was performed on the selected model. Thus, the iteration procedure converges to the best solu-tion, and the optimal model is identified. The entire methodology was implemented using the R language http://cran.r-project.org/. The source code is available from the authors.
Copy number profiling and primary data processing
The use of human tumor specimens collected at Rush University was approved by the Rush Institutional Review Board. Additional human tumor specimens were obtained from tissue banks (Caprion Proteomics, Mon-treal, Canada; ProteoGenex, Culver City, CA; Asterand, Detroit, MI; Genomics Collaborative, Inc, Cambridge, MA; and Ontario Tumor Bank, Toronto, Ontario, Can-ada), and the use was approved by the vendors. Written informed consent was obtained from all the individuals. Genomic DNA was extracted from tumor samples and cell lines using a DNAeasy kit (Qiagen, Valencia, CA). The DNA samples were then processed and hybridized to Affymetrix GeneChip Mapping arrays (Affymetrix, Santa Clara, CA, http://www.affymetrix.com). The arrays were run according to the manufacturer's protocol and scanned using a GeneChip Scanner 3000 G7 (Affymetrix, Santa Clara, CA). The Affymetrix GeneChip® Operating
Software (GCOS) collected and extracted feature data from the scanner.
data were then segmented, and the copy number altera-tion regions were detected for each sample. Specifically, probe-level copy numbers were segmented into regions using the following control parameters: (i) a region must contain at least 100 probes, (ii) the p-value comparing the mean copy number of the region versus the adjacent
regions must be less than 0.00001, and (iii) the signal/ noise ratio of the transition must be greater than 0.1. The copy number alteration regions were detected when the mean copy numbers in these regions were lower than 1.65 (deletion) or higher than 2.65 (gain), with P values below 0.01.
Data quality control
Tumor samples may contain a significant percentage of normal adjacent tissue, which will dilute the signal of copy number alteration and result in false negatives. Therefore, we developed a machine learning algorithm to distinguish between copy number patterns of tumor and normal samples and applied it to identify and eliminate samples contaminated with normal tissue from further analyses. We first selected a subset of samples with the highest number of copy number alteration regions and a set of normal samples. These two groups of samples were used as a training set to train a Random Forest (RF) [27] classifier to classify tumors from normal samples. The trained classifier was then applied to all incoming tumor samples to assign a score to each of them representing the probability of being contaminated by normal tissue. Sam-ples with normal contamination probability over 50% were excluded from our clustering analysis.
Pilot hierarchical clustering to determine the possible number of subgroups
Although broadly used for clustering of gene expression and copy number patterns, hierarchical clustering is highly sensitive to the distance metrics and typically requires subjective evaluation to define clusters [26]. Nevertheless, this method provides an easy and intuitive way to visualize the overall pattern of the data. The gNMF algorithm requires the number of clusters as input parameter, which is usually unknown for a given data set. In previous applications of gNMF to cluster CGH data, several numbers of clusters were tested, but without an intuitive method to determine these initial numbers [17,23]. We used hierarchical clustering as a pilot to esti-mate the range of the possible numbers of clusters that exist in the data before applying the gNMF algorithm.
For each data set, we hierarchically clustered the seg-mented CGH data using Pearson dissimilarity (defined as 1 minus Pearson correlation coefficient). The hierarchical clustering patterns were plotted and visually inspected to derive a range of possible numbers of subgroups in the dataset. These numbers were then used as input in the gNMF clustering analysis.
The modified genomic non-negative matrix factorization (gNMF) clustering algorithm
Non-negative matrix factorization (NMF) was first sug-gested by Paatero et al [28]. Like principal component analysis (PCA) or independent component analysis (ICA, [18]), NMF is a linear decomposition algorithm which decomposes a data matrix into a factor matrix and a weight matrix with limited dimensions. However, NMF adds a unique constraint that the factor matrix and weight matrix have only non-negative entries. This fea-ture makes NMF particularly useful in the analysis of
pos-itive-value data, such as images, gene expression levels or gene copy numbers. This mathematical tool was further developed by Lee et al. and applied in image analyses [24,25], and then in the analysis of gene expression data [26] and genomic copy number data [17,23].
Given an n × m matrix V of smoothed copy number data for a set of samples, where n is the number of
seg-ments and m is the number of samples, the NMF
algo-rithm factorizes the matrix V into an n × r matrix W and a r × m matrix H:
Here W can be viewed as the standard model for each
subgroup; H as the relative weights of each sample
belonging to each subgroup; e represents the model fit-ting residues, and r is the dimension of decomposition (usually much smaller than m). Given r and V as input, the gNMF algorithm first randomly sets the initial value of W and H, and then iteratively updates W and H using the multiplicative update rules:
Where α runs from 1 to r, μ runs from 1 to m, and i
runs from 1 to n.
Because of the positive constraint of the NMF algo-rithm, the result can easily be adapted for clustering pur-poses by assigning each sample into the cluster (component) that has the maximum weight. Alterna-tively, under a multiple-run scheme (discussed below), the average correlation of H matrix of multiple runs can be used to assign samples into clusters. Therefore, gNMF can also serve as a tool for unsupervised clustering.
Here we introduced several modifications to the gNMF algorithm. In previous applications of gNMF to cluster CGH data, the algorithm was stopped when the subgroup assignments of samples did not change after a pre-defined number of steps (e.g. 100) [17,23]. Based on our tests with simulated data as well as actual CGH data, we determined that this criterion might stop the procedure too early, suggesting that the results could potentially be further improved if the algorithm were allowed to run more steps. Therefore, we modified the algorithm so that after every 100 steps of multiplicative updating the diver-gence [25] of the current model from the data was calcu-lated, and the iterative algorithm was stopped if the
V =W*H+e.
H H
Wi Vi WH i i
Wk k
H H
H Vi WH i
H v v
i i
am am
a a
a m m
a
am m m
divergence did not decrease by more than 0.001% of the previous divergence calculated 100 steps earlier.
Since gNMF is a stochastic procedure, the algorithm may generate different outcomes when started from dif-ferent initial values. To further improve the performance of gNMF, we implemented a new multiple initiation strat-egy. For each data set, we ran the gNMF algorithm 200 times following the above stop criterion, calculated the Pearson correlation coefficient matrix of H from the out-put of each of the 200 random gNMF runs, and averaged the correlation matrices over the 200 runs. The final tering result was derived by running a hierarchical clus-tering algorithm using one minus the average correlation matrix as the distance matrix and cutting the dendro-gram into the given number of subgroups.
Model selection using Bayesian Information Criterion and Cophenetic correlation
The core gNMF algorithm was run with different num-bers of clusters, r, as suggested by the pilot hierarchical clustering. After that, to select the best model, we calcu-lated the Cophenetic correlation coefficient and Bayesian information criterion (BIC) for these models, and then selected the one with the minimum BIC or the greatest decrease in Cophenetic correlation.
The Cophenetic correlation coefficient [29] is a mea-sure of how faithfully a dendrogram that is used to derive the final clustering result preserves the pairwise distances between the original unmodeled data points. Suppose the original data Xi have been modeled by a dendrogram Ti. Distance measures are defined as follows:
x(i, j) = |Xi - Xj|, the distance between the ith and jth
sam-ples.
t(i, j) = the dendrogrammatic distance between the model points Ti and Tj. This distance is the height of the node at which these two points are first joined together.
Then, if x is the average of x(i, j), and t is the average of
t(i, j), the Cophenetic correlation coefficient c is defined as follows:
The Cophenetic correlation coefficient has been used to select the best model built by the gNMF algorithm in previous applications [17,23], and it has been reported that with the increase of r, the Cophenetic correlation will decrease dramatically at certain point which suggests the best number of clusters.
The Bayesian Information Criterion (BIC) [30] is also widely used in statistical applications for model selection purposes. BIC is defined as follows:
where L is the likelihood which measures how good the model approximate the data, k is the number of parame-ters used in the model, and n is the number of samples. The second term, kln(n), serves as a penalty on the num-ber of parameters used in the model to avoid overfitting. A lower BIC value usually represents a good model with relatively higher likelihood and also relatively lower risk of overfitting.
Lognormal distribution is widely used to fit DNA copy numbers [31]. To calculate the likelihood, we assume samples in each cluster come from the same multi-log-normal distribution where the mean copy number of each segment follows a lognormal distribution. The correla-tion between segments was weak, so independence was assumed between segments in the calculation. The resulting log-likelihood was
where r is the number of clusters, ni is the number of samples in cluster i, and m is the number of segments, yijt
is the log transformed copy number of the tth segment of
the jth sample in the ith cluster, μ
it is the average of log transformed copy numbers of the tth segment in the ith
cluster, and σit is the standard deviation of log trans-formed copy numbers of the tth segment in the ith cluster.
Then the number of parameters, k, in the specified model would be 2 × r × m.
In our studies, the minimum BIC and greatest decrease of Cophenetic correlation often pointed to the same model.
10-fold cross-validation test of clustering stability
A 10-fold cross-validation test was used to assess the sta-bility of clustering results. After assigning samples into subgroups, we randomly left 10% of samples out and applied the same procedure to the remaining 90% of sam-ples using the same control parameters. The number of samples that were assigned to a different subgroup was counted as errors. This test was repeated 200 times to derive an error rate, which represented the stability of the clustering result with respect to the permutation of sam-ples.
c
x i j x t i j t i j
x i j x i j
t i j t i j = − − < ∑ − < ∑ − < ( ( , ) )( ( , ) )
[ ( ( , ) ) ][2 ∑∑ ( ( , ) )2]
BIC= −2 * lnL+kln( ),n
Results
Classification of NSCLC tumors and cell lines
We applied the gNMF-based classification methodology above to a dataset for 245 NSCLC tumors and 57 NSCLC cell lines that contained both internally generated and
public Affymetrix Human GeneChip® Mapping 100K
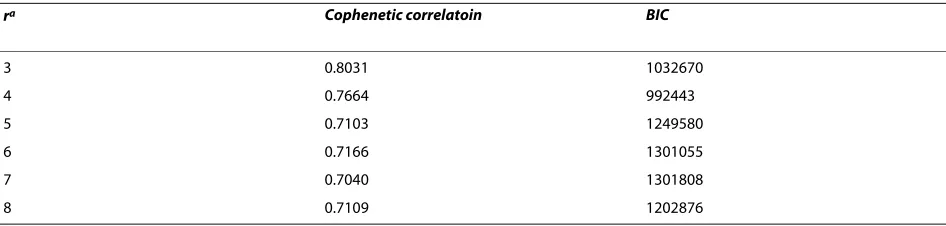
array data [32]. The Affymetrix 100K array measures the copy number of > 100,000 Single-nucleotide polymor-phism (SNP) loci covering the entire human genome with an average distance between SNPs of 23.6 kb. The initial processing yielded 11,419 copy number segments, and no sample was detected to be contaminated by normal tis-sue. Dimension reduction resulted in 8,172 segments for the 302 samples. Pilot hierarchical clustering of the seg-ments (Additional file 1Fig. S1) suggested the existence of 3-8 major clusters in the data. The 302 tumors and cell lines were then clustered using the gNMF algorithm with cluster numbers 3-8, and the Cophenetic correlations and BICs for these gNMF models were calculated (Table 1). The model with four clusters had the minimum BIC, and between four and five clusters the Cophenetic correlation had the greatest decrease. Therefore, the four-cluster model was chosen for the NSCLC data set. The heatmap of the four-cluster model is shown in Fig. 2. The cell lines selected to represent each subtype of NSCLC are listed in Table 2. They can serve as disease models for the respec-tive subtypes of NSCLC.
Biological significance of the NSCLC classification
Thus, we identified genomic subgroups of NSCLC using the unsupervised clustering methodology above and selected representative cell lines for each subtype. How-ever, the biological significance of the subgroups of NSCLC was still unclear. One way to determine the phe-notypical relevance of a classification is to test the differ-ence in the clinical outcome of patients assigned into the subgroups.
Among the 245 NSCLC tumor samples used to identify subtypes of NSCLC, clinical outcome information (over-all survival: OS; time to recurrence: TTR) was available for a subset of 111 samples. The numbers of
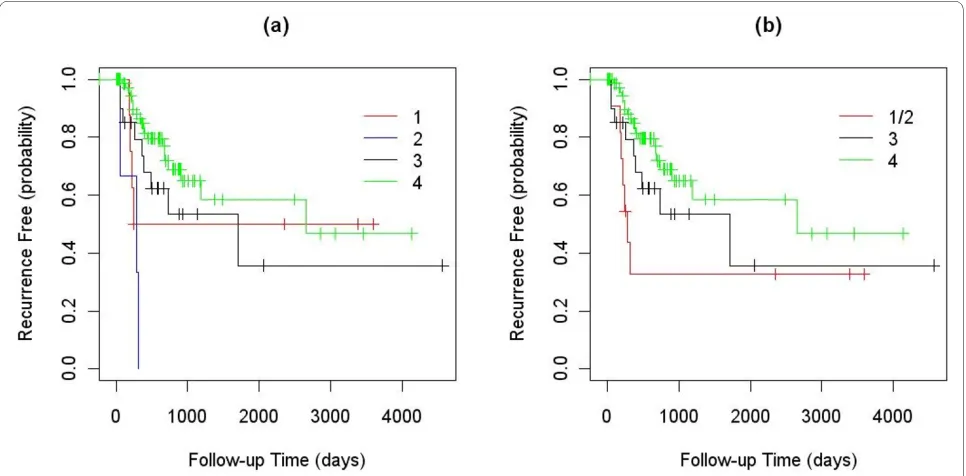
outcome-annotated samples in clusters 1, 2, 3, and 4 were 9, 3, 21 and 78, respectively. The logrank test showed that the TTRs of the four clusters were significantly different with a P-value of 0.001. The median TTRs for the four groups were 1918, 281, 1710 and 2657 days. Since there were only three clinically annotated samples in cluster 2, we re-ran this analysis after combining the samples in clusters 1 and 2. The combined samples also had a significantly lower TTR than those in the other two clusters (P-value 0.040), with the median TTR of 281 days. The Kaplan-Meier curves for these analyses are shown in Fig. 3.
To further validate the ability of our algorithm to clas-sify tumors into biologically relevant genomic groups, an independent set of 71 NSCLC tumor samples was pro-filed for copy number alterations, and the data were seg-mented. These validation samples were then matched to the four NSCLC clusters.
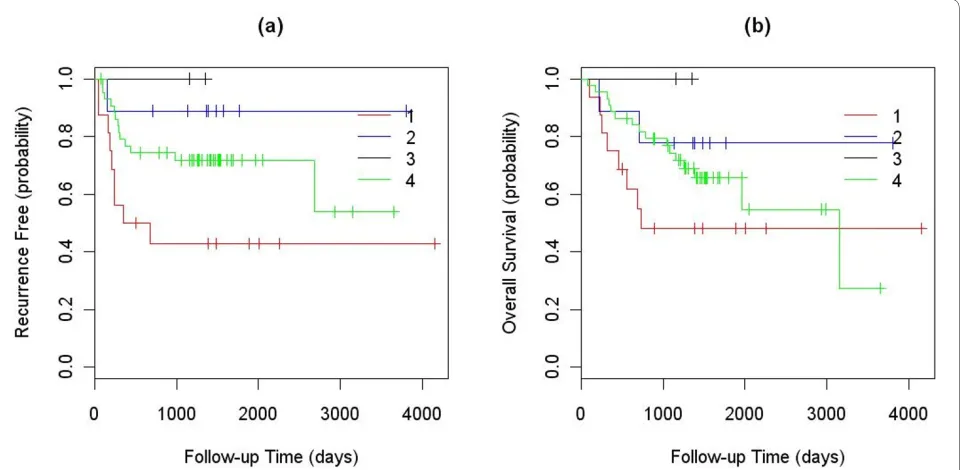
First, all tumors and cell lines in our defined clusters were used to represent the clusters. We calculated Pear-son correlation coefficients between the validation sam-ples and each of the cell lines and tumors in the four clusters. The validation samples were then assigned to the cluster that contained the best matched representa-tive cell line or tumor based on the correlation coeffi-cients. Finally, the differences in TTR and OS of the validation samples assigned into different clusters were analyzed using a logrank test, and their Kaplan-Meier curves were plotted (Fig. 4). In this analysis, both TTR and OS showed significant differences between the four clusters with P-values of 4.7E-5 and 0.002, respectively. The median TTRs of the validation samples assigned to the first and third clusters were 246 and 2679 days, and that for second and forth clusters were not reached (less than 50% of the patients in the second and forth clusters have recurrence in the study). The median OS value of the validation samples assigned to the first and fourth clusters were 464 and 3147 days, and that for the second and third clusters were not reached. Samples assigned to cluster 1 had a significantly lower TTR and OS than sam-ples assigned to other clusters (Fig. 4).
Table 1: Cophenetic correlation and BIC of the NSCLC gNMF models under different cluster numbers.
ra Cophenetic correlatoin BIC
3 0.8031 1032670
4 0.7664 992443
5 0.7103 1249580
6 0.7166 1301055
7 0.7040 1301808
8 0.7109 1202876
Additionally, to test the cell line panel assembled, we used only cell lines to represent the first three clusters, while assigning the validation samples into clusters using the highest Pearson correlation coefficient criterion. Since the fourth cluster did not contain any cell lines, all tumor samples in the cluster were used to calculate Pear-son correlation coefficients and assign validation sam-ples. In this analysis, the difference in TTRs between the four clusters was still significant (P-value 0.045) with the median TTR of 512 days for validation samples assigned to cluster 1 but not reached for the remaining clusters (Fig. 5a). The difference in OS between the four clusters was not significant (P-value 0.25) for the validation sam-ples, but the Kaplan-Meier curve showed a trend for lower OS for samples in cluster 1 relative to the other clusters (Fig. 5b) with the median OS of 733, not reached, not reached and 3147 days for the 4 clusters. When sam-ples in clusters 2, 3, and 4 were combined and compared
to samples in cluster 1, the P-value was marginally signifi-cant (P-value = 0.116, Kaplan-Meier curve not shown) with the median OS of 733 vs. 3147 days.
Thus, the NSCLC clusters identified using our cluster-ing methodology are associated with different disease outcomes, suggesting that these genomic clusters repre-sent clinically distinct subgroups of the disease. Conse-quently, the cell lines selected can be used as models to represent the existing subtypes of the disease.
Comparison with other unsupervised clustering algorithms
used as the main performance criterion. The cluster sta-bility was assessed as an additional performance metric.
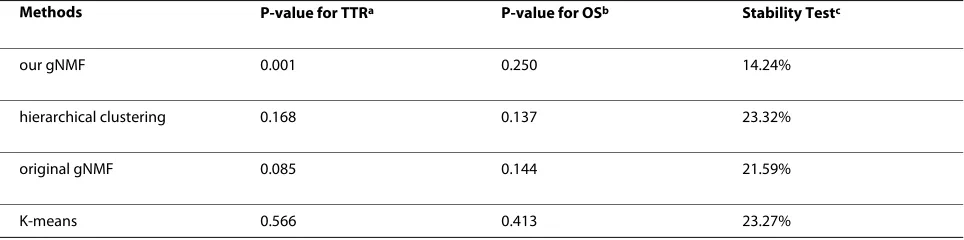
The performance comparison of the various clustering methods is presented in Table 3. In the TTR analysis, the p-values for Hierarchical Clustering, the original gNMF, and K-means clustering were 0.168, 0.085, and 0.566, respectively. In the OS analysis, the p-values were 0.137, 0.144 and 0.413, respectively. Thus, the clustering pat-terns generated by these procedures did not correlate sig-nificantly with the clinical outcomes. Whereas our method yielded a significant P value of 0.001 for separat-ing NSCLC tumor patients with different TTR, implyseparat-ing
that it classifies samples into biologically relevant sub-groups.
To evaluate the relative stability of clusters produced by different procedures, the 10-fold cross-validation scheme was applied. For our algorithm, the total error rate for the NSCLC data set was 14.24%, while the error rates for hierarchical clustering, the original gNMF, and K-means clustering were 23.32%, 21.59%, and 23.27%, respectively. Thus, our comparison shows that the tumor classification methodology described here outperforms the existing algorithms, both in terms of cluster stability and the bio-logical relevance of clusters.
Table 2: Number of tumor patients in each of the four NSCLC subtypes and the cell lines selected to represent each subtype.
Clusters Number of tumors Representative Cancer Cell Lines for each subtype
Cluster A 19 HCC827, H1437, H1563, H1568, H1623, H1651, H1693, H1755, H1793, H1838, H1944, H1975, H1993, H2023, H2073, H2085, NCI-H2087, NCI-H2122, NCI-H2126, NCI-H2228, NCI-H2291, NCI-H23, NCI-H2342, NCI-H2347, NCI-H647, NCI-H920, NCI-H969, CLS-54, LX-289, SK-LU-1, H2882, Calu-6, H358, H460
Cluster B 60 NCI-H2405, NCI-H522, SK-MES-1, H157, H1819, H2009, H2887, HCC1171, HCC1359, HCC15, HCC193, HCC366, HCC461, HCC515, HCC78, HOP-62, HOP-92, NCI-H266
Cluster C 42 A549, Calu-3, NCI-H1734, NCI-H838, HCC95
Cluster D 124
Classification of colorectal and melanoma tumors and cell lines
Our classification methodology was also applied to two additional copy number datasets, one for colorectal can-cer (CRC) and the other one for malignant melanoma. Normal contaminated samples were detected and removed before clustering. Pilot hierarchical clustering
was used to determine the initial numbers of clusters (Additional file 1Figs. S2, S3), then the gNMF clustering algorithm was applied. In the CRC study, 101 tumors and 35 cell lines were classified into five distinct genomic clusters. The heatmap is shown in Fig. 6, and the cell lines selected to represent each subtype are listed in Table 4. In the melanoma study, 30 cell lines and 80 short-term mel-Figure 4 Kaplan-Meier curves of the TTR and OS between the validation samples assigned into the four clusters using all existing tumor and cell lines to represent the clusters: (a) TTR; and (b) OS.
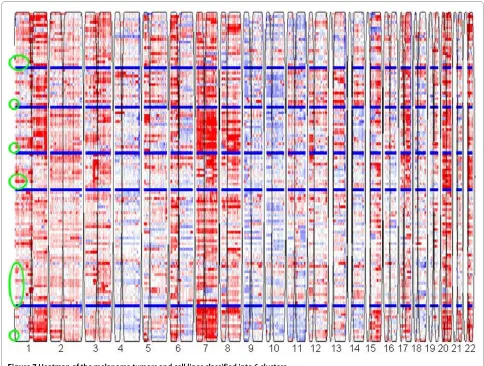
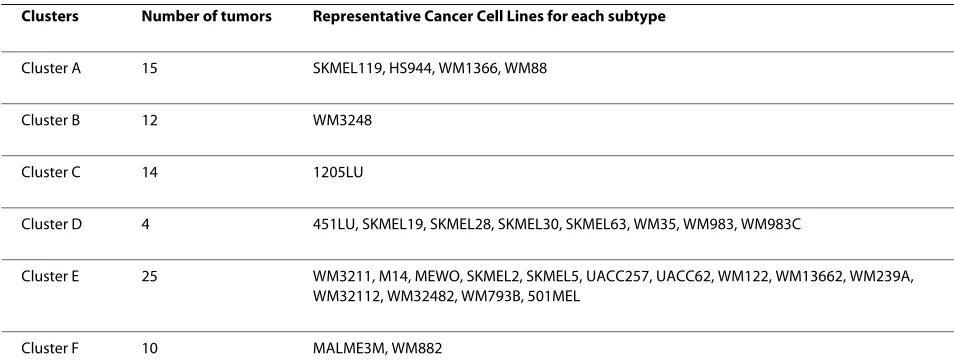
anoma cultures were clustered into six distinct genomic clusters. The heatmap is shown in Fig. 7, and the cell lines selected to represent each subtype are listed in Table 5. These cell lines can serve as disease models for the respective subtypes of CRC and melanoma. Clinical information for these tumors was not available, so we were not able to evaluate the biological significance of these clusters. However, we believe that the genomics-based cell line panels for these cancer types will improve screening of drug candidates by ensuring representation of all genomic subtypes.
Discussion
Currently, pre-clinical models for oncology drug testing are selected based on their availability, adaptability to tumor formation in mice, growth in culture, as well as other parameters. This approach does not take into account the genetic heterogeneity of the parent tumor, resulting in poor representation of molecular subtypes of tumors during preclinical testing. Thus, the high response rates that are frequently seen in pre-clinical testing may only represent the response of the single molecular subtype represented in the preclinical testing laboratory. If this subtype represents only a fraction of the patient population, and if the drug is efficacious only against this specific subtype, then the response rate in the clinic will be significantly lower. Therefore, there is a need for improved pre-clinical testing models that would cover a broader spectrum of parent tumors. Such improved pre-clinical testing will increase the predict-ability of the preclinical testing of new drugs.
Recently, application of high-density SNP genotyping microarrays for gene copy number profiling enabled gen-eration of comprehensive copy number datasets for most major tumor types. However, the processing and use of high-density copy number for cancer classification remains a challenge due to the complexity of using altera-tions of varied length and amplitude in clustering
sam-ples. We believe that copy number profiles are best suited for developing a genomic taxonomy of cancer due to their temporal stability and easier detection in various sam-ples. Therefore, we developed an unsupervised method-ology based on revised gNMF algorithm for classifying samples based on their genomic patterns of copy number aberrations and applied it to three datasets, which con-tained both internally generated and public data. The NMF algorithm has previously been used in image analy-sis [24,25]. It has been adapted for use in gene expression profiling [26] and gene copy number analysis [17,23]. It has shown advantages over traditional clustering and component analysis algorithms such as Princial Compo-nent Analysis (PCA), Self-Organizing Maps (SOM), and hierarchical clustering when applied to gene expression data [26]. We further improved the original gNMF algo-rithm and developed an integrated workflow, which includes pilot hierarchical clustering to estimate the pos-sible number of clusters, gNMF with a revised stop crite-rion and multi-run strategy, model selection using Cophenetic correlation and BIC, and a cross-validation stability test.
We applied our algorithm to datasets for NSCLC, CRC, and melanoma, each containing copy number profiles for hundreds of patient tumors and ~50 cell lines. The algo-rithm identified distinct new genomic subtypes for each tumor type. The clustering results were then evaluated for stability and reproducibility by using 10-fold cross-validation schemes. To determine whether the clusters discovered have biologically meaningful differences, we correlated the available disease outcome parameters (overall survival and time to recurrence) with the cluster distribution of samples and found a significant difference in clinical outcome between samples assigned into differ-ent clusters. As an additional test to validate the correla-tion between the classificacorrela-tion and the outcome, we also profiled a group of outcome-annotated validation sam-ples and assigned them to the existing clusters based on
Table 3: Performance comparison of the unsupervised clustering algorithms on NSCLC data set.
Methods P-value for TTRa P-value for OSb Stability Testc
our gNMF 0.001 0.250 14.24%
hierarchical clustering 0.168 0.137 23.32%
original gNMF 0.085 0.144 21.59%
K-means 0.566 0.413 23.27%
their copy number profiles. It was shown that the cluster assignment of the samples also significantly correlates with the clinical outcome, providing additional validation to our methodology.
Copy number alterations of single oncogenes and tumor-suppressor genes have previously been implicated as important biomarkers in cancer. Notable examples include HER2 amplification in breast cancer [1,9,10], EGFR amplification in lung cancer [4-8], and MYCN amplification in neuroblastoma [34,35]. In these and other examples of previous validation and use of copy number alterations as predictors of outcome and response to therapeutic agents, only individual altera-tions were considered. Our methodology is based on the analysis of complex whole-genome wide patterns of copy number alterations. Therefore, it provides a complete characterization of genomic subtypes of the cancer under consideration and is expected to generate more precise correlates of clinical behaviour and response to drugs. We believe that the proposed genomic taxonomy is valid for the entire population of tumor patients, because (i) the
sample sets used to develop it were large enough (150~300 samples) and (ii) the samples were acquired from a variety of sources, thus eliminating the possibility of bias.
Figure 7 Heatmap of the melanoma tumors and cell lines classified into 6 clusters.
Table 4: Number of tumor patients in each of the five CRC subtypes and the cell lines selected to represent each subtype.
Clusters Number of tumors Representative Cancer Cell Lines for each subtype
Cluster A 0 HCT-8, LS 174T, SK-CO-1, SW48, DLD-1, HCT-15, HCT116, LoVo, CL-34, CL-40, C170, LS180
Cluster B 2 Caco-2, LS1034, LS411N, LS513, NCI-H498, NCI-H747, SW1116, SW1417, SW837, HT-29, SW620, CL-11, CL-14, Colo-678, SW-480
Cluster C 8 Colo 320DM, NCI-H508, NCI-H716, SW1463, SW403, SW948, Colo 205, Colo-206F
Cluster D 40
lation between variables, and the lack of reproducibility between studies due to systematic biases. Analysis of these issues is beyond the scope of this manuscript.
We are currently testing the classification methodology for its ability to predict disease outcome for new patients. To predict the disease outcome for a new patient, a tumor sample will be profiled for copy number alterations by high-density arrays and assigned into one of the sub-groups. Alternatively, a panel of FISH probes may be designed based on the most characteristic copy number abnormalities for each subgroup, and new patient sam-ples would be tested by FISH using the probe panel devel-oped and classified into one of the subgroups based on the pattern of aberrations observed. The association with one of the groups would be used to predict response to the agent under consideration. A companion diagnostic can thus be developed for use with the drug considered. An additional application of the proposed classification methodology is in the assembly of a collection of preclini-cal testing models representative of the genetic diversity of tumors, such as the NSCLC, CRC, and melanoma test-ing panels that are described here.
Conclusion
We developed a modified genomic non-Negative Matrix Factorization (gNMF) clustering algorithm to cluster CGH data of tumor and cell lines to identify genomic subtypes of tumors and select representative cell lines. Our algorithm enables the assembly of panels of cell lines representative of the genomic heterogeneity of cancers.
Additional material
Competing interests
The methodologies developed in this manuscript and the cell panels repre-senting different subtypes of NSCLC, CRC and melanoma have been claimed in US Patent Applications No. 61/110,281, 61/110,317, 61/110,308 and 61/110,296 ( submitted by Abbott Laboratories).
Authors' contributions
CVS and DS initiated the study and generated internal CGH data used in this study. XL and KZ developed the statistical methodologies. XL wrote the R code for the methodology and carried out the experiments. JC provided part of the NSCLC patient samples with clinical outcome, and provided guidance on using clinical information to validate the clustering results. DS managed the entire study. XL and DS wrote the manuscript with input from all authors. All authors read and approved the final manuscript.
Acknowledgements
We would like to thank Viswanath Devanarayan for his suggestions and com-ments on the statistical methodologies used in this work. We are grateful to Lisa Roberts for generating a subset of NSCLC patient CGH data.
Author Details
1Global Pharmaceutical Research and Development, Abbott Laboratories, 100
Abbott Park Road, Building AP-10, Dep. R4CD, Abbott Park, IL 60064, USA,
2Department of Pathology, School of Medicine & Health Sciences, University of
North Dakota, 501 N. Columbia Road, Grand Forks, ND 58202, USA, 3Astellas
Pharma Global Development, INC. 8045 Lamon Ave, Skokie, IL 60077, USA and
4Department of Pathology, Rush University Medical Center, Chicago, IL 60612,
USA
References
1. Vogel CL, Cobleigh MA, Tripathy D, Gutheil JC, Harris LN, Fehrenbacher L,
Slamon DJ, Murphy M, Novotny WF, Burchmore M, et al.: Efficacy and
safety of trastuzumab as a single agent in first-line treatment of HER2-overexpressing metastatic breast cancer. J Clin Oncol 2002,
20(3):719-726.
2. Fisher B, Dignam J, Wolmark N, DeCillis A, Emir B, Wickerham DL, Bryant J,
Dimitrov NV, Abramson N, Atkins JN, et al.: Tamoxifen and chemotherapy
for lymph node-negative, estrogen receptor-positive breast cancer. J Natl Cancer Inst 1997, 89(22):1673-1682.
3. Cleator SJ, Ahamed E, Coombes RC, Palmieri C: A 2009 update on the
treatment of patients with hormone receptor-positive breast cancer.
Clin Breast Cancer 2009, 9(Suppl 1):S6-S17.
Additional file 1 Additional figures for the gNMF based unsupervised clustering algorithm.
Received: 27 January 2010 Accepted: 22 June 2010 Published: 22 June 2010
This article is available from: http://www.biomedcentral.com/1755-8794/3/23 © 2010 Lu et al; licensee BioMed Central Ltd.
This is an Open Access article distributed under the terms of the Creative Commons Attribution License (http://creativecommons.org/licenses/by/2.0), which permits unrestricted use, distribution, and reproduction in any medium, provided the original work is properly cited.
BMC Medical Genomics 2010, 3:23
Table 5: Number of tumor patients in each of the six melanoma subtypes and the cell lines selected to represent each subtype.
Clusters Number of tumors Representative Cancer Cell Lines for each subtype
Cluster A 15 SKMEL119, HS944, WM1366, WM88
Cluster B 12 WM3248
Cluster C 14 1205LU
Cluster D 4 451LU, SKMEL19, SKMEL28, SKMEL30, SKMEL63, WM35, WM983, WM983C
Cluster E 25 WM3211, M14, MEWO, SKMEL2, SKMEL5, UACC257, UACC62, WM122, WM13662, WM239A, WM32112, WM32482, WM793B, 501MEL
4. Gazdar AF: Personalized medicine and inhibition of EGFR signaling in lung cancer. N Engl J Med 2009, 361(10):1018-1020.
5. Cappuzzo F, Hirsch FR, Rossi E, Bartolini S, Ceresoli GL, Bemis L, Haney J,
Witta S, Danenberg K, Domenichini I, et al.: Epidermal Growth Factor
Receptor Gene and Protein and Gefitinib Sensitivity in Non-Small-Cell Lung Cancer 10.1093/jnci/dji112. J Natl Cancer Inst 2005, 97(9):643-655.
6. Laurent-Puig P, Lievre A, Blons H: Mutations and response to epidermal
growth factor receptor inhibitors. Clin Cancer Res 2009, 15(4):1133-1139.
7. Harris M: Monoclonal antibodies as therapeutic agents for cancer.
Lancet Oncol 2004, 5(5):292-302.
8. Takano T, Ohe Y, Sakamoto H, Tsuta K, Matsuno Y, Tateishi U, Yamamoto S,
Nokihara H, Yamamoto N, Sekine I, et al.: Epidermal Growth Factor
Receptor Gene Mutations and Increased Copy Numbers Predict Gefitinib Sensitivity in Patients With Recurrent Non-Small-Cell Lung Cancer 10.1200/JCO.2005.01.0793. J Clin Oncol 2005, 23(28):6829-6837.
9. Slamon DJ, Clark GM, Wong SG, Levin WJ, Ullrich A, McGuire WL: Human
breast cancer: correlation of relapse and survival with amplification of the HER-2/neu oncogene. Science 1987, 235(4785):177-182.
10. Slamon DJ, Leyland-Jones B, Shak S, Fuchs H, Paton V, Bajamonde A,
Fleming T, Eiermann W, Wolter J, Pegram M, et al.: Use of chemotherapy
plus a monoclonal antibody against HER2 for metastatic breast cancer that overexpresses HER2. N Engl J Med 2001, 344(11):783-792.
11. Chin L, Gray JW: Translating insights from the cancer genome into
clinical practice. Nature 2008, 452(7187):553-563.
12. Hanahan D, Weinberg RA: The hallmarks of cancer. Cell 2000,
100(1):57-70.
13. Shipp MA, Ross KN, Tamayo P, Weng AP, Kutok JL, Aguiar RC, Gaasenbeek
M, Angelo M, Reich M, Pinkus GS, et al.: Diffuse large B-cell lymphoma
outcome prediction by gene-expression profiling and supervised machine learning. Nat Med 2002, 8(1):68-74.
14. Golub TR, Slonim DK, Tamayo P, Huard C, Gaasenbeek M, Mesirov JP,
Coller H, Loh ML, Downing JR, Caligiuri MA, et al.: Molecular classification
of cancer: class discovery and class prediction by gene expression monitoring. Science 1999, 286(5439):531-537.
15. van 't Veer LJ, Dai H, van de Vijver MJ, He YD, Hart AA, Mao M, Peterse HL,
van der Kooy K, Marton MJ, Witteveen AT, et al.: Gene expression profiling
predicts clinical outcome of breast cancer. Nature 2002,
415(6871):530-536.
16. Alizadeh AA, Eisen MB, Davis RE, Ma C, Lossos IS, Rosenwald A, Boldrick JC,
Sabet H, Tran T, Yu X, et al.: Distinct types of diffuse large B-cell
lymphoma identified by gene expression profiling. Nature 2000,
403(6769):503-511.
17. Maher EA, Brennan C, Wen PY, Durso L, Ligon KL, Richardson A, Khatry D,
Feng B, Sinha R, Louis DN, et al.: Marked genomic differences
characterize primary and secondary glioblastoma subtypes and identify two distinct molecular and clinical secondary glioblastoma entities. Cancer Res 2006, 66(23):11502-11513.
18. Myllykangas S, Himberg J, Bohling T, Nagy B, Hollmen J, Knuutila S: DNA
copy number amplification profiling of human neoplasms. Oncogene
2006, 25(55):7324-7332.
19. Myllykangas S, Tikka J, Bohling T, Knuutila S, Hollmen J: Classification of
human cancers based on DNA copy number amplification modeling.
BMC Med Genomics 2008, 1:15.
20. Baudis M: Genomic imbalances in 5918 malignant epithelial tumors: an
explorative meta-analysis of chromosomal CGH data. BMC Cancer 2007,
7:226.
21. Lapointe J, Li C, Giacomini CP, Salari K, Huang S, Wang P, Ferrari M,
Hernandez-Boussard T, Brooks JD, Pollack JR: Genomic profiling reveals
alternative genetic pathways of prostate tumorigenesis. Cancer Res
2007, 67(18):8504-8510.
22. Jong K, Marchiori E, van der Vaart A, Chin SF, Carvalho B, Tijssen M, Eijk PP,
van den Ijssel P, Grabsch H, Quirke P, et al.: Cross-platform array
comparative genomic hybridization meta-analysis separates hematopoietic and mesenchymal from epithelial tumors. Oncogene
2007, 26(10):1499-1506.
23. Carrasco DR, Tonon G, Huang Y, Zhang Y, Sinha R, Feng B, Stewart JP, Zhan
F, Khatry D, Protopopova M, et al.: High-resolution genomic profiles
define distinct clinico-pathogenetic subgroups of multiple myeloma patients. Cancer Cell 2006, 9(4):313-325.
24. Lee DD, Seung HS: Learning the parts of objects by non-negative matrix
factorization. Nature 1999, 401(6755):788-791.
25. Lee DD, Seung HS: Algorithms for Non-negative Matrix Factorization.
Advances In Neural Information Processing Systems 2001, 14:556-562.
26. Brunet JP, Tamayo P, Golub TR, Mesirov JP: Metagenes and molecular
pattern discovery using matrix factorization. Proc Natl Acad Sci USA
2004, 101(12):4164-4169.
27. Breiman L: Random Forests. Machine Learning 2001, 45(1):5-32.
28. Paatero P, Tapper U: Positive matrix factorization: A non-negative factor
model with optimal utilization of error estimates of data values.
Environmetrics 1994, 5(2):111-126.
29. Sokal RR, Rohlf FJ: The comparison of dendrograms by objective
methods. Taxon 1962, 11:33-40.
30. Schwarz G: Estimating the dimension of a model. Annals of Statistics
1978, 6(2):461-464.
31. Hodgson G, Hager JH, Volik S, Hariono S, Wernick M, Moore D, Nowak N,
Albertson DG, Pinkel D, Collins C, et al.: Genome scanning with array CGH
delineates regional alterations in mouse islet carcinomas. Nat Genet
2001, 29(4):459-464.
32. Zhao X, Weir BA, LaFramboise T, Lin M, Beroukhim R, Garraway L, Beheshti
J, Lee JC, Naoki K, Richards WG, et al.: Homozygous deletions and
chromosome amplifications in human lung carcinomas revealed by single nucleotide polymorphism array analysis. Cancer Res 2005,
65(13):5561-5570.
33. Hartigan JA, Wong MA: A K-means clustering algorithm. Applied
Statistics 1979, 28:100-108.
34. Wang Q, Diskin S, Rappaport E, Attiyeh E, Mosse Y, Shue D, Seiser E,
Jagannathan J, Shusterman S, Bansal M, et al.: Integrative genomics
identifies distinct molecular classes of neuroblastoma and shows that multiple genes are targeted by regional alterations in DNA copy number. Cancer Res 2006, 66(12):6050-6062.
35. Schneiderman J, London WB, Brodeur GM, Castleberry RP, Look AT, Cohn SL: Clinical significance of MYCN amplification and ploidy in favorable-stage neuroblastoma: a report from the Children's Oncology Group. J Clin Oncol 2008, 26(6):913-918.
Pre-publication history
The pre-publication history for this paper can be accessed here: http://www.biomedcentral.com/1755-8794/3/23/prepub
doi: 10.1186/1755-8794-3-23
Cite this article as: Lu et al., An algorithm for classifying tumors based on
genomic aberrations and selecting representative tumor models BMC