Mobile GPU‑based implementation
of automatic analysis method for long‑term ECG
Xiaomao Fan
1,2,3,4, Qihang Yao
1,3,4, Ye Li
1,3,4, Runge Chen
1,3,4and Yunpeng Cai
1,3,4*Abstract
Background: Long-term electrocardiogram (ECG) is one of the important diagnos-tic assistant approaches in capturing intermittent cardiac arrhythmias. Combination of miniaturized wearable holters and healthcare platforms enable people to have their cardiac condition monitored at home. The high computational burden created by concurrent processing of numerous holter data poses a serious challenge to the healthcare platform. An alternative solution is to shift the analysis tasks from healthcare platforms to the mobile computing devices. However, long-term ECG data processing is quite time consuming due to the limited computation power of the mobile central unit processor (CPU).
Methods: This paper aimed to propose a novel parallel automatic ECG analysis algorithm which exploited the mobile graphics processing unit (GPU) to reduce the response time for processing long-term ECG data. By studying the architecture of the sequential automatic ECG analysis algorithm, we parallelized the time-consuming parts and reorganized the entire pipeline in the parallel algorithm to fully utilize the hetero-geneous computing resources of CPU and GPU.
Results: The experimental results showed that the average executing time of the proposed algorithm on a clinical long-term ECG dataset (duration 23.0 ± 1.0 h per signal) is 1.215 ± 0.140 s, which achieved an average speedup of 5.81 ± 0.39× without compromising analysis accuracy, comparing with the sequential algorithm. Meanwhile, the battery energy consumption of the automatic ECG analysis algorithm was reduced by 64.16%. Excluding energy consumption from data loading, 79.44% of the energy consumption could be saved, which alleviated the problem of limited battery working hours for mobile devices.
Conclusion: The reduction of response time and battery energy consumption in ECG analysis not only bring better quality of experience to holter users, but also make it possible to use mobile devices as ECG terminals for healthcare professions such as physicians and health advisers, enabling them to inspect patient ECG recordings onsite efficiently without the need of a high-quality wide-area network environment.
Keywords: Automatic ECG analysis, Parallel computing, Mobile GPU, Energy consumption
Open Access
© The Author(s) 2018. This article is distributed under the terms of the Creative Commons Attribution 4.0 International License (http://creat iveco mmons .org/licen ses/by/4.0/), which permits unrestricted use, distribution, and reproduction in any medium, provided you give appropriate credit to the original author(s) and the source, provide a link to the Creative Commons license, and indicate if changes were made. The Creative Commons Public Domain Dedication waiver (http://creat iveco mmons .org/publi cdoma in/zero/1.0/) applies to the data made available in this article, unless otherwise stated.
RESEARCH
Background
With the development of information and healthcare technologies, large number of peo-ple tend to monitor their health condition at home using wearable holters. Due to the unique nature of healthcare service, users typically follow a similar schedule and upload the electrocardiogram (ECG) data collectively, creating a high computational burden on the healthcare platform at a certain time of day. In particular, concurrent processing of long-term ECG data, which is an important assistant approach to capture intermittent cardiac arrhythmias, tortures the healthcare platform heavily. How to efficiently process long-term ECG data collectively is an important issue to be solved.
ECG, as one of the vital physiological data, shows the time evolution of the heart’s electrical activity, which is caused by distinct electrical depolarization–repolariza-tion patterns of the heart. Disorders of heart rate or rhythm, or changes in the mor-phological patterns, are indicators of underlying diseases [1]. For example, myocardial infarction, cardiomyopathy, and myocarditis can lead to obvious ECG changes. Various ECG heartbeat classification methods were proposed by researchers in previous stud-ies [2, 3]. An automatic ECG heartbeat classification pipeline mainly consists of basic steps including noise reduction [4–6], QRS complex detection [7, 8], feature extraction [9–11], and heartbeat classification [3, 12–18]. Heartbeat classification is a critical step in automatic ECG analysis. In the past few years, heartbeat classification methods are still under development with novel algorithms being proposed continuously. Liang et al. used hidden markov models (HMMs) to classify patient ECG signals in the free-living environment [13]. Lannoy et al. proposed weighted conditional random fields classifier for the automatic classification of heartbeats [17]. Furthermore, with the development of machine learning, many artificial intelligent methods have been applied in ECG heart-beat classification. Ye et al. applied wavelet transform and independent component anal-ysis separately to each heartbeat to extract morphological features, then support vector machine (SVM) was used for heartbeat classification [14]. Yu et al. used wavelet trans-formation and probabilistic neural network (PNN) to classify the ECG heartbeats [18]. Oliveira et al. employed a dynamic bayesian network to predict premature ventricular heartbeats [15]. Lagerholm applied unsupervised clustering methods to partition the QRS complex into clusters, then self-organized neural networks were used to identify heartbeat types [16]. However, most ECG heartbeat classification methods are time-con-suming, especially for processing long-term ECGs such as 24-h long ECGs. Although healthcare cloud platforms have been widely built to collect and manage ECG data from large populations, it is technically infeasible to provide prompt feedback for a large num-ber of concurrent ECG analysis requests for even a median platform managing ten thou-sands of users.
physician or a health advisor. With the aforementioned limitations of mobile devices, a fast and energy-efficient analysis algorithm for long-term ECG is urgently needed.
This paper aimed to propose a novel parallel automatic ECG analysis algorithm based on mobile graphics processing unit (GPU). The 24-h long ECG recordings collected from volunteers were utilized to evaluate the computing performance and energy effi-ciency of the parallel algorithm. The test was conducted on a smartphone named One-Plus 3 equipped with an Qualcomm Snapdragon 820 processor along with 6 GB memory and an integrated Adreno 530 GPU. The parallel automatic ECG analysis algorithm was optimized through workgroup size tuning, data vectorization, and zero memory copy technology to take full advantage of the potential of heterogeneous computation. Addi-tionally, the optimized parallel automatic ECG analysis algorithm consumed less energy per second in average compared with the sequential automatic ECG analysis algorithm. This led to a significant energy saving and longer working hours of battery for mobile devices when they were served as ECG processing terminals. Note a preliminary version of this paper has been reported [22].
The subsequent sections of the paper are organized as follows. Section of “Methods” introduces the OpenCL parallel computing model, parallel optimization technologies, the sequential automatic ECG classification algorithm, and the parallel implementation of the sequential automatic ECG classification algorithm on mobile GPUs. The results including experimental environment, data source, classification performance of auto-matic ECG analysis algorithm, and parallel efficiency and energy efficiency are described in the section of “Results and discussion”. The final section summarizes the paper.
Methods
The OpenCL parallel computing model
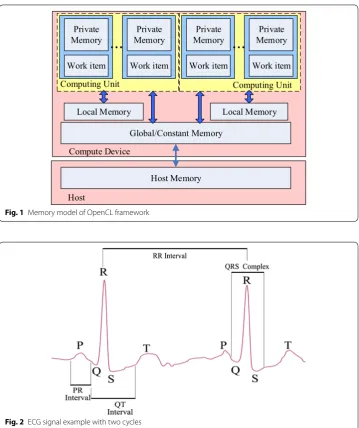
OpenCL is a common multi-CPU/multi-GPU heterogeneous computing framework. OpenCL uses heterogeneous CPU/GPU hardwares to perform large-scale computa-tion tasks, especially tasks with high parallelism, more efficiently taking full advantage of the powerful parallel GPU computation capabilities [23, 24]. OpenCL has many advantages, such as platform independence, simple hardware acceleration, and easy pro-gramming. Figure 1 shows the memory model of OpenCL framework. Memory hierar-chy of a GPU device consists of global memory, constant memory, local memory, and private memory. Global memory and constant memory are shared among all computa-tion units, while every computing unit owns independent local memory which can be accessed with much shorter latency. All work items in a workgroup share the same local memory. This model owns great generality and matches well with the computing archi-tecture of mobile devices. Generally, OpenCL provides a unified computing model that allows many intensive tasks of mobile computation to be implemented in parallel and assigned to mobile GPU. It shortens the executing time and proffers users better quality of experience.
Automatic ECG analysis algorithm
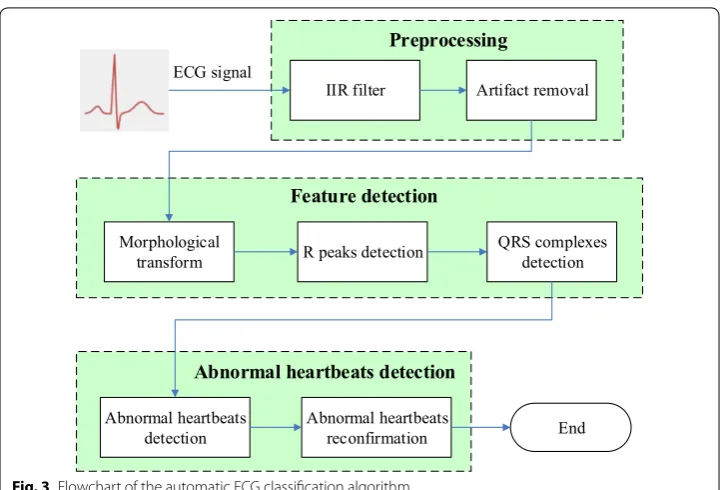
width. The RR interval is the width between two nearby R peaks, and the QRS complex width is defined as the distance between Q and S wave. Other features of ECG include PR interval, QT interval, ST segment, and T wave. Accurate identification of ECG fea-tures is important for the automatic ECG analysis algorithm.
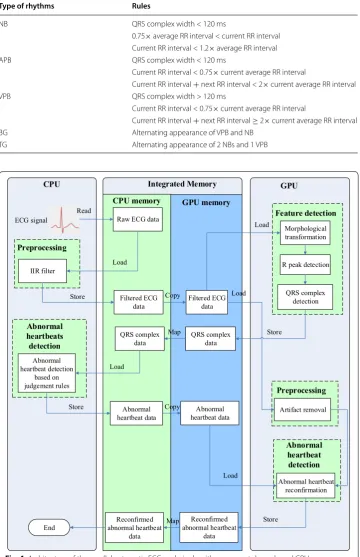
Figure 3 shows the entire computation procedure of the automatic ECG analysis algo-rithm, which consists of three processing phases: (1) preprocessing phase; (2) feature detection phase; (3) abnormal heartbeat detection phase. The preprocessing phase includes two steps: infinite impulse response (IIR) band-pass filtering and artifact removal. The IIR bandpass filter with a cut-off frequency of 0.5 and 40 Hz is used to cancel baseline drift, high-frequency noise, and powerline interference [25]. Then, in the artifact removal step, the dynamic threshold method is used to mark the noise signal segments that would be abandoned in the succeeding processes [26]. In the feature detection phase, the mor-phological transform method is used to enhance the amplitude of R peaks to locate the
Local Memory Local Memory
Global/Constant Memory
Host Memory Compute Device
Host
Computing Unit Computing Unit
Private Memory
Work item
Private Memory
Work item
...
MemoryPrivateWork item
Private Memory
Work item
...
Fig. 1 Memory model of OpenCL framework
positions of R peaks and QRS complexes [27]. R peak positions can be detected easily based on the dynamic threshold method. The start and end positions of QRS complex are set at 50 ms before R peak and 80 ms after R peak, respectively [2]. In addition, the RR interval and the QRS complex width are calculated. In the abnormal heartbeat detection phase, abnormal heartbeats are identified based on judgment rules given by physicians with the acquired position lists of R peaks and QRS, RR intervals, and the QRS complex width [29, 30]. Moreover, the template matching method is utilized to reconfirm abnor-mal heartbeats to avoid the misjudgment of abnorabnor-mal heartbeats. Following general clini-cal ECG arrhythmia detection guidelines [28], this approach could identify five types of abnormal ECG arrhythmias, including normal sinus heartbeats (NB), bigeminy (BG), trigeminy (TG), atrial premature heartbeats (APB), and ventricular premature heartbeats (VPB). The detailed judgments of 5 types of ECG rhythms are listed in Table 1.
Parallel implementation of automatic ECG classification method on OpenCL framework Modern mobile devices have a highly integrated circuit that combines all the primary components, such as CPU, GPU, and memory, into a single chip. One of the benefits is high bandwidth memory. The ultra-wide memory standard essentially accelerates the data transfer speed between memory and CPU/GPU. Another important feature is that CPU and GPU memory are integrated on the same chip and separated by embedded software. Instead of repeatedly transferring data between CPU and GPU memory in accordance with the task shifting, memory mapping technology could be introduced to map the same piece of physical memory in both the memory space of CPU and GPU. As a result, data transfer can be cut down or even avoided. Figure 4 shows the entire archi-tecture of the parallel automatic ECG analysis algorithm. Compared with the sequential algorithm, the entire program flow in parallel algorithm is reorganized in this study to
IIR filter Artifact removal
Morphological
transform R peaks detection QRS complexes detection
Abnormal heartbeats
detection Abnormal heartbeats reconfirmation ECG signal
Preprocessing
Feature detection
End
Abnormal heartbeats detection
fully utilize CPU/GPU heterogeneous computing resources. IIR filter is hard to be par-allelized due to its tight-coupling pattern and a processing iteration relies on the result of the previous one [31]. Therefore, it remains running on CPU. The morphological Table 1 Detailed judgment rules of 5 types of ECG rhythms.
Type of rhythms Rules
NB QRS complex width < 120 ms
0.75× average RR interval < current RR interval Current RR interval < 1.2× average RR interval
APB QRS complex width < 120 ms
Current RR interval < 0.75× current average RR interval
Current RR interval + next RR interval < 2× current average RR interval
VPB QRS complex width > 120 ms
Current RR interval < 0.75× current average RR interval
Current RR interval + next RR interval ≥ 2× current average RR interval
BG Alternating appearance of VPB and NB
TG Alternating appearance of 2 NBs and 1 VPB
CPU GPU
IIR filter R peak detection
QRS complex detection Artifact removal Abnormal heartbeat detection based on judgement rules End Abnormal heartbeat reconfirmation Morphological transformation Feature detection Preprocessing Preprocessing Abnormal heartbeat detection Abnormal heartbeats detection Integrated Memory ECG signal
CPU memory GPU memory
Raw ECG data
Filtered ECG
data Filtered ECG data
QRS complex data Abnormal heartbeat data QRS complex data Abnormal heartbeat data Read Load Store Copy Load Store Map Load Store Copy Load Load Reconfirmed abnormal heartbeat data Reconfirmed abnormal heartbeat data Map Store
transform method with inherent parallel characteristic is implemented in parallel on GPU. The following processes including R peak detection and QRS complex detection are also implemented in parallel on GPU. The abnormal heartbeat detection runs on CPU to better utilize CPU computing resources. At the same time, the artifact removal process is implemented in parallel on GPU. Finally, QRS complex templates are gener-ated from noise-free signals and used to correct misjudgment on abnormal heartbeats. For details of the parallel implementation, refer to Algorithm 1.
Algorithm 1 Parallel automated ECG analysis
Input: Raw ECG data(S)
Output: Abnormal type of heartbeats(ab list)
1: //Raw ECG data through IIR filter to remove power interference and baseline drift. 2: h f iltered ecg←IIR(S)
3: //filtered signal is copied from CPU memory to GPU memory
4: clEnqueueWriteBuffer(queue,d f iltered ecg, CL T RU E,0, size, h f iltered ecg) 5: //Start kernel of feature detection
6: //Structure elements of morphological transformation is assigned on local memory 7: localg vec← {0,50,100,50,0}
8: //Sub process in “for” are executed in parallel
9: fork←1toNdo
10: k←get global id(0)//work item global id 11: //Erosion
12: d ern(k)←min(d f iltered ecg(k+l)-g vec(l))//1≤l≤L
13: //Dilation
14: d dlt(k)←max(d ern(k+l) +g vec(l))//1≤l≤L
15: end for
16: //R peaks detection by dynamic threshold method 17: d rpos←dynamic threshold(d dlt)
18: //QRS complexes detection: the start and end position of QRS complex is set at 50 milliseconds before R peak and 80 milliseconds after R peak.
19: d qrs list←search qrs(d rpos, d f iltered ecg)
20: //QRS complexes list is mapped from GPU memory to CPU memory
21: h qrs list←clEnqueueMapBuffer(queue, d qrs list, CL T RU E, CL M AP READ,0, size,
22: N U LL, N U LL, N U LL, error) 23: //End of feature detection kernel
24: //Abnormal heartbeats detections by rule on CPU
25: h ab list by rule←rule classify(h qrs list) 26: //Copy h ab list by rule from CPU to GPU
27: clEnqueueWriteBuffer(queue, d ab list by rule, CL T RU E,0, size, h ab list by rule) 28: //End of abnormal heartbeats detection by rule on CPU
29: //Start of artifact removal kernel
30: d f iltered ecgis segmented intoNepochs
31: //The artifact epoch is identified by threshold method on standard deviation of the epoch 32: //Sub process in “for” are executed in parallel
33: fork←1toNdo
34: d artif act(k)←stdev(d f iltered ecg(k)) 35: d f lag(k)←threshold(d artif act(k)) 36: end for
37: //End of artifact removal kernel
38: //Start of abnormal heartbeats reconfirmation kernel 39: //Sub process in “for” are executed in parallel 40: fork←1toNdo
41: //Heartbeats template is created on each epoch
42: d heartbeat template(k)←template(d f lag(k), d f iltered ecg(k)) 43: //Abstract template features
44: d heartbeat f eature(k)←template feature(d heartbeat template(k)) 45: //Update abnormal heartbeats according to template features 46: forj←1toMdo//Mis the size ofab list
47: ab list(j)←template compare(d heartbeat f eature(k), d ab list) 48: end for
49: end for
50: // d ab listis mapped to CPU memory
51: ab list←clEnqueueMapBuffer(queue, d ab list, CL T RU E, CL M AP READ,0, size, N U LL, 52: N U LL, N U LL, error)
Parallel optimization technologies
The parallel algorithm could obtain a higher speedup through workgroup size tuning, data vectorization, and zero memory copy technologies. The details as follows: (1) work-group size tuning. Workwork-group size is an important factor affecting program efficiency. No general formula is available to calculate the optimal workgroup size, besides some constraints. Larger workgroups are better at hiding memory latency, while they would lead to cache thrashing. Proper workgroup size must be determined considering the reg-ister usage and the presence of barrier instructions inside kernels. (2) Data vectoriza-tion technology. As vector operavectoriza-tions are common in OpenCL framework, GPUs are designed to be particularly powerful in dealing with vectors. Native vector operations, including addition and multiplication, are supported by most of GPU architectures with the development of mobile GPU technologies. Meanwhile, GPU memory architecture has also been developed to be efficient in loading/storing batches of data concurrently. (3) Zero memory copy technology. Data transfer between CPU and GPU memory is quite slow. It is a common case that the time cost of pure computation in parallelized programs takes up only a small portion of the entire time cost. The intrinsic latency for data transfer between CPU and GPU memory is a big obstacle in parallelization prac-tice on the traditional CPU/GPU heterogeneous architecture. The CPU and GPU in mobile devices are usually integrated in one chip owing to the compact hardware struc-ture of smartphones, making it possible for them to share the same memory. The CPU can recognize the memory allocated by the GPU as a part of its own memory with the zero memory copy technology and access it directly. Instead of repeatedly copying data between CPU and GPU whenever needed, the algorithm spends only its efforts on the initial mapping that takes comparatively much lesser time.
In order to maximally utilize the computing resources, these technologies were applied on the proposed parallel program. For workgroup size, we started from 64, and scaled up and down until the peak performance was found. The result was that most tasks were most efficiently completed when workgroup size was 128, while a workgroup size of 256 offered the highest performance for the task morphological transformation, as they relied on less registers. For data vectorization, the data were loaded/processed/ stored in batches of 128 bits for all the transactions. As 32-bit float-point numbers were employed, four numbers were packed as a vector and operations on them were re-writ-ten using vector instructions. For zero memory copy, it was utilized throughout the design of the entire parallel algorithm. When CPU requires processed data from GPU, data were mapped directly to host memory from GPU memory directly, as it was shown in Fig. 4.
Experiments
Experimental environment
at 2.15 GHz and another two cores running at 1.6 GHz, together with an integrated Adreno 530 GPU in which 256 arithmetic and logic units run at 624 MHz.
Data collection
In this study, a multi-parameter patient simulator (FLUKE ProSim 8), the heart rate of which was 60 beats/min, was used to generate 5 types of ECG signals. Then, our devel-oped wearable Holter (Mini-Holter, 58 × 50 × 10 mm, 20 g, over 30 h of battery working time, single channel three leads, 150/250/500 Hz sampling frequency) was connected with the multi-parameter simulator via ECG lead wire cables to capture 40 5-min long ECG recordings at a sampling frequency of 150 Hz. A total of 3120 NB, 240 APB, 240 VPB, 600 BG and 400 TG were generated. These simulated ECG records were utilized to evaluate the classification performance of the automatic ECG analysis. On the other hand, a public ECG dataset named MIT-BIH arrhythmia database [32] (total 48 records including 74,695 NB, 2745 APB, and 5976 VPB) was also utilized for the classification performance. These ECG records were sampled at 360 Hz with 11-bit resolution over a 10 mV range. Heartbeat types of NB, APB and VPB were selected for identification in this paper.
To further verify the performance of the proposed method on clinical ECG records, seven subjects (2 males and 5 females) from the General Hospital of People’s Liberation Army (301 hospital) were recruited to generate independently representative dataset. The age of the subjects ranged from 49 to 75 years, reaching an average of 63 ± 9 years. Each subject wore the Mini-Holter (150 Hz sampling frequency) to collect a long-term ECG signal, the duration of which is 23 ± 1.04 h (ranging from 21.1 to 24.0 h). The clini-cal long-term ECG dataset consists of 673147 NB, 481 APB, 268 VPB, 2 BG, and 1 TG. All the subjects were requested to sign the informed consent form before the experi-ment. At the same time, abnormal arrhythmia heartbeats of the dataset were marked by an expert physician.
Experimental procedure
Results and discussion Classification performance
Several metrics including classification accuracy (ACCU ), sensitivity (SENS), and spec-ificity (SPEC) were calculated to measure the classification performance, and they are defined as follows combining statistical quantities:
where TPOS is true positive, TNEG is true negative, FPOS is false positive, and FNEG is false negative.
The performance of the sequential and parallel algorithm in detecting APB, VPB, BG, TG, and NB was evaluated on the synthetic dataset. The experimental results were shown in Table 2. The accuracy, sensitivity and specificity were more than 98%. On the other hand, MIT-BIH arrhythmia database was also employed to evaluate the classification performance of NB, APB and VPB. The results were shown in Table 3. The sensitivity of the proposed algorithm in detecting APB and VPB were 86.12 and 89.01%. Compared with the noise-free synthetic data, the sensitivities of the proposed algorithm in detecting on MIT-BIH arrhythmia database decreased a little bit.
(1)
ACCU= TPOS
+TNEG
TPOS+FNEG+FPOS+TNEG
(2) SENS= TPOS
TPOS+FNEG
(3) SPEC= TNEG
FPOS+TNEG
Bluetooth
Mini-Holter
Apart from validating the proposed method’s high classification performance on the synthetic dataset and MIT-BIH arrhythmia dataset, we also evaluated the performance on clinical ECG dataset which was collected from the 301 hospital. As shown in Table 4, over 94.53% of normal sinus heartbeats were identified. The sensitivity of APB and VPB were 80.04 and 83.95%, correspondingly. The classification performance of the proposed program in detecting APB and VPB on the clinical ECG data was obviously lower than that on the synthetic data. The cause was that clinical ECG data were collected by wear-able Mini-Holter and contaminated by a variety of noise such as artifact noise, power frequency interference, baseline drift, etc. The signal-to-noise (SNR) of the noise-free synthetic data was obviously higher than that of the clinical ECG data. The number of subjects who suffered BG and TG is very little, two subjects (one suffered two events of BG in a day and another suffered one event of TG in a day) were found to satisfy our experimental requirement. The sensitivity, specificity, accuracy of BG and TG were 100% as two events of BG and one event of TG were correctly identified. It demonstrated that Table 2 Classification performance of the sequential and parallel automatic ECG algorithm on synthetic ECG data
Type of rhythms Number of records SENS (%) SPEC (%) ACCU (%)
NB 3120 98.92 99.52 99.02
APB 240 99.60 99.34 99.34
VPB 240 98.03 99.02 98.00
BG 600 99.33 98.77 98.81
TG 400 100 99.07 99.10
Average 99.18 99.14 98.85
Table 3 Classification performance of the sequential and parallel automatic ECG algorithm on MIT-BIH arrhythmia database
Type of rhythms Number of records SENS (%) SPEC (%) ACCU (%)
NB 74,695 98.24 97.76 98.15
APB 2745 86.12 99.27 99.03
VPB 5976 89.01 99.76 98.95
Average 91.12 98.93 98.71
Table 4 Classification performance of the sequential and parallel automatic ECG algorithm on clinical long-term ECG data
Type of rhythms Number of records SENS (%) SPEC (%) ACCU (%)
NB 673,147 94.53 83.64 94.52
APB 481 80.04 96.31 96.30
VPB 268 83.95 98.88 98.87
BG 2 100 100 100
TG 1 100 100 100
our proposed method could identify BG and TG correctly even if BG/TG are few in number.
Parallel program efficiency
In order to give users real-time response after their physiological data were transmitted to smartphones, it was considered only viable to run automatic ECG analysis on pow-erful servers. In this study, the focus was shifted from powpow-erful computing servers to long-underestimated potential computing capability of smartphone-based GPU. Parallel structures in the sequential automatic ECG analysis algorithm were fully extracted, and then these specific parts were redesigned using a framework designed for computing heterogeneous platforms known as OpenCL.
Speedup is an effective measurement to validate the efficiency of the parallel program [33]. It is defined as the proportion of the elapsed time when executing a program on a single processor to the execution time on n processors. The speedup with n processors is defined as:
where SP(n) is speedup with n processors. Ts is the execution time of the algorithm
run-ning on a single processor. Tp is the execution time of program running on n processors. The time-consumption analysis of the automatic ECG algorithm was performed on a 24-h long ECG signal (no. 5) which collected from the 301 hospital. It was found that the artifact removal, feature detection, and abnormal heartbeats detection took up 16.7, 60.4, and 15.1% of the time cost, respectively, summing up to more than 92.2%. There-fore, the artifact removal, feature detection, and abnormal heartbeats detection were implemented in parallel with OpenCL framework to shorten the executing time of the entire automatic ECG analysis algorithm.
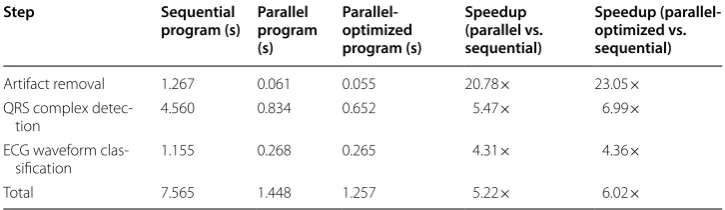
The same 24-h long ECG signal was also selected to evaluate the computing effi-ciency of the parallel program in each step. As shown in Table 5 and Fig. 6, the time cost of the automatic ECG analysis algorithm was reduced from 7.57 to 1.45 s. The parallel automatic ECG analysis algorithm achieved a speedup of 5.22× compared with the sequential algorithm. Then the parallel algorithm was further optimized using workgroup size tuning, data vectorization and zero memory copy technologies.
(4) SP(n)= Ts
Tp
Table 5 Speedup of the parallel automatic ECG analysis algorithm in each step on a 24-h long ECG signal
Step Sequential
program (s) Parallel program (s)
Parallel-optimized program (s)
Speedup (parallel vs. sequential)
Speedup (parallel-optimized vs. sequential)
Artifact removal 1.267 0.061 0.055 20.78× 23.05×
QRS complex
detec-tion 4.560 0.834 0.652 5.47× 6.99×
ECG waveform
clas-sification 1.155 0.268 0.265 4.31× 4.36×
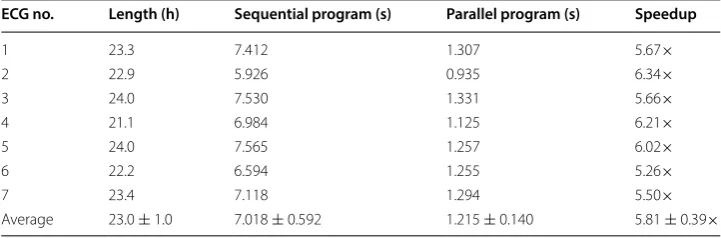
With the optimization mentioned above, the time cost of parallel algorithm was fur-ther reduced to 1.26 s, which achieved a speedup of 6.02×. In detail, the optimized parallel automatic ECG algorithm achieved a speedup of 23.05×, 6.99×, and 4.36× in the artifact removal, QRS complex detection, and waveform classification respec-tively. Meanwhile, the remained long-term ECG signals were also utilized to test the computing efficiency. As shown in Table 6, the average executing time of the sequen-tial program and the parallel program on long-term ECG dataset (duration: 23.0 ± 1.0 h) were 7.018 ± 0.592 and 1.215 ± 0.140 s correspondingly. The parallel program achieved an average speedups of 5.81 ± 0.39×, which showed its great superiority over the sequential algorithm.
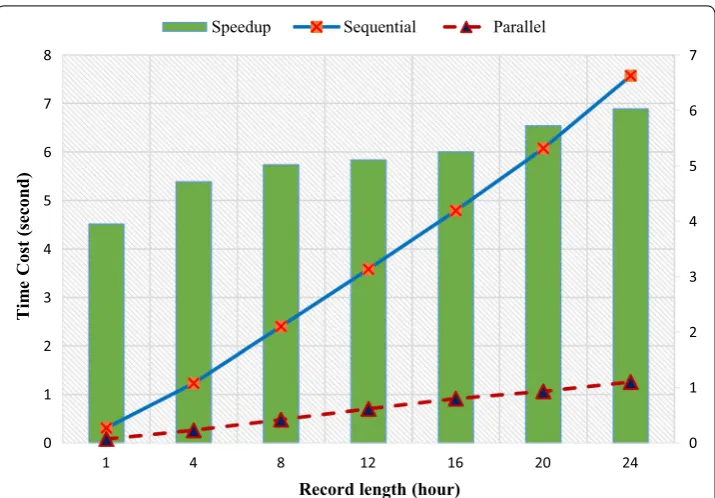
To further explore the proposed parallel algorithm’s performance for records with dif-ferent lengths, short signals, the duration which were 1, 4, 8, 12, 16, 20, and 24 h, were generated by randomly cropping a 24-h ECG signal. As shown in Fig. 7, both parallel and sequential algorithm presented a near-linear execution time increase in response to the increase of data length. More obviously presented by the speedup curve, was that the speedup increased sharply when data length increased from 1 to 4 h, and entered into a much gentle ascendance afterwards. Two factors would help to interpret this trend: (1) the utilization rate of computing resources dropped when input was too short, as the
20.78
5.47 4.31 5.22
23.05
6.99
4.36 6.02
0 5 10 15 20 25
Artifact removal Feature detection Abnormal
heartbeat detection Total Parallel Parallel-optimized
Fig. 6 Speedup of the parallel automatic ECG analysis algorithm. Parallel means the parallel automatic ECG algorithm; parallel-optimized means that the parallel automatic ECG algorithm was further optimized by workgroup size tuning, data vectorization and zero memory copy technologies
Table 6 Speedup of the parallel program on the long-term ECG dataset collected from the 301 hospital
ECG no. Length (h) Sequential program (s) Parallel program (s) Speedup
1 23.3 7.412 1.307 5.67×
2 22.9 5.926 0.935 6.34×
3 24.0 7.530 1.331 5.66×
4 21.1 6.984 1.125 6.21×
5 24.0 7.565 1.257 6.02×
6 22.2 6.594 1.255 5.26×
7 23.4 7.118 1.294 5.50×
lack of workloads caused the tasks to be more sparsely assigned to the GPU. (2) Una-voidably, part of the algorithm contributed a constant part to the execution time, and became more significant as the other part shrank in accordance with the input size.
Program energy efficiency
The need for the computing power of smartphones has increased with the continuing trend for smartphones to be more versatile. However, the greater performance comes with a price, which includes the reduced working hours of the battery. Thus, energy con-sumption is one of the key performance indicators of an application. In order to evaluate the energy efficiency of the proposed algorithm, the long-term ECG dataset from the 301 hospital were also utilized for test. The average battery power and total battery usage of test smartphone were recorded with Trepn Profiler provided by Qualcomm, which was reported to have an accuracy of 99% when Monsoon Power Monitor was used as a reference [34]. Furthermore, compared with the sequential program, the parallel pro-gram could save energy consumption greatly. The energy conservation is defined as:
where Esave is the energy saved by the parallel program, Es is the energy consumption of the sequential program, and Ep is the energy consumption of the parallel program.
(5) Esave=
Es−Ep
Es
0 1 2 3 4 5 6 7
0 1 2 3 4 5 6 7 8
1 4 8 12 16 20 24
Ti
me
Cost (second)
Record length (hour)
Speedup Sequential Parallel
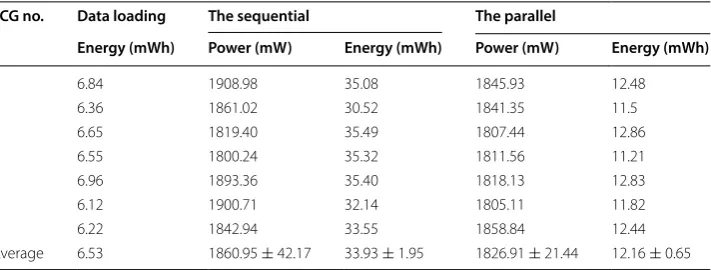
As shown in Table 7, the average power of the sequential algorithm was 1860.95 ± 42.07 mW, while the average power of the parallel algorithm was 1826.91 ± 21.44 mW. The parallel automatic ECG analysis algorithm consumed less power per second in average compared with the sequential algorithm. The aver-age battery energy consumption of the sequential algorithm executed five times was 33.93 ± 1.95 mWh, while the parallel algorithm executed five times consumed 12.16 ± 0.65 mWh. According to Eq. (5), the parallel algorithm could save about 64.16% energy. However, the energy consumption was recorded for the whole Android applica-tion, which also included data loading and other operations, as it was very hard to meas-ure the energy consumption of only the algorithm. Excluding the energy consumption from data loading, the energy conservation of the parallel program could be saved about 79.44%, greatly improving the battery working hours of smartphone.
Conclusion
This paper proposed a parallel automatic ECG analysis algorithm based on smart-phone GPUs. The processing steps of artifact removal, QRS complex detection, and ECG waveform classification were implemented in parallel according to time cost and parallel feasibility analysis of the sequential automatic ECG analysis algorithm. Compared with the sequential algorithm, the average time cost of the parallel auto-matic ECG analysis algorithm on the long-term ECG dataset from the 301 hospital was reduced from 7.018 ± 0.592 to 1.215 ± 01.40 s, and a speedup of 5.81 ± 0.39× was achieved. Additionally, the average power and execution time of the parallel auto-matic ECG analysis algorithm was less than that of the sequential autoauto-matic ECG analysis algorithm, and about 64.16% of the battery energy was saved. If the energy consumption from data loading was excluded, the parallel program could save 79.44% of the energy consumption.
The reduction of response time and battery energy consumption in ECG analysis not only bring better quality of experience to holter users, but also make it possible to use mobile devices as ECG terminals for healthcare professions such as physicians and health advisers, enabling them to inspect patient ECG recordings onsite efficiently without the need of a high-quality wide-area network (WAN) environment. This is very helpful to extend the use of onsite ECG monitoring in rural, outdoor or ambulatory Table 7 Power consumption for sequential and parallel algorithm on ECG data from 310 hospital
ECG no. Data loading The sequential The parallel
Energy (mWh) Power (mW) Energy (mWh) Power (mW) Energy (mWh)
1 6.84 1908.98 35.08 1845.93 12.48
2 6.36 1861.02 30.52 1841.35 11.5
3 6.65 1819.40 35.49 1807.44 12.86
4 6.55 1800.24 35.32 1811.56 11.21
5 6.96 1893.36 35.40 1818.13 12.83
6 6.12 1900.71 32.14 1805.11 11.82
7 6.22 1842.94 33.55 1858.84 12.44
situations. Moreover, the migration of ECG processing pipeline to mobile device without heavy CPU occupation paves the way for real-time identification of cardiac arrhythmias which is of great value in prevention of acute cardiovascular event (e.g., stroke and myo-cardial infractions). This would be the further direction of our research.
Authors’ contributions
XF and QY designed this study and performed literature review; YL was responsible for concept study; RC performed data preparation and analysis; YC guided the project and revised the writing of the final manuscript. All authors read and approved the final manuscript.
Author details
1 Shenzhen Institutes of Advanced Technology, Chinese Academy of Sciences, Shenzhen, China. 2 University of Chinese Academy of Sciences, Beijing, China. 3 Shenzhen Engineering Lab for Health Big Data Analytic Technologies, Shenzhen, China. 4 Key Lab for Health Informatics, Chinese Academy of Sciences, Shenzhen, China.
Acknowledgements
The authors would like to thank Liyan Yin, Shangguan Weihua, Huhe Dai, and other related members who developed the sequential automatic ECG classification algorithm. At the same time, the authors would appreciate Jun Wang who helped to generate the arrhythmia ECG records to validate the performance of the automatic ECG analysis algorithm.
Competing interests
The authors declare that they have no competing interests.
Availability of data and materials Not applicable.
Consent for publication
All authors approved the publication of this manuscript.
Ethics approval and consent to participate
The research involving patient data described in this paper were approved by the Shenzhen Institute of Advanced Technology (SIAT) Institutional Review Board (IRB Number: SIAT-IRB-151115-H0084).
Funding
This work was supported in part of the National High Technology Research and Development Plan (863 Plan: SS2015AA020109), the Science and Technology Planning Project of Guangdong Province (2015B010129012), the National Nature Science Foundation (61379136), the Shenzhen Science and Technology Projects
(JCYJ20170413161515911), Major Special Project of Guangdong Province (2017B030308007), and the Science and Tech-nology Service Network Plan (STS Plan) Project of Chinese Academy of Sciences (KFJ-SW-STS-161).
Publisher’s Note
Springer Nature remains neutral with regard to jurisdictional claims in published maps and institutional affiliations.
Received: 6 December 2017 Accepted: 23 April 2018
References
1. Menown I, Mackenzie G, Adgey A. Optimizing the initial 12-lead electrocardiographic diagnosis of acute myocardial infarction. Eur Heart J. 2000;21(4):275–83.
2. Pan J, Tompkins WJ. A real-time ORS detection algorithm. IEEE Trans Biomed Eng. 1985;3:230–6.
3. De Chazal P, O’Dwyer M, Reilly RB. Automatic classification of heartbeats using ecg morphology and heartbeat interval features. IEEE Trans Biomed Eng. 2004;51(7):1196–206.
4. Li C, Zheng C, Tai C. Detection of ECG characteristic points using wavelet transforms. IEEE Trans Biomed Eng. 1995;42(1):21–8.
5. Leski JM, Henzel N. Ecg baseline wander and powerline interference reduction using nonlinear filter bank. Signal Process. 2005;85(4):781–93.
6. Sun Y, Chan KL, Krishnan SM. ECG signal conditioning by morphological filtering. Comput Biol Med. 2002;32(6):465–79.
7. Slimane Z-EH, Naït-Ali A. QRS complex detection using empirical mode decomposition. Digit Signal Process. 2010;20(4):1221–8.
8. Chouakri S, Bereksi-Reguig F, Taleb-Ahmed A. QRS complex detection based on multi wavelet packet decomposi-tion. Appl Math Comput. 2011;217(23):9508–25.
9. Mazomenos EB, Biswas D, Acharyya A, Chen T, Maharatna K, Rosengarten J, Morgan J, Curzen N. A low-com-plexity ECGecg feature extraction algorithm for mobile healthcare applications. IEEE J Biomed Health Inform. 2013;17(2):459–69.
11. Cvetkovic D, Übeyli ED, Cosic I. Wavelet transform feature extraction from human PPG, ECG, and EEG signal responses to elf pemf exposures: a pilot study. Digit Signal Process. 2008;18(5):861–74.
12. Li P, Wang Y, He J, Wang L, Tian Y, Zhou T-S, Li T, Li J-S. High-performance personalized heartbeat classification model for long-term ECG signal. IEEE Trans Biomed Eng. 2017;64(1):78–86.
13. Liang W, Zhang Y, Tan J, Li Y. A novel approach to ECG classification based upon two-layered HMMS in body sensor networks. Sensors. 2014;14(4):5994–6011.
14. Ye C, Kumar BV, Coimbra MT. Heartbeat classification using morphological and dynamic features of ECG signals. IEEE Trans Biomed Eng. 2012;59(10):2930–41.
15. de Oliveira LS, Andreão RV, Sarcinelli-Filho M. Premature ventricular beat classification using a dynamic Bayesian network. In: IEEE EMBC annual international conference of the engineering in medicine and biology Society; 2011. p. 4984–7.
16. Lagerholm M, Peterson C, Braccini G, Edenbrandt L, Sornmo L. Clustering ECG complexes using hermite functions and self-organizing maps. IEEE Trans Biomed Eng. 2000;47(7):838–48.
17. De Lannoy G, François D, Delbeke J, Verleysen M. Weighted conditional random fields for supervised interpatient heartbeat classification. IEEE Trans Biomed Eng. 2012;59(1):241–7.
18. Yu S-N, Chen Y-H. Electrocardiogram beat classification based on wavelet transformation and probabilistic neural network. Pattern Recognit Lett. 2007;28(10):1142–50.
19. Li P, Wang Y, Tian Y, Zhou T-S, Li J-S. An automatic user-adapted physical activity classification method using smart-phones. IEEE Trans Biomed Eng. 2017;64(3):706–14.
20. Ryoo D-W, Bae C. Design of the wearable gadgets for life-log services based on UTC. IEEE Trans Consumer Electron. 2007;53(4):1477–82.
21. Wang L-H, Hsiao Y-M, Xie X-Q, Lee S-Y. An outdoor intelligent healthcare monitoring device for the elderly. IEEE Trans Consumer Electron. 2016;62(2):128–35.
22. Fan X, Yao Q, Cai Y, Li Y. An efficient automatic electrocardiogram analysis method using smartphones. In: IEEE inter-national conference on Consumer Electronics (ICCE); 2018.
23. Hong J-H, Ahn Y-H, Kim B-J, Chung K-S. Design of opencl framework for embedded multi-core processors. IEEE Trans Consumer Electron. 2014;60(2):233–41.
24. Berjon D, Cuevas C, Moran F, Garcia N. GPU-based implementation of an optimized nonparametric background modeling for real-time moving object detection. IEEE Trans Consumer Electron. 2013;59(2):361–9.
25. Chavan MS, Agarwala R, Uplane M. Suppression of baseline wander and power line interference in ECG using digital IIR filter. Int J Circ Syst Signal Process. 2008;2(2):356–65.
26. Chiarugi F, Sakkalis V, Emmanouilidou D, Krontiris T, Varanini M, Tollis I. Adaptive threshold GRS detector with best channel selection based on a noise rating system. In: IEEE computers in cardiology; 2007. p. 157–60.
27. Zhang F, Lian Y. QRS detection based on multiscale mathematical morphology for wearable ECG devices in body area networks. IEEE Trans Biomed Circ Syst. 2009;3(4):220–8.
28. Drew BJ, Califf RM, Funk M, Kaufman ES, Krucoff MW, Laks MM, Macfarlane PW, Sommargren C, Swiryn S, Van Hare GF. Practice standards for electrocardiographic monitoring in hospital settings. Circulation. 2004;110(17):2721–46. 29. Tan Y, Du L. Study on automatic analysis technology for dynamic ECG (electrocardiogram) signal. Microcomput Inf.
2009;18:235–7.
30. Prineas RJ, Crow RS, Zhang Z-M. The minnesota code manual of electrocardiographic findings. Berlin: Springer; 2009. 31. Niederhauser T, Wyss-Balmer T, Haeberlin A, Marisa T, Wildhaber RA, Goette J, Jacomet M, Vogel R.
Graphics-proces-sor-unit-based parallelization of optimized baseline wander filtering algorithms for long-term electrocardiography. IEEE Trans Biomed Eng. 2015;62(6):1576–84.
32. Mark R, Schluter P, Moody G, Devlin P, Chernoff D. An annotated ECG database for evaluating arrhythmia detectors. IEEE Trans Biomed Eng. 1982;29:600.
33. Eager DL, Zahorjan J, Lazowska ED. Speedup versus efficiency in parallel systems. IEEE Trans Comput. 1989;38(3):408–23.