R E S E A R C H
Open Access
A novel method for the quantification of key
components of manual dexterity after stroke
Maxime Térémetz
1*, Florence Colle
2,3, Sonia Hamdoun
2, Marc A. Maier
1,4and Påvel G. Lindberg
1,3Abstract
Background:A high degree of manual dexterity is a central feature of the human upper limb. A rich interplay of sensory and motor components in the hand and fingers allows for independent control of fingers in terms of timing, kinematics and force. Stroke often leads to impaired hand function and decreased manual dexterity, limiting activities of daily living and impacting quality of life. Clinically, there is a lack of quantitative multi-dimensional measures of manual dexterity. We therefore developed the Finger Force Manipulandum (FFM), which allows quantification of key components of manual dexterity. The purpose of this study was (i) to test the feasibility of using the FFM to measure key components of manual dexterity in hemiparetic stroke patients, (ii) to compare differences in dexterity components between stroke patients and controls, and (iii) to describe individual profiles of dexterity components in stroke patients.
Methods:10 stroke patients with mild-to-moderate hemiparesis and 10 healthy subjects were recruited. Clinical measures of hand function included the Action Research Arm Test and the Moberg Pick-Up Test. Four FFM tasks were used: (1) Finger Force Tracking to measure force control, (2) Sequential Finger Tapping to measure the ability to perform motor sequences, (3) Single Finger Tapping to measure timing effects, and (4) Multi-Finger Tapping to measure the ability to selectively move fingers in specified combinations (independence of finger movements). Results:Most stroke patients could perform the tracking task, as well as the single and multi-finger tapping tasks. However, only four patients performed the sequence task. Patients showed less accurate force control, reduced tapping rate, and reduced independence of finger movements compared to controls. Unwanted (erroneous) finger taps and overflow to non-tapping fingers were increased in patients. Dexterity components were not systematically related among each other, resulting in individually different profiles of deficient dexterity. Some of the FFM
measures correlated with clinical scores.
Conclusions:Quantifying some of the key components of manual dexterity with the FFM is feasible in moderately affected hemiparetic patients. The FFM can detect group differences and individual profiles of deficient dexterity. The FFM is a promising tool for the measurement of key components of manual dexterity after stroke and could allow improved targeting of motor rehabilitation.
Keywords:Stroke, Hand, Finger, Dexterity, Force, Finger tapping, Independence of finger movements
* Correspondence:[email protected] 1
FR3636 CNRS, Université Paris Descartes, Sorbonne Paris Cité, 75006 Paris, France
Full list of author information is available at the end of the article
Background
Manual dexterity can be considered as the ability to per-form accurate and coordinated hand and finger move-ments, such as fine control in grasping and manipulating small objects. Across species, manual dexterity is most evolved in humans [1]. This high degree of manual dexter-ity is made possible by specializations in hand morphology (skeletal, muscular) and neural control (corticospinal tract) [2]. Together these specializations allow for purposeful goal- and object-oriented manual control. There is, how-ever, no consensus on how dexterity should be operation-ally defined and quantified. Although historicoperation-ally an‘index of dexterity’was developed (mainly for phylogenetic consid-erations [3]), it has become clear that behavioral dexterity cannot be defined by a single variable. Consequently, sev-eral studies have outlined key components of manual dex-terity in terms of motor control: (i) Control of force, such as the capacity to control the force in each finger [4], in precision grip [5], in power grip [6, 7] and during grasp-and-lift tasks [8], (ii) Finger independence, i.e. the capacity to move the fingers independently of each other [9, 10]. (iii) Timing aspects, illustrated by the capacity to synchronize finger movements [11] and (iv) Motor sequence perform-ance, i.e., activation of different fingers in a temporal se-quence [12, 13]. However, a simultaneous description of such components is lacking in patients with neurological upper limb impairments.
Stroke is the first cause of acquired handicap in adults and about 50 % of stroke survivors have im-paired upper limb and hand function in the chronic phase [14, 15], which impacts strongly on activities of daily living and on independence. Most of the above outlined dexterity components have been studied in stroke patients: (i) In terms of force control: post-stroke upper limb weakness is prevalent [14, 16, 17] and a decrease of accuracy in force control has also been reported (power grip [18]; precision grip: [19]; grasp-and-lift tasks: [20, 21]). (ii) Studies have also shown decreased independence of finger movements and increased motor overflow after stroke [22, 23]. (iii) Timing is also impaired after stroke: repetitive finger movements are slowed down and regularity is de-creased [24–26]. (iv) Execution of sequential finger movements can also be compromised in stroke [27]. Therefore, manual dexterity can be impaired by decreased control of force, lower independence of finger movements, slowed timing or deficient finger sequencing.
In spite of evidence of impaired components of dexter-ity, clinical practice in terms of diagnosis and treatment of manual dexterity relies essentially on‘functional’ mea-sures and scales. Although largely applied, some of these scales are subjective, show questionable validity and reli-ability [28, 29] and some have high measurement error [30]. This may hamper detection and evaluation of motor
deficits and affect evaluation of spontaneous or treatment-specific recovery [31, 32]. Most critically: usually these methods assess only one of the components of dexterity. It remains therefore unclear to what degree each of these components is affected in hemiparetic patients with im-paired hand function.
In this study, we aimed at quantifying key components of manual dexterity and to describe how these compo-nents are affected after stroke. To this purpose we devel-oped a new device (the Finger Force Manipulandum, FFM) designed to quantitatively assess several key com-ponents of dexterity. The objectives of the study were (i) to test the feasibility of using the FFM to assess manual dexterity components in stroke patients with impaired upper limb function, (ii) to investigate differences be-tween stroke patients and healthy subjects, and (iii) to describe individual profiles of key components of man-ual dexterity in stroke patients.
Methods Subjects
Ten adult stroke patients were recruited at the Rehabili-tation clinic at Sainte-Anne Hospital, Paris. All patients suffered from a single ischemic or hemorrhagic stroke and were at least 2 weeks post-stroke at the time of their participation to the study. Included patients had varying degrees of hemiplegia affecting the upper limb and the hand. Exclusion criteria comprised severe loss of sensa-tion of the affected limb, other neurological condisensa-tions and cognitive dysfunction that would interfere with the understanding of the experiment, such as visual deficits or severe neglect. Ten healthy control subjects, compar-able in age, were also recruited. Tcompar-able 1 lists the demo-graphic and clinical details. The procedures of the study complied with the Declaration of Helsinki, and subjects provided informed consent.
Clinical measures
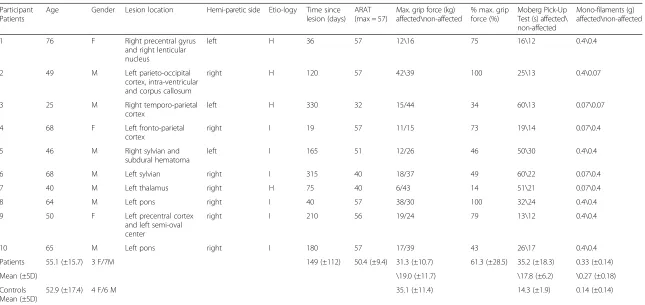
Table 1Clinical measures
Participant Patients
Age Gender Lesion location Hemi-paretic side Etio-logy Time since lesion (days)
ARAT (max = 57)
Max. grip force (kg) affected\non-affected
% max. grip force (%)
Moberg Pick-Up Test (s) affected\ non-affected
Mono-filaments (g) affected\non-affected
1 76 F Right precentral gyrus
and right lenticular nucleus
left H 36 57 12\16 75 16\12 0.4\0.4
2 49 M Left parieto-occipital
cortex, intra-ventricular and corpus callosum
right H 120 57 42\39 100 25\13 0.4\0.07
3 25 M Right temporo-parietal
cortex
left H 330 32 15/44 34 60\13 0.07\0.07
4 68 F Left fronto-parietal
cortex
right I 19 57 11/15 73 19\14 0.07\0.4
5 46 M Right sylvian and
subdural hematoma
left I 165 51 12/26 46 50\30 0.4\0.4
6 68 M Left sylvian right I 315 40 18/37 49 60\22 0.07\0.4
7 40 M Left thalamus right H 75 40 6/43 14 51\21 0.07\0.4
8 64 M Left pons right I 40 57 38/30 100 32\24 0.4\0.4
9 50 F Left precentral cortex
and left semi-oval center
right I 210 56 19/24 79 13\12 0.4\0.4
10 65 M Left pons right I 180 57 17/39 43 26\17 0.4\0.4
Patients 55.1 (±15.7) 3 F/7M 149 (±112) 50.4 (±9.4) 31.3 (±10.7) 61.3 (±28.5) 35.2 (±18.3) 0.33 (±0.14)
Mean (±SD) \19.0 (±11.7) \17.8 (±6.2) \0.27 (±0.18)
Controls Mean (±SD)
52.9 (±17.4) 4 F/6 M 35.1 (±11.4) 14.3 (±1.9) 0.14 (±0.14)
For each stroke patient is indicated: age, gender, lesion location, hemiparetic side, etiology (type of stroke: H = hemorrhagic; I = ischemic), time since lesion (days), total ARAT (Action Research Arm Test) score, MVC grip force in kg in the hemiparetic and non-affected hand, % MVC in the hemiparetic hand compared to the non-paretic hand, performance of the Moberg pick-up Test (time in s) for both hands, % of proprioception, and tactile sensibility (Semmes-Weinstein mono-filament test) for both hands. Bottom two lines: mean and standard deviation in stroke patients and control subjects
al.
Journal
of
NeuroEng
ineering
and
Rehabilitatio
n
(2015) 12:64
Page
3
of
eyes shut and rated as intact, impaired or absent. All mea-sures were also obtained in control subjects, except the ARAT.
Finger Force Manipulandum (FFM)
Together with Sensix (www.sensix.fr) we developed the Finger Force Manipulandum (FFM) in order to quantify key components of manual dexterity in stroke (and other) patients. The FFM is equipped with four pistons positioned under the tip of the index, middle, ring and little finger, each coupled to an individual strain gauge force sensor (Fig. 1). The height of the pistons can be adjusted but in this study we used a constant piston height of 15 mm across all subjects. Pistons have a con-tact surface of 15 mm diameter and are 20 mm apart. With increasing force the pistons move against a spring load over a range of 10 mm. The end of this dynamic (non- static) range is reached with 1N. Above 1N, forces are controlled isometrically. Thus each sensor measures force along the piston axis exerted from each finger in-dependently. The precision of the sensor is <0.01N, with a range of 0–9N. Force data of each finger was sampled to a CED 1401 (with 10 kHz sampling rate/digit) con-nected to a computer running Spike 2v6 (Cambridge Electronic Design, www.ced.co.uk) software. Custom-written CED scripts provided real-time visual display of digit forces and target instructions or target forces.
FFM tasks
Four separate tasks (i-iv) were developed in order to quantify different components of manual dexterity. The finger force tracking task was developed in order to measure the capacity to generate and control fingertip forces [18]. The sequential finger tapping task was devel-oped in order to assess the ability to learn and recall fin-ger movement sequences [37]. The single finfin-ger tapping task is a timing task designed to test the capacity to
perform repetitive tapping with and without auditory cues [9]. The multi-finger tapping task was designed to test the independence of finger movements in one-finger configurations [22, 38] and two-finger configurations. Each of the four tasks comprised different conditions in order to evaluate performance across varying forces, tap-ping frequencies, and fingers. In all tasks the subject was first required to place the fingers on the pistons and was instructed to maintain the fingers on the pistons throughout the tasks. Every subject was able to use the FFM with the forearm supported on the table and the shoulder was in a relaxed slightly flexed position. To en-sure a comfortable position some subjects used a sili-cone wrist support during the tasks.
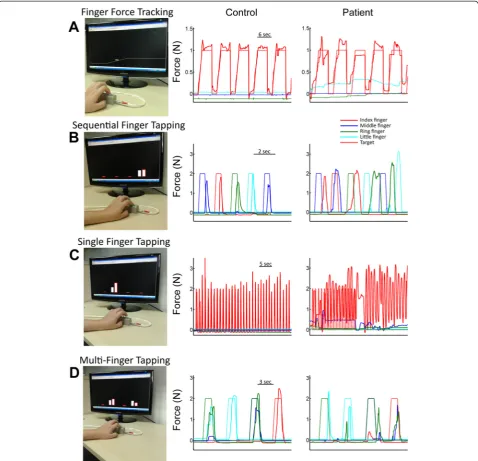
(i) The Finger Force-Tracking task is a visuo-motor task of finger force control. By varying the force on the piston with the finger, the subject controlled a cursor on a computer screen (Fig. 2a). The subject was instructed to follow the target force as closely as possible with the cursor. The target force (a line) passed from right to left over the screen, presenting successive trials. Each trial consisted of a ramp phase (a linear increase of force over a 1.5 s period), a hold phase (a stable force for 4 s) and a release phase (an instantaneous return to the resting force level, 0N) followed by a resting phase (2 s). Trials were repeated 24 times, distributed in four blocks of 6 trials, two blocks with a target force of 1N and two with a target force of 2N. These low absolute forces were chosen since dexterous action usually employs low forces at which key sensory events occur [39]. In this study, patients performed the finger force-tracking task separately with the index and the middle finger of their hemiparetic hand and controls performed the task with their index and middle finger of their right hand. Task duration was 3 min 20 s/digit.
(ii) TheSequential finger tappingtask is a 5-tap finger sequence involving the four digits. The visual display consisted of 4 columns (representing the 4 digits), whose height varied in real-time as a function of exerted finger force (feedback). In addition, a target column (cue) adja-cent to each feedback column indicated the piston to be pressed (Fig. 2b). The subject was instructed to press the indicated piston as soon as the target appeared. The 5 successive targets of a given sequence appeared at a rate of 1 Hz. Each sequence was repeated 10 times with vis-ual cues (learning phase) and then repeated 5 times from memory, i.e. without cues, and as quickly as possible (re-call phase). Force feedback was always present. Subjects were instructed to match the tap force approximately to target of 2N (same for the other tapping tasks). In this protocol, the subjects performed three previously un-known motor sequences: they first learned and then re-peated the sequence (A) 2-5-3-4-2 (2 = index; 5 = little); then the sequence (B) 4-3-5-2-4 and finally the sequence Fig. 1The Finger Force Manipulandum (FFM). Index, middle, ring
(C) 3-2-4-5-3. A single sequence (trial) of 5 taps lasted 5 s and the duration for all 15 trials was 2 min 20 s.
(iii) TheSingle finger tappingtask consisted of repeti-tive tapping with one finger with or without an auditory cue. The visual display was similar to that in task (ii) and indicated which finger to tap but did not provide any timing cue. Three tapping rates were tested: 1, 2 and 3Hz (similar to [9]). After the cued tapping period (15 taps) the subject was required to continue tapping for a similar period, without cue but at the same rate. The subject started at 1 Hz with the index finger, followed by the middle (Fig. 2c), ring and little finger. This protocol was repeated at 2 Hz and then at 3 Hz. The total duration of this task was 4 min.
(iv) The Multi-finger tapping task consisted of simul-taneous tapping with different finger configurations in response to visual instructions. The visual display was similar to that in task (ii) and (iii). Subjects were instructed to reproduce 11 different finger tap configura-tions following the visual cue (Fig. 2d). The 11 different configurations consisted of 4 one-finger taps (separate tap of index, middle, ring or little finger), 6 two-finger configurations (simultaneous index-middle, index-ring, index-little, middle-ring, middle-little or ring-little finger taps), and one four-finger tap. All configurations were performed twice resulting in a total of 32 (4 × 8) one-finger taps, 30 (6 × 5) two-one-finger taps and 2 four-one-finger taps. Performance measures were calculated for one and two-finger configurations. Four finger taps were not ana-lyzed. The order of the configurations was pseudo-randomized with equal number of transitions between one and two-finger taps. The entire task with its 64 trials lasted 4 min and 40 s.
Data analysis
Task performance was analyzed using Matlab (v7.5, The MathWorks, Inc., Natick, MA, USA). The four force sig-nals were first down-sampled to 100 Hz for the analysis.
Finger force tracking: all performance measures were cal-culated trial-by-trial (N = 24). Tracking error was calcu-lated as the root-mean-square error (RMSE) between the actual applied force and the target force. The error was separately extracted during the ramp and the hold phase. The time of the force onset in response to the target ramp and the time of the release onset at the end of the hold phase were calculated as threshold crossings of dF/dt. The release duration was computed as the time taken to reduce the force from 75 to 25 % of the target force [18]. The co-efficient of variation (CV) of force (i.e. SD/mean across time bins) was calculated during the hold phase and aver-aged across trials. Mean force during the hold was calcu-lated as the average force across 3 s excluding the first and last 500 ms of the hold phase. Mean baseline force was calculated as the average force during the resting phase
between each trial from 1500 ms to 500 ms before the ramp onset.
For thethree tappingtasks the finger taps were identified in a similar way. Starting from the force trace each tap was identified as a discrete event according to threshold (>0.5N) allowing identification of target and the applied force peaks (retained as taps). The time location and ampli-tude of each tap were then recorded. Subsequently, the fol-lowing task-specific performance variables were obtained:
In the Sequential finger tappingtask we computed the number of user taps trial-by-trial, i.e. for each 5-tap target sequence. By comparing the user taps to the target se-quence, each trial was then labeled as correct or incorrect. In case of an incorrect sequence the number of missing or additional unwanted taps was recorded, as well as the number of consecutive correct taps within parts of the se-quence. Furthermore, performance was calculated across trials, by computing the number of correct trials and the number of error taps for each finger. These measures were obtained for the learning and the recall phase, respectively. In thesingle finger tappingtask the lead-finger (target finger) and the non-lead-fingers were identified in each condition (finger and 1, 2 or 3 Hz). For the lead-finger the number of taps, the tap amplitude, and the interval between consecutive taps were calculated for each con-dition. Unwanted taps were identified in the non-lead-fingers and labeled as overflow taps (non-lead-finger tap at the same time as a lead-finger tap) or as unwanted finger taps (non-finger tap in the absence of a lead-finger tap). To estimate the capability to adapt the tapping rate to the target frequency of the cue we calcu-lated the slope of the tapping rate across the 1 Hz, 2 Hz and 3 Hz conditions. A slope = 1 indicates correct tap-ping rate, a slope < 1 slower execution.
In themulti-finger tappingtask each tap, in response to a displayed finger configuration, was identified as correct or incorrect (success rate), i.e. identical to or different from the required target taps. Errors, in each finger, were categorized as missing taps (omissions, omission rate), or as unwanted extra-finger-taps (one or several) (similar to errors reported in keyboard typing [40]). Across trials the number of errors was evaluated as a function of the target (one- or two-) finger configuration.
Finally, in order to obtain individual profiles of com-ponents of manual dexterity, we plotted each patient's performance in the six most discriminatory variables (showing group differences) and compared it to the per-formance range observed in the control group. Values be-yond the control group's mean + 2SD in a given measure were considered indicative of pathological performance.
Statistical analysis
Descriptive statistics are shown as mean ± SD. Student’s
single-level variables. Differences in the measures obtained from the four tasks described above were tested using repeated measures ANOVAs. (i) Force tracking: independent vari-ables (error, timing, etc.) were studied with ANOVA including one between-group factor GROUP (patients, controls), and three within-subject levels: FINGER (index, middle), FORCE (1N, 2N), PHASE (Ramp, Hold). (ii) Se-quential finger tapping: independent variables (success rate, number of correct taps) were studied with ANOVA includ-ing one between-group factor GROUP (patients, controls), and two within-subject levels: SEQUENCE (sequence A, B, C), PHASE (learning and recall phase). (iii) Single finger tapping: independent variables (tapping rate, number of overflow taps, etc.) were studied with ANOVA including one between-group factor GROUP (patients, controls), and three within-subject levels: FREQUENCY (1, 2, 3 Hz), FINGER (index, middle, ring, little) and PHASE (with auditory cue, without auditory cue). (iv) Multi-finger tap-ping: independent variables (success rate, number of un-wanted extra finger taps, etc.) were studied with ANOVA including one between-group factor GROUP (patients, controls). Post-hoc tests were performed using Fisher LSD Test. Spearman’s rank order correlation was used to inves-tigate correlations between performance measures and clinical scores. Jamar and Moberg Pick up scores were pre-sented as % of non-hemiparetic hand scores for correlation tests. Pearson’s correlation was used to test for relations be-tween different performance measures. The level of signifi-cance was set to p < 0.05.
Results
Clinical assessment of hand and finger function
In stroke patients maximal power grip force in the par-etic hand was significantly reduced to a mean of 19 kg compared to 35 kg in controls (P = 0.005). According to the ARAT, none of the patients were severely impaired (score < 5), five patients had moderately impaired hand function (51 < score < 57), and five scored the maximal 57 points [41]. However, three of these latter patients had reduced maximal grip force and four were slower in the pick-up test with the affected hand (Table 1). Sen-sory thresholds in the fingers were also significantly de-creased in stroke patients (Table 1; P = 2 × 10⁻¹⁰) but only patient 3 had impaired proprioception.
Task feasibility
All ten patients were able to accomplish the force tracking task and the single finger tapping tasks, and nine patients completed the multi finger tapping task. However, only four patients achieved the sequential tapping task since the rate of the target cue presentation (1 Hz) during the learning phase was too high. The main issues affecting feasibility were: maintaining all four fingers on the pistons and the sequential tapping task being too fast (Table 2).
Force tracking
Patients and controls applied the same amount of force during the hold phase in 1N (controls: 0.98N ± 0.2; pa-tients: 1.1N ± 0.2; P = 0.24) and 2N conditions (controls: 1.9N ± 0.4; patients: 2.0N ± 0.2; P = 0.36). This task re-vealed dramatic differences in the precision of force con-trol: stroke patients showed increased tracking error (0.31N ± 0.1) compared to controls (0.13N ± 0.06). This difference was highly significant (GROUP effect: F = 21.18; P = 0.0002; Fig. 3a) and was apparent during both the ramp and hold phases, and at both force levels (P = 0.01). Performance was equally impaired when using the index or the middle finger. Furthermore, time taken to release force at the end of the hold period (Fig. 3b) was signifi-cantly prolonged (about six times longer) in stroke pa-tients (702 ms ± 557) compared to controls (123 ms ± 84) (GROUP effect: F = 5.03; P = 0.014). Patients also showed difficulty in not applying force (relaxing) with the lead-finger during the baseline (i.e. between trials, see Fig. 2a). The mean baseline force (Fig. 3c) was significantly differ-ent and about four times higher in patidiffer-ents (0.28N ± 0.21) compared to controls (0.07N ± 0.09; GROUP effect: F = 4.10; P = 0.028).
Some measures did not reveal any significant differ-ence between groups: this was the case for the timing of the force onset (prior to the ramp) and for the release onset (at the end of the hold phase). Also the CV of tracking force was similar in the two groups.
Sequential finger tapping
Single finger tapping
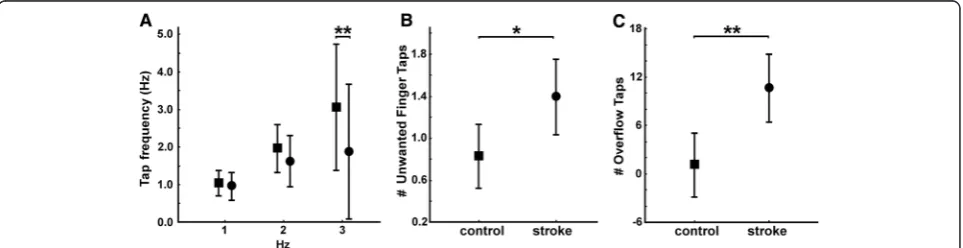
We measured the average single finger tapping rate, cu-mulated over the cued and the non-cued condition (Fig. 5a). Controls were able to follow the imposed tapping rate, with a mean rate of 1.06 Hz ± 0.06, 1.98 Hz ± 0.13 and 3.17 Hz ± 0.47 for the 1, 2 and 3 Hz condition, re-spectively. The tapping rate was impaired in patients, with
a reduced tapping rate of 2.31Hz ± 0.69 at the 3 Hz con-dition compared to controls (GROUPxFREQUENCY ef-fect: F = 9.30; P < 0.001; post-hoc GROUP effect at 3 Hz: P < 0.001; but not at 1 or 2 Hz). Thus, patients had a de-creased slope of tapping rate (1-3Hz) in all four fingers, with a grand average across fingers of 0.53 ± 0.36 com-pared to controls (1.05 ± 0.24; T =−11.2; P = 2 × 10 -9). Table 2FFM ergonomic and task feasibility in hemiparetic patients
Patients Ergonomic difficulties with the FFM device Task feasibility Problem encountered
Arm posture Finger position Interaction with computer
Finger force tracking
Sequential finger tapping
Single finger tapping
Multi-finger tapping
1 no Maintaining little finger on piston (short little finger)
Difficulties to interact with the computer feedback
yes no yes no Too fast and difficult (sequence)
Failed to use computer feedback (sequence and tapping)
2 no no no yes yes yes yes /
3 Maintaining wrist extension (flexor spasticity)
Fingers slide on pistons (flexor spasticity)
no yes no yes yes Too fast and difficult
(sequence)
4 no Maintaining little
finger on piston (short little finger)
no yes no yes yes Too fast and difficult
(sequence)
5 no no Difficulties to interact
with the computer feedback
yes no yes yes Too fast and difficult (sequence)
Failed to use computer feedback (sequence)
6 Maintaining wrist extension (weak extensor)
Maintaining fingers on pistons (adductor spasticity)
no yes no yes yes Too fast and difficult
(sequence)
7 no Maintaining little finger on piston (contracture of little finger)
no yes no yes yes Too fast and difficult
(sequence)
8 no Maintaining fingers on pistons (repositioning)
no yes yes yes yes /
9 no no no yes yes yes yes /
10 no no no yes yes yes yes /
Feasibility 8/10 4/10 8/10 10/10 4/10 10/10 9/10 /
Indicated are for each patient: qualitative observations in terms of ergonomic feasibility and task feasibility
There was no difference in tapping rate between the cued and non-cued condition and no difference between fin-gers. No significant difference between groups was found in the tapping regularity, i.e., for the mean tap interval.
Unwanted finger taps occurred rarely during single finger tapping, i.e. a tap of a non-lead finger in the absence of a lead-finger tap. Per condition (Frequency/Finger: 35 taps) this occurred on average 0.8 times (0.8 taps/35) in controls, but significantly more often (1.4 taps/35) in pa-tients (Fig. 5b, GROUP effect: F = 6.60; P = 0.021).
In patients the single finger tapping task also produced substantial unwanted motor overflow to fingers not in-volved in the task (i.e., non-lead finger taps concomitant with lead-finger taps). Patients showed significantly more overflow taps than controls (Fig. 5c, GROUP effect: F = 12.16; P = 0.003). At 1Hz patients made on average 10 extra overflow taps per condition (frequency/finger: for a total of 35 required taps) compared to a single overflow
tap in controls. In both groups overflow taps were least fre-quent when the index or little finger acted as lead finger.
Multi-finger tapping task
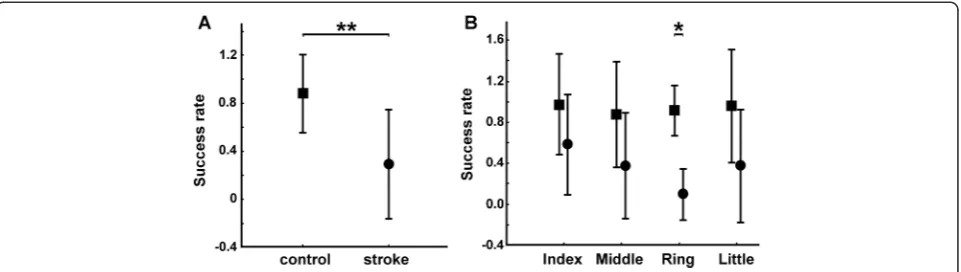
We first computed the average success rate across single- and two-finger combinations. Patients with a mean success rate of 0.3 ± 0.2 were less accurate com-pared to control subjects with a mean success rate of 0.9 ± 0.1 (Fig. 6a, GROUP effect: P = 4 × 10⁻¹⁰). This group difference was present in both one- and two-finger combinations (P = 3 × 10⁻⁷ and P = 1 × 10⁻⁷, respectively).
For one-finger taps, a FINGER × GROUP interaction was found (Fig. 6b, FINGER × GROUP effect: F = 5.90; P = 0.002). Posthoc testing showed significantly lower success rate in all four fingers in patients compared to controls with the ring finger most affected (with a suc-cess rate close to 0.1 for patients compared to 0.9 for Fig. 4Sequential finger tapping. Group comparison between control subjects (square) and stroke patients (circle).aMean success rate across all trials (learning and recall, sequence A, B and C) of the sequential finger tapping task. A success rate of 1 indicates perfect performance.bMean number of correct taps (max = 5) for the first half (‘1’) and the second half (‘2’) of the learning phase of for each sequence (A, B and C). Note: patients and controls had similar numbers of correct taps at the first half of sequence A, controls subsequently increased their performance significantly (+++). In controls, learning during sequence A improved initial performance in subsequent sequences B and C: they had significantly more correct taps at the first halves of the sequences B and C (B: P = 0.04; C: P = 0.03) compared to patients. Significant differences between and within groups are indicated
controls; P = 2 × 10⁻⁹). For each failed one- or two-finger trial, we computed two types of errors: the omission rate and the number of unwanted extra-finger-taps. The omission rate was significantly greater in patients (0.2 ± 0.17) compared to controls (0.01 ± 0.01; GROUP effect: F = 12.24; P = 0.003). For one-finger conditions, a FINGER × GROUP interaction was found (FINGER × GROUP effect: F = 3.38; P = 0.03). Posthoc testing showed significantly higher omission rate in the ring and the little fingers in patients (with an omission rate close to 0.2 and 0.4 for patients compared to 0.01 for controls; P = 0.03 and P = 3 × 10⁻⁵). Summed across trials and fin-gers, unwanted extra-finger-taps were more frequent in patients (54 ± 24.1) than in controls (7.9 ± 6.9; T = 5.52; P = 0.0003).
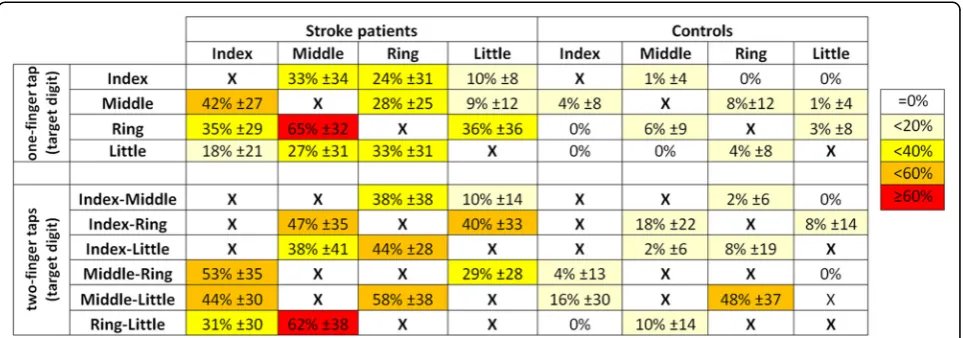
The distribution of unwanted extra-finger-taps across fingers is shown in Fig. 7 for both one- and two-finger combinations. Each line in the Table shows the occur-rence of unwanted extra-finger-taps as a function of fin-ger combination. For every target combination, patients produced more error in other fingers than control sub-jects. In the least successful one-finger combination (the ring finger target tap) patients erroneously activated also the middle finger in more than sixty percent of the trials, while this was the case in less than ten percent in con-trols (Fig. 7). Note that the index and little finger also made errors in this condition, but less frequently (in about 35 %) than the middle finger. This same error pat-tern across fingers (i.e. middle finger error > index or little finger error) was also present in control subjects, but in an attenuated form. More generally, the pattern of unwanted extra-finger-taps formed a ‘neighborhood’ gradient, such that digits anatomically far from the tar-get (lead) digit produced less error taps than those closer to (or immediate neighbors of ) the target digit. This also held for the ‘2–3’ and ‘4–5’ two-finger combinations. Two-finger combination taps of non-adjacent digits (‘2– 4’,‘2–5’,‘3–5’), showed, in absence of a distance gradient,
a balanced error distribution. Similar but attenuated
‘across’ finger error patterns were also observed for the control subjects.
Individual dexterity profiles
Individual profiles were investigated in six measures found to differ significantly between groups. From the tracking task we studied error and release duration. From the single-finger tapping task, slope of tapping rate and number of overflow taps were retained. And from the multi-finger tapping task, omission rate and frequency of unwanted extra-finger-taps were assessed. Although sig-nificant group differences were found in several dexterity components, not all measures were pathological in all pa-tients (above mean + 2SD threshold). For example, only 6 (of 10) patients showed pathological tracking error (Fig. 8a). Furthermore, only 3 patients (P03, P05, P06) showed patho-logical scores in all 6 measures. Thus, the presence of a pathological score in one variable did not always coincide with the presence of pathological scores in other measures. Neither did absence of one pathological score indicate ab-sence in all other scores. The most common profile (in 4 patients) was a combination of five affected dexterity com-ponents: release duration, tracking error, number of over-flow taps, omission rate and unwanted extra-finger-taps. These five components were increased compared to control thresholds.
Relations and correlations with clinical measures
tapping task and one in the single finger tapping task (high number of overflow taps). P02 and P08 had patho-logical scores for two scores of the multi-finger tapping task, but not in the other tasks. Finally, P01 had patho-logical performance in the two measures of the force tracking task only.
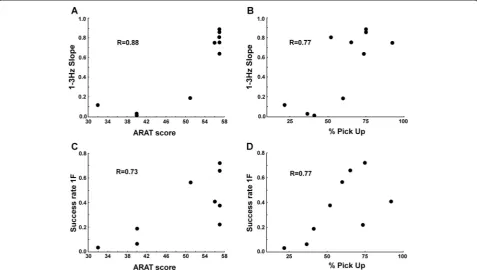
We tested for correlations between the obtained per-formance measures in the FFM tasks and the ARAT or the Moberg pick-up test scores. Single finger tapping 1-3Hz slope appeared to be correlated with the ARAT score (Fig. 9a, R = 0.88; P = 0.0003) and with %Pick Up scores (Fig. 9b, R = 0.77; P = 0.004). The higher the slope during the single finger tapping task, the better were their ARAT or Pick Up scores. Multi-finger tapping success rate also appeared to be correlated with the ARAT score (Fig. 9c, R = 0.73; P = 0.03) and with %Pick Up (Fig. 9d, R = 0.77; P = 0.02). Again, a higher success rate in the multi-finger tapping task was found in patients with higher ARAT or %Pick Up scores. For the Finger force tracking task we did not find any correlations between performance variables and clinical measures. We also tested the inter-relations between the 6 measures used for the description of the dexterity profiles and we found four significant corre-lations among the 15 comparisons (Table 3). The strongest correlation was between 1-3Hz slope and the unwanted extra-finger-taps (1F) (R2= 0.55).
Discussion
We developed a novel device to quantify manual dex-terity in a clinical context. This study shows that this device (the ‘FFM’) allows for the quantification of key control variables of manual dexterity in healthy subjects and in stroke patients. The patients tested in this study were able to use the FFM and performed most of the
tasks suggesting adequate feasibility of the new method. Performance was impaired in all four visuo-motor tasks: patients showed less accurate force control, slo-wed finger tapping rate, more error in finger selection and in sequential finger tapping. We also found that pa-tients were not equally affected across different compo-nents of manual dexterity which suggests the presence of individual dexterity profiles. These findings will be dis-cussed in turn below.
Feasibility
Healthy subjects had no problems performing the tasks and our mild-to-moderately affected hemiparetic pa-tients were able to accomplish three out of the four visuo-motor tasks. However, the sequential finger tap-ping task proved difficult for stroke patients, presumably due to an inadequate (too high) task velocity. In terms of ergonomics, patients sometimes encountered prob-lems in maintaining their fingers on the pistons, mostly for the little finger. This led some patients to look at their fingers, rather than at the screen, in order to replace them on the pistons. This problem could in part be due to decreased tactile sensitivity, shown by the Semmes-Weinstein test. The FFM allowed identification of decreased performance in at least one dexterity component in all patients (Fig. 8). Even in patients with maximal ARAT scores (N = 5) and in patients with normal Moberg Pick-up times (<18 s, N = 2) the FFM revealed deficient manual dexterity components, coherent with Lang et al. [42]. Although preliminary, given the small sample size, this suggests that the FFM may be more sensitive than other clinical measures in detecting underlying impairments important for dexterity in patients after stroke.
Task performance: group differences between healthy subjects and hemiparetic patients
For thetrackingtask, which requires control of force, we found increased finger tracking error and longer release duration in patients, consistent with previous reports on power grip force control [18, 43]. Patients did not show higher force variability (CV of force) as previously re-ported [43]. However, this agrees with findings that did not show increased CV when stroke patients performed power grip force tracking at similar absolute forces as the controls [18].
The sequential finger tapping task, which requires motor learning of sequential digit selection, was too dif-ficult for most patients. However, four patients were able to complete the task, but their performance was reduced compared to controls. While controls improved their success rate during the first sequence (sequence A) pa-tients improved later in sequence C (Fig. 4b). This is consistent with studies showing intact but slowed motor learning capacity after stroke [27, 44].
The single finger tapping task, which requires explicit control of timing, revealed good temporal matching in patients for the 1 Hz and 2 Hz target frequencies, but a
reduced tapping rate for the 3 Hz condition compared to controls. The performances measured were similar in all four fingers with no significant difference across fin-gers. Other studies have shown differences in maximal tapping rate between fingers [45], a measure we did not assess. Nonetheless, we assume that some patients had maximal tapping rate below 3 Hz since unable to follow this target rate. Other studies have also shown a de-creased maximal finger tapping rate (and dede-creased re-gularity) in stroke patients [24, 26]. However, we did not find a decreased tapping regularity in patients: this could be due to differences in lesion localizations and tapping parameters used.
stroke, consistent with previous reports [10, 22, 48]. Complementary to these previous observations based on purely kinematic measures, we show here that fin-ger independence and its impairment in stroke also occurs in a task combining kinetic and kinematic constraints.
Together these findings show that the FFM allows quantification of different key parameters of manual dexterity with one and the same apparatus in a single one-hour session. The observed impairments of these key parameters in stroke patients with mild-to-moderate hemiparesis were partly consistent with previous reports, which confirms the relevance of these measures.
Clinical correlations
Some of our measures correlated with clinical scales. Al-though these correlations need to be taken with caution (due to limited group size), they suggest that single finger tapping rate as well success rate in multi-finger tapping relate to hand functioning according to the ARAT, even though the ARAT showed a ceiling effect. These same two dexterity components also correlated with the Moberg pick-up score. This might point to common underlying control parameters, in particular timing (speed of execu-tion) and digit selection (contrary to Raghavan et al. [22], who did not find any correlations between finger inde-pendence indices and clinical scores). The FFM thus pro-Fig. 9Correlations with clinical scores.a-bFFM single finger tapping (N = 10):aCorrelation between 1-3Hz slope and the ARAT scores.bCorrelation between 1-3Hz slope and the Moberg pick-up scores.c-dFFM multi-finger tapping (N = 9).cCorrelation between success rate and the ARAT scores. dCorrelation between success rate and the Moberg pick-up scores
Table 3Pearson correlation coefficients (R2) between dexterity component scores
Finger force tracking Single finger tapping Multi-finger tapping
Total error RD 1-slope (1–3Hz) OF 1 Hz Omission rate UEFT 1F Finger force tracking Total error
RD 0.38
Single finger tapping 1-slope (1–3 Hz) 0.28 0.19
OF 1 Hz 0.10 0.11 0.27
Multi-finger tapping Omission rate 0.49 0.14 0.47 0.04
UEFT 1F 0.21 0.24 0.55 0.27 0.47
vides some measures that correlate with clinical scales, which, however, needs to be confirmed in a larger sample size and with a larger variety of clinical scores.
Individual dexterity profiles
Since the FFM allows for assessment of several different key control parameters it also provides the potential for obtaining individual profiles of impaired dexterity. The dexterity profiles varied in the patient group (Fig. 8) and patients were not equally affected in the various measures. For example, patient 09 had difficulty in releasing force, produced overflow and error taps, but showed similar accuracy in force tracking and tapping speed compared to controls. This patient therefore had difficulties in stopping and inhibiting movements in other fingers and would likely benefit from targeted training of these components.
The individual profiles (in Fig. 8) suggest that some of the measures are independent of each other, even if the omission rate and the capacity to increase the tapping rate moderately correlated to other measures (Table 3). This, however, will need further statistical elaboration in larger samples. Profiling of impairment should allow ex-traction of the most severely affected component(s) of dexterity and should permit individual optimization of rehabilitation protocols [49].
Independence of finger movements and dexterity
In our view, independence of finger movements repre-sents one functional aspect of dexterity. Four different FFM measures allow for characterization of the degree of finger independence. (i) The number of unwanted taps during single finger tapping, and during multi finger tapping, (ii) the success rate, (iii) the omission rate, and (iv) the distribution of unwanted extra-finger-movements. These four measures were impaired in our stroke patients, reflecting a reduced degree of finger individuation. How-ever, single finger tapping is less complex than multi finger tapping: the latter requires various patterns of instantan-eous effector selection. Indeed, the number of unwanted extra-finger-movements during multi-finger tapping was the most affected measure. This deficit in effector selec-tion might be due to non-selective excitaselec-tion and/or insuf-ficient inhibition [9].
The distribution of unwanted extra-finger-taps (in sin-gle and two-finger taps) provided two additional insights into how independent finger movements are affected after stroke (Fig. 7). First, the ring finger was the least independent finger, replicating results from previous studies [9, 22]. Second, stroke patients had a similar
‘neighborhood’ gradient as control subjects, suggesting that stroke lesions do not affect this gradient and do not provoke finger-specific deficits (in this stroke group).
Independence of finger movements is not typically a clinical index. Previous studies on independence of
finger movements in hemiparetic patients [22, 48], all based on kinematics measures, found small or no corre-lations with clinical hand function scales. Nevertheless, our measures of finger individuation correlated with the ARAT and the Moberg scores. This difference may relate to the fact that all our measures had a kinetic (force) component. Hence, finger individuation might usefully complement other functional scales, and its specific training may provide more efficient recovery than con-ventional rehabilitation [49].
Limitations
The main limitation of our study concerns the group size: some findings (e.g., correlations between FFM mea-sures and clinical scores) need to be confirmed with a larger sample that represents a broader range of lesion size and localization, as well as a more representative range of functional impairment. Nevertheless, even in this restricted sample we found clear-cut group differ-ences and individually diverse dexterity profiles. Two methodological limits of the FFM were identified in the present study: the sequential tapping task was too diffi-cult, due in part to lack of adjustable piston positioning, difficulty in maintaining the finger tips on the contact surface, and task velocity. These constraints may have affected certain performance measures. These issues will be addressed by simplifying the sequence task and by re-design of the FFM device.
Conclusions
We developed a novel device, the FFM, to quantify key components of manual dexterity in a clinical setting. Use of the device, together with four visuo-motor tasks, was feasible in a group of hemiparetic stroke patients. On the group level, patients were significantly impaired in all four visuo-motor tasks compared to healthy control subjects. Patients showed less accurate finger force control, slowed finger tapping rate, more error in finger selection and in sequential finger tapping. Moreover, the four tasks allowed for individual profiling of post-stroke impairment in dexterity. This suggests that this new device provides a more complete and more sensitive assessment of manual dexterity than previous devices or clinical scores.
Competing interests
The FFM device is patented by MAM, PL, and by Sensix, Poitiers (Patent ref: EP2659835 A1). Commercial rights owned by Sensix.
Authors’contributions
Acknowledgements
We thank Julie Paquereau and Leire Santisteban at the Service de Médecine Physique et de Réadaptation de l’Hôpital Sainte-Anne, for their help in the recruitment and in the clinical assessment. This work was in part supported by the CNRS (Centre national de la recherche scientifique) and by Inserm (Institut national de la santé et de la recherche médicale).
Author details
1FR3636 CNRS, Université Paris Descartes, Sorbonne Paris Cité, 75006 Paris,
France.2Service de Médecine Physique et de Réadaptation, Université Paris Descartes, Hôpital Sainte-Anne, 75014 Paris, France.3Centre de Psychiatrie et
Neurosciences, Inserm U894, 75014 Paris, France.4Université Paris Diderot, Sorbonne Paris Cité, 75013 Paris, France.
Received: 7 April 2015 Accepted: 13 July 2015
References
1. Heffner RS, Masterton RB. The role of the corticospinal tract in the evolution of human digital dexterity. Brain Behav Evol. 1983;23(3–4):165–83. 2. Lemon RN. Descending pathways in motor control. Annu Rev Neurosci.
2008;31:195–218.
3. Napier JR. Prehensility and opposability in the hands of primates. Symp Zool Soc London. 1961;5:115–32.
4. Zatsiorsky VM, Latash ML. Multifinger prehension: an overview. J Mot Behav. 2008;40(5):446–76.
5. Maier MA, Hepp-Reymond MC. EMG activation patterns during force production in precision grip. I. Contribution of 15 finger muscles to isometric force. Exp Brain Res. 1995;103(1):108–22.
6. Renner CI, Bungert-Kahl P, Hummelsheim H. Change of strength and rate of rise of tension relate to functional arm recovery after stroke. Arch Phys Med Rehabil. 2009;90(9):1548–56.
7. Ehrsson HH, Fagergren A, Jonsson T, Westling G, Johansson RS, Forssberg H. Cortical activity in precision- versus power-grip tasks: an fMRI study. J Neurophysiol. 2000;83(1):528–36.
8. Nowak DA, Glasauer S, Hermsdörfer J. Force control in object manipulation– a model for the study of sensorimotor control strategies. Neurosci Biobehav Rev. 2013;37(8):1578–86.
9. Häger-Ross C, Schieber MH. Quantifying the independence of human finger movements: comparisons of digits, hands, and movement frequencies. J Neurosci. 2000;20(22):8542–50.
10. Lang CE, Schieber MH. Reduced muscle selectivity during individuated finger movements in humans after damage to the motor cortex or corticospinal tract. J Neurophysiol. 2004;91(4):1722–33.
11. Repp BH, Su YH. Sensorimotor synchronization: a review of recent research (2006–2012). Psychon Bull Rev. 2013;20(3):403–52.
12. Andres FG, Gerloff C. Coherence of sequential movements and motor learning. J Clin Neurophysiol. 1999;16(6):520–7.
13. Catalan MJ, Honda M, Weeks RA, Cohen LG, Hallett M. The functional neuroanatomy of simple and complex sequential finger movements: a PET study. Brain. 1998;121(Pt 2):253–64.
14. Parker VM, Wade DT, Langton Hewer R. Loss of arm function after stroke: measurement, frequency, and recovery. Int Rehabil Med. 1986;8(2):69–73.
15. Kwakkel G, Kollen BJ, van der Grond J, Prevo AJ. Probability of regaining dexterity in the flaccid upper limb: impact of severity of paresis and time since onset in acute stroke. Stroke. 2003;34(9):2181–6.
16. Colebatch JG, Gandevia SC. The distribution of muscular weakness in upper motor neuron lesions affecting the arm. Brain. 1989;112(Pt 3):749–63. 17. Boissy P, Bourbonnais D, Carlotti MM, Gravel D, Arsenault BA. Maximal grip
force in chronic stroke subjects and its relationship to global upper extremity function. Clin Rehabil. 1999;13(4):354–62.
18. Lindberg PG, Roche N, Robertson J, Roby-Brami A, Bussel B, Maier MA. Affected and unaffected quantitative aspects of grip force control in hemiparetic patients after stroke. Brain Res. 2012;1452:96–107. 19. Hermsdörfer J, Hagl E, Nowak DA, Marquardt C. Grip force control during
object manipulation in cerebral stroke. Clin Neurophysiol. 2003;114(5):915–29. 20. Hermsdörfer J, Hagl E, Nowak DA. Deficits of anticipatory grip force control after damage to peripheral and central sensorimotor systems. Hum Mov Sci. 2004;23(5):643–62.
21. Raghavan P, Krakauer JW, Gordon AM. Impaired anticipatory control of fingertip forces in patients with a pure motor or sensorimotor lacunar syndrome. Brain. 2006;129(Pt 6):1415–25.
22. Raghavan P, Petra E, Krakauer JW, Gordon AM. Patterns of impairment in digit independence after subcortical stroke. J Neurophysiol. 2006;95(1):369–78.
23. Kim Y, Kim WS, Yoon B. The effect of stroke on motor selectivity for force control in single- and multi-finger force production tasks.
NeuroRehabilitation. 2014;34(3):429–35.
24. Calautti C, Jones PS, Persaud N, Guincestre JY, Naccarato M, Warburton EA, et al. Quantification of index tapping regularity after stroke with tri-axial accelerometry. Brain Res Bull. 2006;70(1):1–7.
25. Calautti C, Jones PS, Guincestre JY, Naccarato M, Sharma N, Day DJ, et al. The neural substrates of impaired finger tapping regularity after stroke. Neuroimage. 2010;50(1):1–6.
26. Shimoyama I, Ninchoji T, Uemura K. The finger-tapping test. A quantitative analysis. Arch Neurol. 1990;47(6):681–4.
27. Boyd LA, Winstein CJ. Impact of explicit information on implicit
motor-sequence learning following middle cerebral artery stroke. PhysTher. 2003;83(11):976–89.
28. Hobart JC, Cano SJ, Zajicek JP, Thompson AJ. Rating scales as outcome measures for clinical trials in neurology: problems, solutions, and recommendations. Lancet Neurol. 2007;6(12):1094–105.
29. Fleuren JF, Voerman GE, Erren-Wolters CV, Snoek GJ, Rietman JS, Hermens HJ, et al. Stop using the Ashworth Scale for the assessment of spasticity. J Neurol Neurosurg Psychiatry. 2010;81(1):46–52.
30. Chen HM, Chen CC, Hsueh IP, Huang SL, Hsieh CL. Test-retest reproducibility and smallest real difference of 5 hand function tests in patients with stroke. Neurorehabil Neural Repair. 2009;23(5):435–40. 31. Pandyan AD, Vuadens P, van Wijck FM, Stark S, Johnson GR, Barnes MP. Are
we underestimating the clinical efficacy of botulinum toxin (type A)? Quantifying changes in spasticity, strength and upper limb function after injections of Botox to the elbow flexors in a unilateral stroke population. Clin Rehabil. 2002;16(6):654–60.
32. Nowak DA, Hermsdörfer J. Grip force behavior during object manipulation in neurological disorders: toward an objective evaluation of manual performance deficits. Mov Disord. 2005;20(1):11–25.
33. Van der Lee JH, De Groot V, Beckerman H, Wagenaar RC, Lankhorst GJ, Bouter LM. The intra- and inter rater reliability of the action research arm test: a practical test of upper extremity function in patients with stroke. Arch Phys Med Rehabil. 2001;82(1):14–9.
34. Chen HF, Lin KC, Wu CY, Chen CL. Rasch validation and predictive validity of the action research arm test in patients receiving stroke rehabilitation. Arch Phys Med Rehabil. 2012;93(6):1039–45.
35. Amirjani N, Ashworth NL, Gordon T, Edwards DC, Chan KM. Normative values and the effects of age, gender, and handedness on the Moberg Pick-Up Test. Muscle Nerve. 2007;35(6):788–92.
36. Patel MR, Bassini L. A comparison of five tests for determining hand sensibility. J Reconstr Microsurg. 1999;15(7):523–6.
37. Celnik P, Paik NJ, Vandermeeren Y, Dimyan M, Cohen LG. Effects of combined peripheral nerve stimulation and brain polarization on performance of a motor sequence task after chronic stroke. Stroke. 2009;40(5):1764–71.
38. Zatsiorsky VM, Li ZM, Latash ML. Enslaving effects in multi-finger force production. Exp Brain Res. 2000;131(2):187–95.
39. Johansson RS, Flanagan JR. Coding and use of tactile signals from the fingertips in object manipulation tasks. Nat Rev Neurosci. 2009;10(5):345–59.
40. Logan FA. Errors in copy typewriting. J Exp Psychol Hum Percept Perform. 1999;25(6):1760–73.
41. Koh CL, Hsueh IP, Wang WC, Sheu CF, Yu TY, Wang CH, et al. Validation of the action research arm test using item response theory in patients after stroke. J Rehabil Med. 2006;38(6):375–80.
42. Lang CE, Wagner JM, Dromerick AW, Edwards DF. Measurement of upper-extremity function early after stroke: properties of the action research arm test. Arch Phys Med Rehabil. 2006;87(12):1605–10. 43. Ye Y, Ma L, Yan T, Liu H, Wei X, Song R. Kinetic measurements of hand
motor impairments after mild to moderate stroke using grip control tasks. J Neuroeng Rehabil. 2014;11:84.
45. Aoki T, Francis PR, Kinoshita H. Differences in the abilities of individual fingers during the performance of fast, repetitive tapping movements. Exp Brain Res. 2003;152(2):270–80.
46. Lang CE, Schieber MH. Human finger independence: limitations due to passive mechanical coupling versus active neuromuscular control. J Neurophysiol. 2004;92(5):2802–10.
47. Reilly KT, Hammond GR. Independence of force production by digits of the human hand. Neurosci Lett. 2000;290(1):53–6.
48. Lang CE, Schieber MH. Differential impairment of individuated finger movements in humans after damage to the motor cortex or the corticospinal tract. J Neurophysiol. 2003;90(2):1160–70.
49. Thielbar KO, Lord TJ, Fischer HC, Lazzaro EC, Barth KC, Stoykov ME, et al. Training finger individuation with a mechatronic-virtual reality system leads to improved fine motor control post-stroke. J Neuroeng Rehabil. 2014;11:171.
Submit your next manuscript to BioMed Central and take full advantage of:
• Convenient online submission
• Thorough peer review
• No space constraints or color figure charges
• Immediate publication on acceptance
• Inclusion in PubMed, CAS, Scopus and Google Scholar
• Research which is freely available for redistribution