R E S E A R C H
Open Access
Recursive SVM biomarker selection for early
detection of breast cancer in peripheral blood
Fan Zhang
1,2, Howard L Kaufman
3,4, Youping Deng
3,5*, Renee Drabier
1*From
The 2011 International Conference on Bioinformatics and Computational Biology (BIOCOMP
’
11)
Las Vegas, NV, USA. 18-21 July 2011
Abstract
Background:Breast cancer is worldwide the second most common type of cancer after lung cancer. Traditional mammography and Tissue Microarray has been studied for early cancer detection and cancer prediction. However, there is a need for more reliable diagnostic tools for early detection of breast cancer. This can be a challenge due to a number of factors and logistics. First, obtaining tissue biopsies can be difficult. Second, mammography may not detect small tumors, and is often unsatisfactory for younger women who typically have dense breast tissue. Lastly, breast cancer is not a single homogeneous disease but consists of multiple disease states, each arising from a distinct molecular mechanism and having a distinct clinical progression path which makes the disease difficult to detect and predict in early stages.
Results:In the paper, we present a Support Vector Machine based on Recursive Feature Elimination and Cross Validation (RFE-CV) algorithm for early detection of breast cancer in peripheral blood and show how to use SVM-RFE-CV to model the classification and prediction problem of early detection of breast cancer in peripheral blood. The training set which consists of 32 health and 33 cancer samples and the testing set consisting of 31 health and 34 cancer samples were randomly separated from a dataset of peripheral blood of breast cancer that is
downloaded from Gene Express Omnibus. First, we identified the 42 differentially expressed biomarkers between “normal” and“cancer”. Then, with the SVM-RFE-CV we extracted 15 biomarkers that yield zero cross validation score. Lastly, we compared the classification and prediction performance of SVM-RFE-CV with that of SVM and SVM Recursive Feature Elimination (SVM-RFE).
Conclusions:We found that 1) the SVM-RFE-CV is suitable for analyzing noisy high-throughput microarray data, 2) it outperforms SVM-RFE in the robustness to noise and in the ability to recover informative features, and 3) it can improve the prediction performance (Area Under Curve) in the testing data set from 0.5826 to 0.7879. Further pathway analysis showed that the biomarkers are associated with Signaling, Hemostasis, Hormones, and Immune System, which are consistent with previous findings. Our prediction model can serve as a general model for biomarker discovery in early detection of other cancers. In the future, Polymerase Chain Reaction (PCR) is planned for validation of the ability of these potential biomarkers for early detection of breast cancer.
Background
Breast cancer is the most common type of cancer among women in the United States [1]. Early detection is key to the successful treatment of breast cancer. Traditional methods most used for early detection have been regular
and periodic self examination and annual or biannual check-ups using mammography and analysis of tissue biopsies. However, early cancer detection and treatment are still challenging. One reason is that mammography as a screening tool for early detection has many drawbacks. For example, mammography may not detect small tumors, and is often unsatisfactory for younger women, who typically have dense breast tissue. Another reason is that obtaining tissue biopsies can be difficult for reasons including small size of lump, lack of available medical
* Correspondence: [email protected]; [email protected]
1
Department of Academic and Institutional Resources and Technology, University of North Texas Health Science Center, Fort Worth, TX, USA
3
Rush University Cancer Center, Rush University Medical Center, Chicago, IL 60612, USA
Full list of author information is available at the end of the article
facilities, and patients’reluctance to undergo invasive procedures due to potential scaring and financial costs. Moreover, the fact that breast cancer is not a single homogeneous disease but consists of multiple disease states, each arising from a distinct molecular mechanism and having a distinct clinical progression path [2], makes the disease difficult to detect in early stages.
To address these issues, a novel and minimally invasive test that uses easily obtained peripheral blood for breast cancer detection has been developed [3,4]. For example, Sharmaet al.used microarrays and nearest-shrunken-cen-troid method to analyze the expression pattern of 1,368 genes in peripheral blood cells of 24 women with breast cancer and 32 women with no sign of this disease. The study found that a blood-based gene expression test can be developed to detect breast cancer early in asympto-matic patients [4]. Aaroeet al.collected peripheral blood from 67 breast cancer samples and 63 normal samples, identified a set of 738 differentially expressed probes, and achieved an estimated prediction accuracy of 79.5% with a sensitivity of 80.6% and a specificity of 78.3% [3].
There is a need for more reliable diagnostic tools for early detection of breast cancer in peripheral blood which can achieve high prediction accuracy with as few genes as possible, and to reduce the required examination of a large number of genes which increases the dimensionality, computational complexity, and clinical cost of diagnosis [5].
Support Vector Machine Recursive Feature Elimination (SVM-RFE) approach for gene selection proposed by Guyon [6] is one of the most effective feature selection methods which has been successfully used in selecting informative genes for cancer classification. It is a backward selection approach that selects genes according to their influence (weight) on a support vector machine. First it calculates ranking criteria based on the SVM weights. Then it eliminates features with the smallest ranking cri-terion. Lastly it repeats the process until a highest classifi-cation accuracy is achieved.
SVM-RFE is used to find discriminate relationships within clinical datasets and within gene expression data-sets created from micro-arrays of tumor versus normal tis-sues. However, the feature elimination method is sensitive to small perturbations of the training set. The features it extracts from training set might not have good prediction performance in an independent testing set. This is prob-ably caused by overfitting which arises when 1) the num-ber of features is large and the numnum-ber of training patterns is comparatively small or 2) some regularities appear in the training data that do not appear in the test data. In order to avoid the overfitting and gain best prediction accuracy for the testing set, we built an SVM based on Recursive Feature Elimination and Cross Validation (SVM-RFE-CV) to extract optimal features.
We propose for the first time a multi-marker panel development solution for early detection of breast can-cer in peripheral blood by using a SVM-RFE-CV, and show how to use SVM-RFE-CV to model the classifica-tion and predicclassifica-tion problem of early detecclassifica-tion of breast cancer in peripheral blood.
We compared the classification and prediction perfor-mance of SVM-RFE-CV with that of SVM and SVM Recursive Feature Elimination (SVM-RFE) and found that 1) the SVM-RFE-CV is suitable for analyzing noisy high-throughput microarray data, 2) it outperforms SVM-RFE in the robustness to noise and in the ability to recover informative features, and 3) it can improve the prediction performance (Area Under Curve) in the testing data set from 0.5826 to 0.7879.
Materials and methods
Peripheral blood data collection
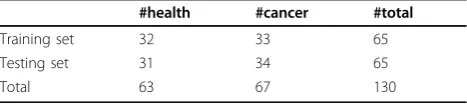
We downloaded the 130 samples of peripheral blood data through the GEO database, which are publically available with the accession number GSE16443 [3] and were collected to originally determine the potential of gene expression profiling of peripheral blood cells for early detection of blood cancer. It consists of 130 sam-ples with 67 cases and 63 controls. We randomly divided the 130 samples into two groups: group A as a training set and group B as a testing set (Table 1).
Normalization
Normalization per sample was used to normalize the data. First, log ratio base 2 transformation was used to transform the data. And then for each probe the median of the log summarized values from all the samples were calculated and subtracted from each of the samples.
Linear mixed model
We used the ABI Human Genome Survey Microarray Version 2 to manage and map probe IDs. A full factorial model was used to represent the fixed effect and the random effect which are used to account for group and probe. The expression log ratios value is the final quan-tity that is fit by a separate analysis of the variance (ANOVA) statistical model for each probe asyil using the following:
yij=μ+Ti+Sj+εij
Table 1 statistics of samples
#health #cancer #total
Training set 32 33 65
Testing set 31 34 65
where Sj∈N(0,σ12), εij Î N(0, s 2
). Here, μ is the mean expression value, Ti is the fixed group effect
(caused by the experimental conditions or treatments being evaluated),Sjis the random sample effect (random
effects from either individual biological samples or sam-ple preparations), andεijis the within-groups errors. All random effects are assumed independent of each other and independent of the within-groups errorsεij.
Statistics
Statistical Significance was measured by a three-step method. First, we conducted the above linear mixed model to obtain the p value of the significance for the group effect. Then we calculated the FDR adjusted p value. Lastly, we calculated the FDR q value using the Storey-Tibshirani method [7]. We chose a significance screening filter (q< 0.01) to select genes of which we esti-mated significant differences in the health and breast can-cer samples. The False Positive Rate (FPR), or expected proportion of false positive among the proteins with declared changes, is FPR = qvalue × number of the genes with declared changes.
Support Vector Machine
The classification problem of breast cancer can be restricted to consideration of the two-class problem without loss of generality (breast cancer and normal). We developed a Support Vector Machine Recursive Fea-ture Elimination(SVM-RFE) method [6] based on Cross-Validation (CV) (SVM-RFE-CV) to eliminate features for breast cancer from peripheral blood. And then we built a classifier based on the selected features and applied the classifier to predict breast cancer from per-ipheral blood in an independent testing set.
Consider the problem of separating the set of training patterns belonging to two separate classes (1, breast cancer; -1, normal), D = {(x1, y1),..., (x1, y1)}, xÎℝn, yÎ{-1, 1} with
a hyperplane <w, ×> +b= 0. The set of patterns is said to be optimally separated by the hyperplane if it is separated without error and the distance between the closest pattern to the hyperplane is maximal. Without loss of generality it is appropriate to consider a canonical hyperplane [8], where the parameters w, b are constrained by
min
i |<w, xi>+b| = 1. That is, the norm of the weight
vector should be equal to the inverse of the distance, of the nearest point in the data set to the hyperplane. A separat-ing hyperplane in canonical form must satisfy the followseparat-ing constraints: yi[<w, xi> +b]≥1 - ei, i = 1, ..., l. Therefore,
according to the structural risk minimization inductive principle, the training of an SVM is to minimize the
guar-anteed risk bound, min
w,b,eφ(w,b,e) = 1 2W
TW +1 2C
1
i=1e 2 i,
subject to the constraints yi[<w, xi> + b]≥1 - ei, i = 1, ..., l.
The above optimization problem can be used in a lin-ear recognition problem, but in this case, the classifica-tion problem is nonlinear. To solve the nonlinear classification problem, we can map first the training data to another feature space Fvia a nonlinear map:
ℝn®
F and then perform the above computations in F. We used Gaussian radius basis function (RBF) kernels function for SVM.
Recursive feature elimination(SVM-RFE) method based on cross-validation
SVM-RFE was introduced by Guyon et al. for selecting genes from microarray data analysis for cancer classifi-cation [6]. It includes four steps: 1) Train an SVM on the training set; 2) calculate ranking criteria based on the SVM weights; 3) Eliminate features with the smallest ranking criterion; and 4) Repeat the process. The feature elimination method is sensitive to small perturbations of the training set. The features it extracts from training set might not have good prediction performance in an independent testing set. Therefore, we adopted leave-one-out cross validation method to improve the stability and robustness of SVM-RFE. In addition, we chose |W| as ranking criteria instead of W2 in the SVM-RFE-CV algorithm. The SVM-RFE [6] chose Ci=Wi2 as ranking
criteria and eliminates the feature with smallest ranking criterion. The original optimization equation in SVM actually depends on the absolute value of weight |W|. Substituting 12W2 for |W| can change the non-convex
optimization to a quadratic programming optimization which is more easy to solve mathematically. But when we loop the feature elimination based on leave-one-out cross-validation, 1
2W
2 loses its advantages over |W| on
convexity of optimization. And |W| has bigger ranking criteria than 1
2W
2, which makes optimization selection
more accurate. Therefore, we chose |W| as ranking cri-teria in the SVM-RFE-CV algorithm.
The SVM Recursive Feature Elimination method based on Cross-Validation (SVM-RFE-CV) is described as follows:
k =K;#Select All features for (i in 1:n) #n is the sample size {
Build a SVM using the ith sample as testing set and others as training set;
Calculate the feature weight Wi and the error rate Ei; }
Sum up weights: W = sum(abs(Wi)); Sum up error rates: E = sum(Ei); E0 = E;
E0 = E;
rkw = rank(W); #rank the feature score
k = k[which(rkw > 1)]; # remove features with lowest feature score
for (i in 1:n) {
Build a SVM using the ith sample as testing set and others as training set;
Calculate the feature weight Wi and the error rate Ei;
}
Sum up weights: W = sum(abs(Wi)); Sum up error rates: E = sum(Ei); }
The error rate is calculated by 1 minus accuracy. All error rates for the n cross validations are summed up as determination of loop iterations.
Enumeration method for validation
The enumeration method based on feed forward neural network was built to identify optimal biomarkers panel by us [9]. Similarly, we designed an enumeration method based on SVM to verify whether the biomarkers panel identified by the SVM-RFE-CV in the training set has still best prediction performance for the testing set.
We randomly chose M combinations of N (for example M = 100,000 when N = 15 for fifteen-marker panel) out of all the 42 genes differentially expressed in the training set and built M SVMs. In order to find the optimal classifier, we presented an enumeration method that measures the area under the curve (AUC) for Receiver Operating Char-acteristics (ROC). First, we trained the M SVMs in the training set with five-fold cross-validation. Then, we mea-sured the AUC for each of the M combinations in the test-ing set. Lastly, the combinations were ranked by
rankC=AUC(SVMC,T),
where AUC is the area under the ROC curve of SVM prediction, SVM is the trained classifier, C is one of M combinations of picking N out of the 42 genes, and T is the testing set.
Cross-validation
k-fold cross-validation was used to increase the number of estimates and improve the accuracy of the prediction model by avoiding the over-fitting. In k-fold cross-valida-tion, the original sample is randomly partitioned into k sub-samples. Of the k subsamples, a single subsample is retained as the validation data for testing the model, and the remaining k-1 subsamples are used as training data. The cross-validation process is then repeated k times, with each of the k subsamples used exactly once as the validation data. The k results from the folds then can be averaged to
produce a single estimation. The advantage of this method over repeated random sub-sampling is that all observations are used for both training and validation, and each observa-tion is used for validaobserva-tion only once. If k equals the sample size, this is called leave-one-out cross-validation.
Performance measurements
The following five measurements were involved in our evaluation: (1) Sensitivity (also called recall), the propor-tion of actual positive pairs which are correctly identi-fied; (2) Specificity, the proportion of negative pairs which are correctly identified; (3) Precision, the prob-ability of correct positive prediction; (4) Accuracy, the proportion of correctly predicted pairs; and (5) Area Under the Curve.
Sensitivity= TP
TP+FN
Specificity= TN
TP+FP
Precision= TP
TP+FP
Accuracy= TP+TN
TP+TN+FP+FN
Pathway analysis
We performed the pathway analysis using the databases: Integrated Pathway Analysis Database (IPAD) http:// bioinfo.hsc.unt.edu/ipad/[10].
Results
We downloaded from the Gene Expression Omnibus (accession number GSE16443) [3] the 130 samples with 67 breast cancer and 63 healthy women. After we ran-domly divided the 130 samples into two groups, group A as training set and group B as testing set (Table 1), we obtained 32 health samples and 33 cancer samples in the training set and 31 health samples and 34 cancer samples in the testing set. No data from the testing set were utilized in 1) identification of peripheral blood markers or 2) development of the SVM model.
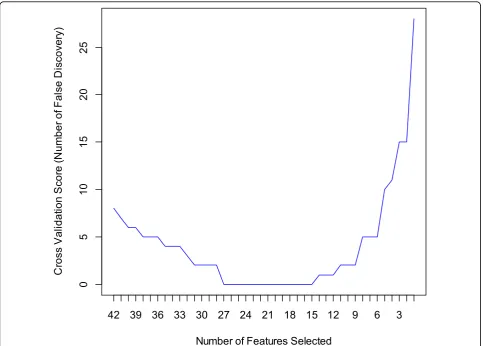
comparatively small or 2) some regularities appear in the training data that do not appear in the test data. In order to avoid the overfitting and gain best prediction accuracy for the testing set, we built an SVM based on Recursive Feature Elimination and Cross Validation (SVM-RFE-CV) to extract optimal features. We show in Figure 1 the auto-matic tuning of number of features selected with the recursive feature elimination and the leave-one-out cross-validation. Training of the SVM-RFE-CV was performed using radius basis function (RBF) kernels function and leave-one-out cross-validation. Cross-validation scores were calculated to help evaluate the predictive perfor-mance of features selected by SVM-RFE-CV. The cross-validation scores is defined as number of false discovery which can be calculated by
cross−validation score=Error Rate ∗number of sample size.
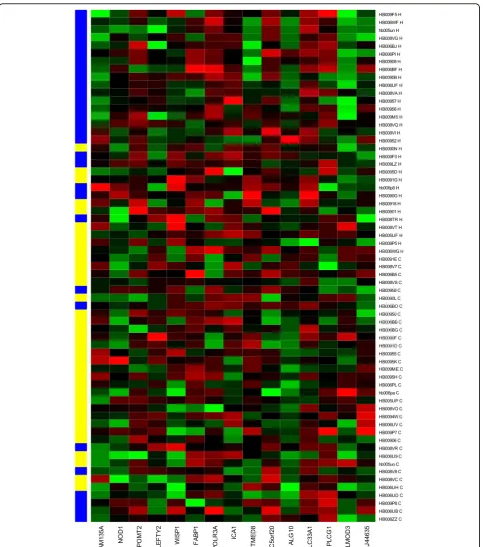
The best cross-validation score with the least number of features occurs when the number of features is equal to 15 (Figure 1). The heatmap of the 15-marker panel for the testing set is shown in Figure 2. 26 out of 32 cancer samples and 22 out of 31 normal samples were correctly predicted.
Table 3 shows the direction and strength of expression changes for the 15 biomarkers. Some markers and their association with cancer already have been reported. For example, NOD1 is a cytosolic protein that senses meso-diaminopimelic acid-containing ligands derived from pep-tidoglycan and plays a role in host responses to invasive bacteria. Da et al. used Cell lines derived from the human breast cancer epithelial cell line (MCF-7) to characterize a pathway linking NOD1 to the growth of estrogen-sensitive tumors in a severe combined immune deficiency (SCID) mouse xenograft model. They found that the absence of NOD1 correlates with tumor growth, an increased sensi-tivity to estrogen-induced cell proliferation, and a failure to undergo NOD1-dependent apoptosis in the MCF-7 cells and conversely, overexpression of NOD1 in MCF-7 cells results in inhibition of estrogen-dependent tumor growth and reduction of estrogen-induced proliferative responses in vitro [11].
Left-right determination factor 2 (LEFTY2) encodes a member of the TGF-beta family of proteins. The encoded
protein is secreted and plays a role in left-right asymme-try determination of organ systems during development. The protein may also play a role in endometrial bleeding which is one of the most common manifestations of gynecologic diseases. Hernandezet al.found that promo-ters of LEFTY2 were differentially methylated in breast cancer samples relative to corresponding surrounding tis-sue [12].
Xieet al.observed overexpression of CTGF, WISP1, CYR61, and NOVH in primary breast tumors. They found significant associations between WISP1 mRNA levels ver-sus stage, tumor size, lymph node, and HER-2/neu overex-pression with statistical univariate analysis. Their results suggested that CTGF, WISP-1, and CYR61 might play a role in the progression of breast cancer and might serve as a valuable tool for monitoring tumor status of breast can-cer patients [13]. Davieset al.analyzed the expression of the three WISP molecules at the mRNA and protein levels in a cohort of 122 human breast tumors and 32 normal breast tissues, and their correlations with patients’clinical outcomes. WISP1 transcripts were found in lower levels in node-positive tumors compared with node-negative tumors (P < .05); were lower in patients with a moderate (P = .01) and poor Nottingham Prognostic Index prog-nosis (P < .05) compared with good prognostic groups; were of significantly lower level in grade 3 differentiated tumors (P < .05) compared with grade 1; and were of lower levels in patients who developed metastasis and died from breast cancer-related causes (P < .05 in both compar-isons). They concluded that WISP-1 seemed to act as a tumor suppressor, WISP-2 as a factor that stimulates aggressiveness; and WISP-3 has no definable beneficial or detrimental role [14].
FABP1 encodes the fatty acid-binding protein found in liver. Hammamiehet al.showed that blocking the expres-sion of FABP1 resulted in remarkable effects on apoptosis and cell proliferation of prostate cancer cell lines [15] and FABP1 and intestine fatty acid binding proteins was up-regulated in breast cancer cell lines [16].
Sala et al. studied PLCG1 and its role in breast cancer metastasis and discovered this gene can promote cancer metastasis and subsequently blocking it stopped cancer from spreading. They showed that down-regulation of
Table 2 performance comparison of SVM, SVM-RFE, and SVM-RFE-CV
Measure SVM SVM-RFE SVM-RFE-CV
#genes 42 18 15
Training set Testing set Training set Testing set Training set Testing set
Precision 97.0% 58.8% 100% 71.4% 100% 74.29%
Accuracy 98.4% 56.9% 100% 70.8% 100% 73.85%
Sensitivity 100.0% 58.8% 100% 73.5% 100% 76.47%
Specificity 96.9% 54.8% 100% 67.7% 100% 70.97%
PLCgamma1 expression severely impaired activation of the small GTP-binding protein Rac and cell invasion in breast cancer cell lines and U87 in vitro. In addition, they found an increase of PLCgamma1 expression in metasta-sis compared with the primary tumor in 50% of 60 breast cancer patients’tissues analyzed. They suggested that PLCgamma1 inhibition had a therapeutic potential in the treatment of metastasis dissemination [17].
Arteaga et al. determined the relative content of PLC-gamma 1 in primary human mammary carcinomas and in nonmalignant mammary tissues. They detected con-siderably higher levels of PLC-gamma 1 protein in the majority of carcinomas and in one of two benign fibroa-denomas compared to normal breast tissues by Western blot and immunohistochemistry. They also detected the presence of phosphotyrosine on PLC-gamma 1 in 18 of 21 carcinomas that contained high levels of PLC-gamma 1. They found that all carcinomas in which tyrosine phosphorylated PLC-gamma 1 was present also expressed detectable levels of the epidermal growth fac-tor recepfac-tor or erbB-2, two tyrosine kinases known to phosphorylate this enzyme. They concluded that
increased levels of receptor tyrosine kinases and a direct tyrosine phosphorylation substrate could be linked with a high percentage of mammary carcinomas and amplify two successive steps in a signal transduction pathway [18].
Pathway analysis shows the pathways linked with the fifteen-marker panel are signaling, hemostasis, hormone, and immune system (Additional file 1), which are con-sistent with previous findings [3].
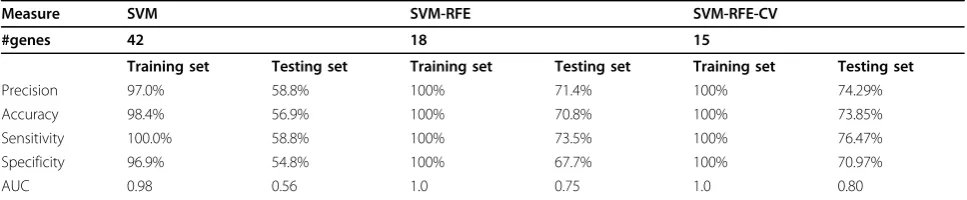
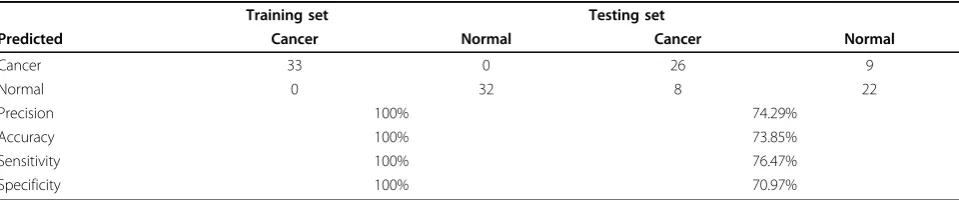
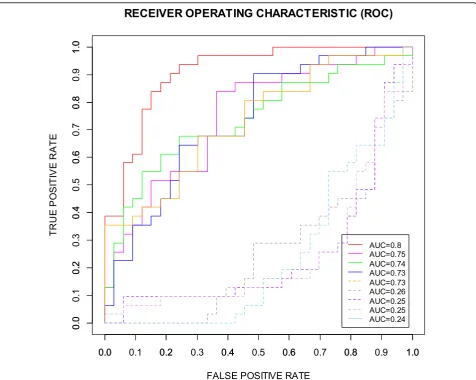
The confusion matrix and common performance metrics for both the training data set and testing data set for the 15-marker panel is shown in Table 4. Although the final accuracy is 73.85% but can be considered as an improvement if compared to the original accuracy 56.9%. In addition, the AUC, a comprehensive measurement of sensitivity and specificity, is improved markedly from 0.56 to 0.8 (Figure 3 and Table 4).
In order to validate our prediction method, we com-pared the ROCs for the 15-marker panel determined by the SVM-RFE-CV with the ROCs for 4 best randomly selected 15-marker panels and 4 worst randomly selected 15-marker panels from the 42 candidate biomarkers
0
5
10
15
2
0
25
Number of Features Selected
C
ro
ss
V
a
lida
tion
S
cor
e (
N
u
m
b
er
o
f F
a
ls
e
D
is
cov
e
ry
)
42 39 36 33 30 27 24 21 18 15 12
9
6
3
(Figure 3) using the Enumeration Method for Validation described in the method section. As shown in the Figure 3, the 15-marker panel determined by the SVM-RFE-CV (red solid line) has best sensitivity-specificity-tradeoff
performance than others chosen randomly from 42 candi-date biomarkers.
We also compared the classification and prediction performances of the three algorithms: SVM, SVM-RFE,
F
A
M135A NO
D1
PO
M
T
2
LE
F
T
Y
2
WI
SP1
FA
B
P
1
PO
LR
3A
IC
A
1
TM
E
D
8
C5
or
f2
0
AL
G
10
SL
C
33
A
1
PL
C
G
1
LMO
D
3
F
LJ
446
35
HB008ZZ C HB006UB C HB009P8 C HB006UD C HB006UH C HB008VC C HB008V8 C hb005uo C HB006U9 C HB008VR C HB00906 C HB009P7 C HB006UV C HB0094W C HB008VO C HB005UP C hb006pa C HB006PL C HB0095H C HB009ME C HB0095K C HB00955 C HB0091D C HB0090F C HB006BG C HB006BB C HB00950 C HB006BO C HB0090L C HB00958 C HB008VS C HB006B5 C HB008V7 C HB0091E C HB006WG H HB009P5 H HB005UF H HB008VT H HB008TR H HB00901 H HB00918 H HB0090G H hb006p8 H HB0091G H HB0095D H HB009LZ H HB009F0 H HB0090N H HB00952 H HB008VI H HB008VQ H HB009M5 H HB00956 H HB00957 H HB008VA H HB006UF H HB0090B H HB006BF H HB00908 H HB006PI H HB006BJ H HB008VG H hb005un H HB006WF H HB009F5 H
and SVM-RFE-CV (Table 2). All the three algorithms can have high performance for the training. The perfor-mances of SVM-RFE and SVM-RFE-CV for the training set are the same. But there are differences in the num-ber of genes and the performance for the testing set between the three algorithms. The SVM method has no function of feature elimination. The number of genes selected by SVM-RFE-CV is lower than that selected by RFE. In the testing set, the performance of SVM-RFE-CV is better than SVM-RFE.
We further evaluated our multi-marker panel tion performance by comparing our results with predic-tion performance in previously published findings. Sharma et al.identified a panel of 37 genes that per-mitted early detection with the classification accuracy of 82% [4] and Aaroeet al.identified a set of 738 differen-tially expressed probes that achieved an estimated predic-tion accuracy of 79.5% with a sensitivity of 80.6% and a specificity of 78.3% [3]. Considering their methods were not applied to independent testing sets randomly sepa-rated from training set but usedk-fold cross validation where the original sample was randomly partitioned into
ksubsamples and of theksubsamples, a single subsample was retained as the validation data for testing the model,
and the remainingk- 1 subsamples were used as training data, our prediction performance actually outperformed them (Precision = 100%, Accuracy = 100%, Sensitivity = 100%, Specificity = 100%). We believe our approach is a significant success, considering that we only used fifteen gene markers in a panel to achieve the prediction perfor-mance (AUC = 0.8, Precision = 74.29%, Accuracy = 73.85%, Sensitivity = 76.47%, Specificity = 70.97%).
Lastly, we investigated the effect of qvalue’s threshold on the results. We obtained 5 markers in the training set with qvalue < 0.001 and 1454 markers with qvalue < 0.1. For qvalue < 0.001, 3 markers were chosen With SVM-RFE-CV and produced the prediction performance of AUC = 0.5; for qvalue < 0.1, 16 markers were chosen With SVM-RFE-CV and produced the prediction per-formance of AUC = 0.78. Our results show that the qvalue < 0.01 has the best prediction performance with the SVM-RFECV.
Conclusions
We developed an integrated computational approach that addressed a challenging multi-panel biomarker development problem in the early detection of breast cancer in peripheral blood. The approach combined
Table 3 gene expressions changes in 15-marker panel.
ProbeID Genesymbol GeneID direction qvalue
131318 FAM135A 57579 up 0.00775
134303 NOD1 10392 down 0.00995
146885 POMT2 29954 down 0.00459
154366 LEFTY2 7044 up 0.00928
155372 WISP1 8840 down 0.00197
162446 FABP1 2168 up 0.00735
167465 POLR3A 11128 down 0.00754
167529 ICA1 3382 down 0.00368
172360 TMED8 283578 up 0.00582
189547 C5orf20 140947 down 0.00941
206647 ALG10 84920 down 0.00050
210406 SLC33A1 9197 down 0.00483
211808 PLCG1 5335 down 0.00317
222602 LMOD3 56203 up 0.00508
230936 FLJ44635 392490 up 0.00773
Table 4 prediction result for the 15-marker panel
Training set Testing set
Predicted Cancer Normal Cancer Normal
Cancer 33 0 26 9
Normal 0 32 8 22
Precision 100% 74.29%
Accuracy 100% 73.85%
Sensitivity 100% 76.47%
recursive feature elimination of SVM with cross-valida-tion. It automatically learned non-linear relationships between features and outcomes to generate the optimal predictive model with the least number of features, which achieved AUC = 0.80 performance with a sensi-tivity of 76.47% and a specificity of 70.97% in the testing data set of 34 women with breast cancer and 31 healthy women controls.
The SVM-RFE based on cross-validation is able to identify the optimal multi-markers panel with the least number of genes. It can filter irrelevant, tissue-specific genes from those related to malignancy. It also identifies gene expression patterns related to severity of disease. It is an effective method for finding markers implicated in cancers. In the future, we will follow up with biological experiments to validate these biomarkers we identified with our collaborators.
Additional material
Additional file 1: Pathway analysis for the fifteen-marker panel.
Authors’contributions
YD and RD conceived the initial work and designed the method. FZ and YD downloaded the datasets, developed the classification method, and performed the statistical analyses. YD and HLK validated markers for early detection of breast cancer in peripheral blood. All authors are involved in the drafting and revisions of the manuscript.
Competing interests
The authors declare that they have no competing financial interests.
Acknowledgements
We thank Brian Denton, Woody Hagar, Anthony Tissera, and Lynley Dungan for help with the IPAD’s database design and web development. We also thank two anonymous reviewers for comments that helped us improve this manuscript.
0.0 0.2 0.4 0.6 0.8 1.0
0
.0
0
.2
0
.4
0
.6
0
.8
1
.0
FALSE POSITIVE RATE
T
RUE
P
O
SI
T
IV
E R
AT
E
0.0 0.1 0.2 0.3 0.4 0.5 0.6 0.7 0.8 0.9 1.0
0
.0
0
.1
0
.2
0
.3
0
.4
0
.5
0
.6
0
.7
0
.8
0
.9
1
.0
AUC=0.8 AUC=0.75 AUC=0.74 AUC=0.73 AUC=0.73 AUC=0.26 AUC=0.25 AUC=0.25 AUC=0.24
RECEIVER OPERATING CHARACTERISTIC (ROC)
This article has been published as part ofBMC Medical GenomicsVolume 6 Supplement 1, 2013: Proceedings of the 2011 International Conference on Bioinformatics and Computational Biology (BIOCOMP’11). The full contents of the supplement are available online at http://www.biomedcentral.com/ bmcmedgenomics/supplements/6/S1. Publication of this supplement has been supported by the International Society of Intelligent Biological Medicine.
Author details
1Department of Academic and Institutional Resources and Technology,
University of North Texas Health Science Center, Fort Worth, TX, USA.
2Department of Forensic and Investigative Genetics, University of North
Texas Health Science Center, Fort Worth, TX, USA.3Rush University Cancer
Center, Rush University Medical Center, Chicago, IL 60612, USA.4Department of General Surgery and Immunology and Microbiology, Rush University Medical Center, Chicago, IL 60612, USA.5Department of Internal Medicine and Biochemistry, Rush University Medical Center, Chicago, IL 60612, USA.
Published: 23 January 2013
References
1. Zhang F, Chen JY:Discovery of pathway biomarkers from coupled proteomics and systems biology methods.BMC genomics2010,11(Suppl 2):S12.
2. Polyak K:Breast cancer: origins and evolution.J Clin Invest2007,
117(11):3155-3163.
3. Aaroe J, Lindahl T, Dumeaux V, Saebo S, Tobin D, Hagen N, Skaane P, Lonneborg A, Sharma P, Borresen-Dale AL:Gene expression profiling of peripheral blood cells for early detection of breast cancer.Breast cancer research: BCR2010,12(1):R7.
4. Sharma P, Sahni NS, Tibshirani R, Skaane P, Urdal P, Berghagen H, Jensen M, Kristiansen L, Moen C, Zaka A,et al:Early detection of breast cancer based on gene-expression patterns in peripheral blood cells.Breast cancer research: BCR2005,7(5):R634-644.
5. Li W:How many genes are needed for early detection of breast cancer, based on gene expression patterns in peripheral blood cells?Breast cancer research: BCR2005,7(5):E5.
6. Guyon I, Weston J, Barnhill S, Vapnik V:Gene Selection for Cancer Classification using Support Vector Machines.Mach Learn2002, 46(1-3):389-422.
7. Storey JD, Tibshirani R:Statistical significance for genomewide studies.
Proc Natl Acad Sci USA2003,100(16):9440-9445. 8. Vapnik VN:Statistical Learning Theory.Springer, NY1998. 9. Fan Z:A neural network approach to multi-biomarker panel
development based on LC/MS/MS proteomics profiles: a case study in breast cancer.2009, 1-6.
10. Zhang F, Drabier R:IPAD: the Integrated Pathway Analysis Database for systematic enrichment analysis.BMC Bioinformatics2012,13(14). 11. da Silva Correia J, Miranda Y, Austin-Brown N, Hsu J, Mathison J, Xiang R,
Zhou H, Li Q, Han J, Ulevitch RJ:Nod1-dependent control of tumor growth.Proceedings of the National Academy of Sciences of the United States of America2006,103(6):1840-1845.
12. Hernandez-Vargas H, Ouzounova M, Le Calvez-Kelm F, Lambert MP, McKay-Chopin S, Tavtigian SV, Puisieux A, Matar C, Herceg Z:Methylome analysis reveals Jak-STAT pathway deregulation in putative breast cancer stem cells.Epigenetics: official journal of the DNA Methylation Society2011,
6(4):428-439.
13. Xie D, Nakachi K, Wang H, Elashoff R, Koeffler HP:Elevated levels of connective tissue growth factor, WISP-1, and CYR61 in primary breast cancers associated with more advanced features.Cancer research2001,
61(24):8917-8923.
14. Davies SR, Watkins G, Mansel RE, Jiang WG:Differential expression and prognostic implications of the CCN family members WISP-1, WISP-2, and WISP-3 in human breast cancer.Annals of surgical oncology2007,
14(6):1909-1918.
15. De Santis ML, Hammamieh R, Das R, Jett M:Adipocyte-fatty acid binding protein induces apoptosis in DU145 prostate cancer cells.Journal of experimental therapeutics & oncology2004,4(2):91-100.
16. Hammamieh R, Chakraborty N, Barmada M, Das R, Jett M:Expression patterns of fatty acid binding proteins in breast cancer cells.Journal of experimental therapeutics & oncology2005,5(2):133-143.
17. Sala G, Dituri F, Raimondi C, Previdi S, Maffucci T, Mazzoletti M, Rossi C, Iezzi M, Lattanzio R, Piantelli M,et al:Phospholipase Cgamma1 is required for metastasis development and progression.Cancer research2008,
68(24):10187-10196.
18. Arteaga CL, Johnson MD, Todderud G, Coffey RJ, Carpenter G, Page DL:
Elevated content of the tyrosine kinase substrate phospholipase C-gamma 1 in primary human breast carcinomas.Proceedings of the National Academy of Sciences of the United States of America1991,
88(23):10435-10439.
doi:10.1186/1755-8794-6-S1-S4
Cite this article as:Zhanget al.:Recursive SVM biomarker selection for early detection of breast cancer in peripheral blood.BMC Medical Genomics20136(Suppl 1):S4.
Submit your next manuscript to BioMed Central and take full advantage of:
• Convenient online submission
• Thorough peer review
• No space constraints or color figure charges
• Immediate publication on acceptance
• Inclusion in PubMed, CAS, Scopus and Google Scholar
• Research which is freely available for redistribution