Open Access
Research
Air pollution and lung function among susceptible adult subjects: a
panel study
Susanna Lagorio*
1, Francesco Forastiere
2, Riccardo Pistelli
3, Ivano Iavarone
4,
Paola Michelozzi
2, Valeria Fano
2, Achille Marconi
4, Giovanni Ziemacki
4and
Bart D Ostro
5Address: 1National Centre for Epidemiology, Surveillance and Health Promotion, Istituto Superiore di Sanità, Viale Regina Elena 299 00161 Rome,
Italy, 2Department of Epidemiology, Rome E Health Authority, Via di Santa Costanza 53 00198 Rome, Italy, 3Pneumology Department, Università
Cattolica del Sacro Cuore, Via Moscati 31 – 00168 Rome, Italy, 4Department of Environment and Primary Prevention, Istituto Superiore di Sanità,
Viale Regina Elena 299 00161 Rome, Italy and 5California Office of Environmental Health Hazard Assessment (OEHHA), 1515 Clay St., Oakland,
CA 94612, USA
Email: Susanna Lagorio* - [email protected]; Francesco Forastiere - [email protected]; Riccardo Pistelli - [email protected]; Ivano Iavarone - [email protected]; Paola Michelozzi - [email protected]; Valeria Fano - [email protected];
Achille Marconi - [email protected]; Giovanni Ziemacki - [email protected]; Bart D Ostro - [email protected] * Corresponding author
Abstract
Background: Adverse health effects at relatively low levels of ambient air pollution have consistently been reported in the last years. We conducted a time-series panel study of subjects with chronic obstructive pulmonary disease (COPD), asthma, and ischemic heart disease (IHD) to evaluate whether daily levels of air pollutants have a measurable impact on the lung function of adult subjects with pre-existing lung or heart diseases.
Methods: Twenty-nine patients with COPD, asthma, or IHD underwent repeated lung function tests by supervised spirometry in two one-month surveys. Daily samples of coarse (PM10–2.5) and fine (PM2.5) particulate matter were collected by means of dichotomous samplers, and the dust was gravimetrically analyzed. The particulate content of selected metals (cadmium, chrome, iron, nickel, lead, platinum, vanadium, and zinc) was determined by atomic absorption spectrometry. Ambient concentrations of nitrogen dioxide (NO2), carbon monoxide (CO), ozone (O3), and sulphur dioxide (SO2) were obtained from the regional air-quality monitoring network. The relationships between concentrations of air pollutants and lung function parameters were analyzed by generalized estimating equations (GEE) for panel data.
Results: Decrements in lung function indices (FVC and/or FEV1) associated with increasing concentrations of PM2.5, NO2 and some metals (especially zinc and iron) were observed in COPD cases. Among the asthmatics, NO2 was associated with a decrease in FEV1. No association between average ambient concentrations of any air
pollutant and lung function was observed among IHD cases.
Conclusion: This study suggests that the short-term negative impact of exposure to air pollutants on respiratory volume and flow is limited to individuals with already impaired respiratory function. The fine fraction of ambient PM seems responsible for the observed effects among COPD cases, with zinc and iron having a potential role via oxidative stress. The respiratory function of the relatively young and mild asthmatics included in this study seems to worsen when ambient levels of NO2 increase.
Published: 05 May 2006
Environmental Health: A Global Access Science Source 2006, 5:11 doi:10.1186/1476-069X-5-11
Received: 04 July 2005 Accepted: 05 May 2006
This article is available from: http://www.ehjournal.net/content/5/1/11
© 2006 Lagorio et al; licensee BioMed Central Ltd.
Background
Throughout the 1990s, many epidemiological studies consistently reported adverse health effects at unexpect-edly low levels of ambient air pollution [1]. Identification of susceptible sub-populations and mechanisms of effect involved are two clear research priorities [2,3]. Several chronic clinical conditions are good candidates to define the "frail" population susceptible to the acute effects of PM pollution: chronic obstructive pulmonary disease (COPD) including asthma, ischemic heart diseases (IHD), congestive heart failure, heart rhythm disorders, and diabetes [4].
The mechanisms of lung injury caused by particles among people with COPD have been reviewed [5]. The ability of particulate matter to induce oxidative stress in the airways has been proposed as an important biological mechanism [6]. The oxidative stress mediated by particles may arise from direct generation of reactive oxygen species from the surface of particles or from soluble compounds such as transition metals or organic compounds (poly-aromatic hydrocarbons) [7]. Oxidative stress might up-regulate redox sensitive transcription factors (via nuclear factor kappa B, NF-kB) in airway epithelial cells, thus increasing the synthesis of proinflammatory cytokines and resulting in cell and tissue injury [8].
In healthy and asthmatic volunteers, airborne particles increase bronchial responsiveness, airway resistance, and bronchial tissue mast cell, neutrophil, and lymphocyte counts [9]. A specific role for ultrafine particles and metal-lic content of PM (especially iron) has been advocated [10,11].
The relationship between daily levels of air pollutants and respiratory function in patients with chronic respiratory diseases has been analyzed in various panel studies, with inconsistent results [12,13]. Most studies concern asth-matic children, while far fewer observations relate to changes in peak expiratory flow rate [14-22] or in spiro-metric flow and volume [23-26] among adult or elderly asthmatics or COPD patients.
We conducted a time-series panel study of subjects with COPD, asthma, and IHD with the aim of answering the following question: have daily fluctuations of selected air pollutants a measurable impact on the lung function of subjects with pre-existing lung or heart disease?
Methods
Participant recruitment
Study subjects were selected among outpatients of the Pneumology and Cardiology Departments of the Catholic University Hospital in Rome (UCSC) included in routine clinical follow-up programs. Eligible for the study were
residents of Rome, living in census tracts less than 2 km away from one of the six air monitoring stations consid-ered in this study.
A number of clinical criteria was specified for each noso-logical category. Eligibility for the COPD panel included age from 50 to 80 years, a ratio of forced expiratory vol-ume in one second to forced vital capacity (FEV1/FVC) less than 60%, partial oxygen pressure (SpO2) at arterial blood oximetry = 60–70 mmHg, normal values of carboxyhe-moglobin (COHb), normal acid-base balance, no con-comitant IHD, no need of oxygen therapy or breathing apparatus, no pacemaker, no cardiac arrhythmias, diabe-tes, Parkinson disease or chronic alcohol abuse, and no use of either psycho-chemical drugs or long acting bron-chodilators; occasional use of short-acting bronchodila-tors was allowed.
Admittance to the asthmatic panel was allowed to subjects aged 18 to 64 years, positive at the bronchial reactivity test by hypertonic saline solution, with disease in the mild intermittent stage [27]. Occasional use of β-adrenergic stimulants was allowed, but assumption of steroids or other asthma-preventive drugs (either before, or during the study periods) was not.
Participation in the IHD panel was restricted to subjects aged 40 to 64 years, with stable angina or previous myo-cardial infarction (at least 1 year prior to recruitment), no concomitant COPD, no use of calcium channel blockers, no pacemaker, no atrial fibrillation (other arrhythmias admitted), diabetes, Parkinson disease or chronic alcohol abuse, and no use of psycho-chemical drugs.
In relation to smoking habits, participation in the asth-matic panel was restricted to never smokers. Never smok-ers, however, were almost absent from the clinical series of COPD and IHD outpatients; former smokers were then admitted to the COPD and IHD panels if they had given up smoking at least 1 year before enrollment (sustained quitters).
The study protocol was approved by the Ethical Commit-tee of the UCSC. Twenty-nine patients with COPD (7 men and 4 women), asthma (5 men and 6 women) or IHD (6 men and 1 woman) gave their written informed consent to undergo repeated clinical examinations for two one-month periods, in the spring and winter of 1999.
Study time period
Health monitoring
Study subjects were scheduled to be examined three days apart, at home (COPD and IHD panels) or at the Pneu-mology Clinic of the UCSC (asthmatic panel). Forced vital capacity (FVC) and forced expiratory volume in 1 sec-ond (FEV1) were measured by spirometry. Spirometries were supervised, and done with the subject in a sitting position and wearing a nose-clip, following the sugges-tions of the American Thoracic Society [28]. Spirometries were always done in the afternoon (between 4 pm and 8 pm), at least 6 hours after a possible inhalation of short-acting bronchodilators. A heated Fleish tube n. 3 portable spirometer (Biomedin, Italy) was used in the COPD and IHD panels, and a light bell Stead-Wells spirometer (Bio-medin, Italy) in the asthmatic group. Between instru-ments reproducibility, for both FVC and FEV1, was within 30 ml and the calibration procedures were regularly per-formed [28]. Pulmonary function indices used in the analyses are expressed as the percentage of the predicted values based on the subject- specific sex, age, height and weight [29].
Only amongst asthmatics we determined concentrations of nitric oxide (NO) in exhaled breath, an indicator of bronchial inflammation [30], using the analyzer model 280 (Sievers Instruments, USA). Subjects were breathing NOx free air prior to this test. Asthmatics were also asked to fill in a brief daily questionnaire collecting information about the occurrence of asthma attacks and β-2 agonist inhalations.
Study subjects' characteristics
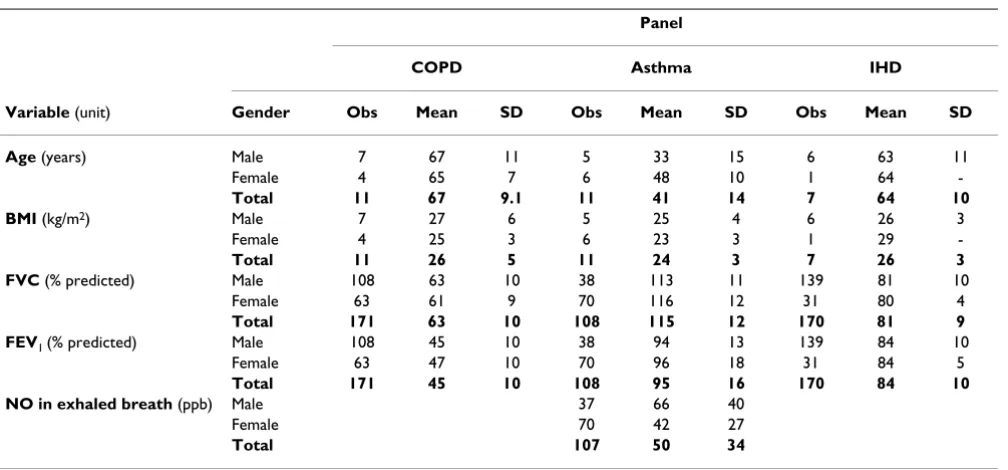
Table 1 describes the characteristics of subjects at entry and the group-distribution of the outcome variables. As expected on the basis of the eligibility criteria, asthmatics were younger than COPD and IHD patients, and the group average values of FVC and FEV1 were sensibly lower among COPD cases compared to both IHD and asthmatic subjects. Overall, the 29 study subjects underwent a total of 449 spirometries. Due to dropouts, a variable number of observations per case was available. The average number of repeated observations was 15 in the COPD panel (ranging from 1 to 32 per subject), 24 in the IHD panel (from 12 to 32 per case), and 9 among the asthmat-ics (from 6 to 18 per person). All IHD patients were regu-larly treated with aspirin, statins and nitrates. No COPD or IHD patient made use of bronchodilators (short- or long-acting) during the survey periods, while 7 out of 11 asthmatics reported β-2 stimulant inhalations on one or more of the clinical monitoring days. As to previous smoking habits, all COPD patients were sustained quit-ters, all asthmatics were never smokers, while in the IHD panel the five male patients were sustained quitters and the single female participant was a never smoker.
Environmental data
Mean daily temperature (T, Celsius), barometric pressure (BarP, mmHg) and relative humidity (RelHum, %) were available from the Rome weather station (Collegio Romano – Ufficio Centrale di Ecologia Agricola). The Department of Environment of the Latium Region pro-vided us with hourly concentrations of nitrogen dioxide (NO2), carbon monoxide (CO), ozone (O3), and sulphur
Table 1: Characteristics of study subjects and group averages of lung function parameters over the survey periods
Panel
COPD Asthma IHD
Variable (unit) Gender Obs Mean SD Obs Mean SD Obs Mean SD
Age (years) Male 7 67 11 5 33 15 6 63 11
Female 4 65 7 6 48 10 1 64
-Total 11 67 9.1 11 41 14 7 64 10
BMI (kg/m2) Male 7 27 6 5 25 4 6 26 3
Female 4 25 3 6 23 3 1 29
-Total 11 26 5 11 24 3 7 26 3
FVC (% predicted) Male 108 63 10 38 113 11 139 81 10
Female 63 61 9 70 116 12 31 80 4
Total 171 63 10 108 115 12 170 81 9
FEV1 (% predicted) Male 108 45 10 38 94 13 139 84 10
Female 63 47 10 70 96 18 31 84 5
Total 171 45 10 108 95 16 170 84 10
NO in exhaled breath (ppb) Male 37 66 40
Female 70 42 27
dioxide (SO2) recorded at the fixed sites for air-quality monitoring in Rome. These sites are equipped with con-tinuous inlet samplers. NO2 is determined by chemilumi-nescence, CO by IR absorption, O3 by UV absorption, and SO2 by UV fluorescence.
We computed daily city means (24 h values, from 3 pm to 3 pm of the following day) based on data from varying type and number of sites, depending on the pollutant. For NO2 and CO, we calculated 24 h values from five fixed sites, three of which are located in densely populated areas in the center of Rome (Magna Grecia, Fermi, Libia) and two representing background areas (Preneste and Villa Ada). For O3, concentrations recorded at two background fixed sites (Preneste and Villa Ada) were used. For SO2, we used 24 h concentrations recorded at one urban site (Fermi) and one background site (Villa Ada). The NO2 and SO2 series were complete, while average daily concen-trations for one single day were missing for CO and O3.
As to particulate matter, we could not use data from the Rome air-quality monitoring network, because PM2.5 was not routinely measured. Therefore, for the specific pur-poses of this survey, 24 h concentrations of PM10–2.5 and PM2.5 were measured at two selected fixed monitoring sites: Villa Ada and Istituto Superiore di Sanità (ISS). These sites, located about 3.5 km apart, were chosen because, based on historical PM10 monitoring data, are considered representative of low and high traffic areas in Rome, respectively. Air samples were collected by means of dichotomous samplers (Graseby Andersen, model SA 241) operating at 16.7 L/min, with an omni-directional aerosol inlet. This sampler has been designated as refer-ence for PM10 by US EPA [31]. Sampling was carried out from 3 pm to 3 pm of the following day (in order to match the spirometry time schedule). Sixty-two 24 hour samples were collected, with 5 missing observations at the begin-ning of the winter survey. The dust on the couple of sequential polytetrafluoroethylene (PTFE) filters (polymethylpentane ringed, 2.0 µm pore size, 37 mm diameter; Gelman, USA) was gravimetrically analyzed to obtain average daily concentrations of PM2.5 and PM10–2.5. PM10 concentrations were calculated by adding the con-centrations of the sampled fine and coarse fractions. The averages of PM concentrations measured at the two loca-tions were used in the statistical analyses, as our best esti-mate of 24 h mean ambient concentrations for the Rome neighborhoods the panel participants lived in.
In the PM10–2.5 and PM2.5 samples, the content of selected metals (cadmium – Cd, chromium – Cr, iron – Fe, nickel – Ni, lead – Pb, platinum – Pt, vanadium-V, and zinc – Zn) was determined by atomic absorption spectrometry (AAS). The concentrations used in the analysis were
calcu-lated as the ratio of the metal amount in each PM sample to the air volume collected during the sampling.
As a side validation study, we measured indoor PM2.5 con-centrations in a total of five homes of three study subjects per survey. COPD cases were preferentially selected for the side study due to their reduced mobility in comparison with asthmatics and IHD patients. Participation in the side validation study was burdensome to the study sub-jects: a technician had to come every day to change the sampler filter, and the sampler itself was noisy. Thus, we only succeeded in getting consent to participate from one IHD patient for both surveys, and from four COPD cases, for only one survey each. Participants in the side study were representative of the full study group in terms of housing typology (all lived in apartment buildings), floor [basement, first floor (two homes), second floor, fifth floor], and distance from the ISS or Villa Ada PM2.5 mon-itoring sites (varying from 0.3 to 5 km). Indoor 24 h air samples were collected on 59 days (from 28 May to 24 June and from 22 November to 22 December 1999) by Micro-Environmental Monitors (SKC, model 400) with a single-stage impactor, operating at a sampling flow rate of 10 L/min and equipped with a PM2.5 sampling inlet and PTFE filters (polymethylpentane ringed, 2.0 µm pore size, 37 mm diameter; Gelman, USA). Indoor PM2.5 mass con-centrations were gravimetrically determined. The 24 h average concentrations of PM2.5from three homes per sur-vey were used in the reproducibility analysis.
In a previous inter-method reliability study of PM10 meas-urements in outdoor and indoor air samples in Rome, based on two series of 12 parallel 24 h samples, a very good correlation between MEM and dichotomous sam-plers was observed (regression 1: y = 1.192x-3.275 - R2 = 0.9506; regression 2: y = 0.998x-1.332 - R2 = 0.9866) [32]. According to the European Standard EN 12341 criteria [33], the observed values of the determination coefficients are such that the MEM can be considered equivalent to the dichotomous sampler.
Statistical analyses
Correlations among outdoor pollutant levels, as well as those between indoor and outdoor PM2.5 concentrations, were evaluated by non-parametric tests (Spearman corre-lation coefficient) applied to variables in the original scale.
observations, in the exposure or outcome variables, were not replaced with estimates.
The relationships between respiratory function indices and concentrations of air pollutants were analyzed using generalized estimating equations (GEE) for panel data [34]. An autoregressive correlation matrix of lag 1 was assumed, in order to account for possible correlations between repeated measures on the same subject. The sta-tistical package STATA [35] was used for the analyses (XTGEE; the option "force" was specified in order to allow for unequally spaced observations). All the linear models included the within-subject between-period effect, using the dichotomous season variable (spring and winter). For the COPD and IHD panels, terms for daily mean temper-ature (°C), relative humidity (%) and day of the week (weekday/weekend) were included in the regression mod-els. For the asthmatics panel, temperature and humidity terms were included in the regression models along with
β-2 agonist use (yes/no), while the dummy variable week-day/weekend was not, because only 8 out of 108 spiro-metries were done on Saturday and none on Sunday. We considered the possibility of a non-linear effect of temper-ature by introducing a tempertemper-ature-squared term in the regression models; however, since no evidence of model improvement was found in any of the panel-specific anal-yses, only a linear term was left. The daily variability of
pulmonary function was examined with respect to the mean pollutant concentrations of the previous 24 hours and to the cumulative exposures over the previous 48 and 72 hours. Results from the analyses of lung function indi-ces are reported as changes in percentage of predicted val-ues per 10 µg/m3 increase in pollutant concentrations (except for CO where the unit increase is 1 mg/m3). In order to assess the relative effects of metals, we report changes in lung function per interquartile range of increasing concentrations.
Results
Air pollutant concentrations
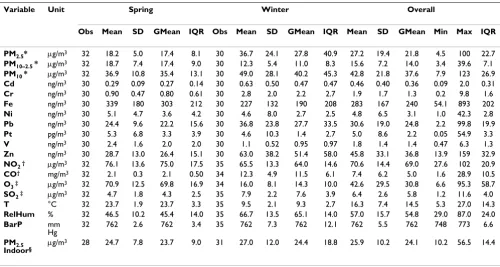
The distribution of environmental variable levels (pollut-ants and weather conditions) during the study period is described in Table 2. Average daily concentrations of both PM10 and PM2.5 were higher and more variable from day to day in winter than in spring. The two PM fractions did not exceed 123 µg/m3 and 100 µg/m3, respectively. The 24 h NO2 city means did not show statistically significant dif-ferences by season. The daily variability of CO concentra-tions, on the contrary, was sensibly higher during the winter than in spring survey. As expected, outdoor O3 lev-els were higher and more variable during the spring sur-vey, but never exceeded 100 µg/m3. Average 24 h concentrations of SO2 were low and showed little variabil-ity both in spring and winter. We decided, therefore, a
pri-Table 2: Concentrations of PM, metals from PM2.5, gaseous pollutants, and climatic conditions (1999 spring and winter)
Variable Unit Spring Winter Overall
Obs Mean SD GMean IQR Obs Mean SD GMean IQR Mean SD GMean Min Max IQR
PM2.5* µg/m3 32 18.2 5.0 17.4 8.1 30 36.7 24.1 27.8 40.9 27.2 19.4 21.8 4.5 100 22.7
PM10–2.5 * µg/m3 32 18.7 7.4 17.4 9.0 30 12.3 5.4 11.0 8.3 15.6 7.2 14.0 3.4 39.6 7.1
PM10 * µg/m3 32 36.9 10.8 35.4 13.1 30 49.0 28.1 40.2 45.3 42.8 21.8 37.6 7.9 123 26.9
Cd ng/m3 30 0.29 0.09 0.27 0.14 30 0.63 0.50 0.47 0.47 0.46 0.40 0.36 0.09 2.0 0.31
Cr ng/m3 30 0.90 0.47 0.80 0.61 30 2.8 2.0 2.2 2.7 1.9 1.7 1.3 0.2 9.8 1.6
Fe ng/m3 30 339 180 303 212 30 227 132 190 208 283 167 240 54.1 893 202
Ni ng/m3 30 5.1 4.7 3.6 4.2 30 4.6 8.0 2.7 2.5 4.8 6.5 3.1 1.0 42.3 2.8
Pb ng/m3 30 24.4 9.6 22.2 15.6 30 36.8 23.8 27.7 33.5 30.6 19.0 24.8 2.2 99.8 19.9
Pt pg/m3 30 5.3 6.8 3.3 3.9 30 4.6 10.3 1.4 2.7 5.0 8.6 2.2 0.05 54.9 3.3
V ng/m3 30 2.4 1.6 2.0 2.0 30 1.1 0.52 0.95 0.97 1.8 1.4 1.4 0.47 6.3 1.3
Zn ng/m3 30 28.7 13.0 26.4 15.1 30 63.0 38.2 51.4 58.0 45.8 33.1 36.8 13.9 159 32.9
NO2 † µg/m3 32 76.1 13.6 75.0 17.5 35 65.5 13.3 64.0 14.6 70.6 14.4 69.0 27.6 102 20.9
CO† mg/m3 32 2.1 0.3 2.1 0.50 34 12.3 4.9 11.5 6.1 7.4 6.2 5.0 1.6 28.9 10.5
O3 ‡ µg/m3 32 70.9 12.5 69.8 16.9 34 16.0 8.1 14.3 10.0 42.6 29.5 30.8 6.6 95.3 58.7
SO2 ‡ µg/m3 32 4.7 1.8 4.3 2.5 35 7.9 2.2 7.6 3.9 6.4 2.6 5.8 1.2 11.6 4.0
T °C 32 23.7 1.9 23.7 3.3 35 9.5 2.1 9.3 2.7 16.3 7.4 14.5 5.3 27.0 14.3
RelHum % 32 46.5 10.2 45.4 14.0 35 66.7 13.5 65.1 14.0 57.0 15.7 54.8 29.0 87.0 24.0
BarP mm
Hg
32 762 2.6 762 3.4 35 762 7.3 762 12.1 762 5.5 762 748 773 6.6
PM2.5 Indoor§
µg/m3 28 24.7 7.8 23.7 9.0 31 27.0 12.0 24.4 18.8 25.9 10.2 24.1 10.2 56.5 14.4
*Averages of 24 h concentrations measured at 2 locations.
†Averages of 24 h concentrations recorded at 5 fixed sites. ‡Averages of 24 h concentrations recorded at 2 fixed sites.
ori not to consider SO2 further in the analyses. Similarly, we did not include mean daily values of barometric pres-sure (BarP) in the regression models, due to its negligible daily variability.
In terms of relative concentrations, six out of 8 metals examined were more represented in the fine than in the coarse fraction of outdoor PM; therefore only metal con-centrations from the PM2.5 fraction are reported in Table 2. Fe, Zn and Pb were present in sizeable concentrations
Table 3: Correlations among pollutants and weather variables
PM2.5 PM10–25 PM10 NO2 O3 CO SO2 T RelHum BarP
PM2.5 1
PM10–25 0.34 1
PM10 0.93 0.61 1
NO2 0.43 0.51 0.45 1
O3 -0.51 0.31 -0.36 0.17 1
CO 0.67 -0.09 0.55 0.05 -0.87 1
SO2 0.34 -0.16 0.21 0.01 -0.61 0.65 1
T -0.31 0.56 -0.10 0.36 0.79 -0.74 -0.56 1
RelHum 0.17 -0.37 0.06 -0.36 -0.62 0.54 0.43 -0.48 1
BarP 0.65 0.24 0.56 0.47 -0.15 0.28 0.18 -0.15 -0.17 1
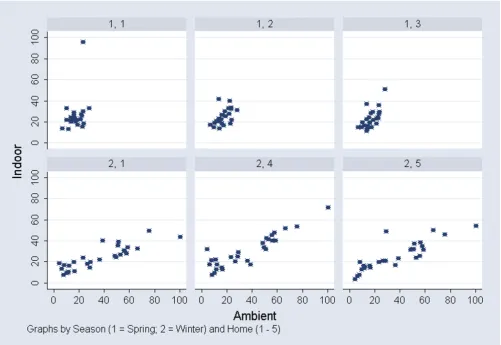
Scatter plot of ambient* PM2.5 and indoor** concentrations (µg/m3, by season† and home‡
Figure 1
Scatter plot of ambient* PM2.5 and indoor** concentrations (µg/m3), by season† and home‡ *Averages of PM2.5 24
h concentrations (µg/m3) at two sites (Villa Ada and ISS). **PM
2.5 24 h indoor concentrations (µg/m3) in each home
in outdoor PM2.5 samples, whereas Pt, Cd, V, Cr and Ni were only present in traces.
Correlations among ambient variables are reported in Table 3. Outdoor concentrations of fine (PM2.5) and coarse (PM10–2.5) particulate matter were weakly corre-lated. Daily mean levels of PM2.5 were directly correlated with barometric pressure, CO and NO2 concentrations, inversely correlated with O3 and temperature, and unre-lated to relative humidity. Average daily concentrations of PM10–2.5 were positively correlated with NO2, tempera-ture, and to a lesser extent with O3, inversely correlated with relative humidity, and not correlated with CO. NO2 concentrations were neither correlated with CO, nor with O3. Daily mean levels of CO and O3 showed a strong neg-ative correlation.
Correlations between ambient concentrations of PM2.5 and each metal and between metals were also examined
(data not shown). PM2.5 daily means were highly corre-lated with Zn, Cd and Pb levels (ρ = 0.778, 0.714 and 0.694 respectively), moderately correlated with Cr, Pt, Ni and Fe (ρ = 0.565, 0.491, 0.475 and 0.463 respectively), and not correlated with vanadium concentrations (ρ = 0.151). Fe concentrations were scarcely correlated with both Zn and Pb (ρ = 0.318 and 0.328), and moderately correlated with Pt (ρ = 0.564). Pt was scarcely correlated with Zn and Pb (ρ = 0.299 and 0.421). Zn and Pb concen-trations were moderately correlated (ρ = 0.663).
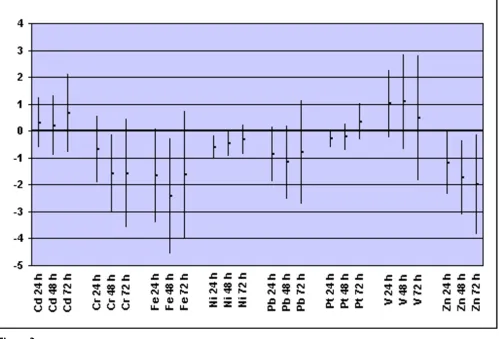
Daily indoor concentrations of PM2.5 (averages of 24 h samples collected at the homes of three subjects per sur-vey) were highly correlated with average ambient PM2.5 (ρ = 0.81, p < 0.01). A reverse PM2.5 indoor/outdoor ratio was evident in the two seasons. Concordance was higher during the winter survey (ρ = 0.91, p < 0.01) than in spring (ρ = 0.59, p = 0.01), apparently due to a greater daily variability of ambient PM2.5 concentrations in winter COPD panel: changes in FVC per interquartile increase of selected metals from PM2.5 samples during the previous 24, 48 or 72
hours* Figure 2
than in spring, and not to home-specific characteristics (Figure 1).
Lung function
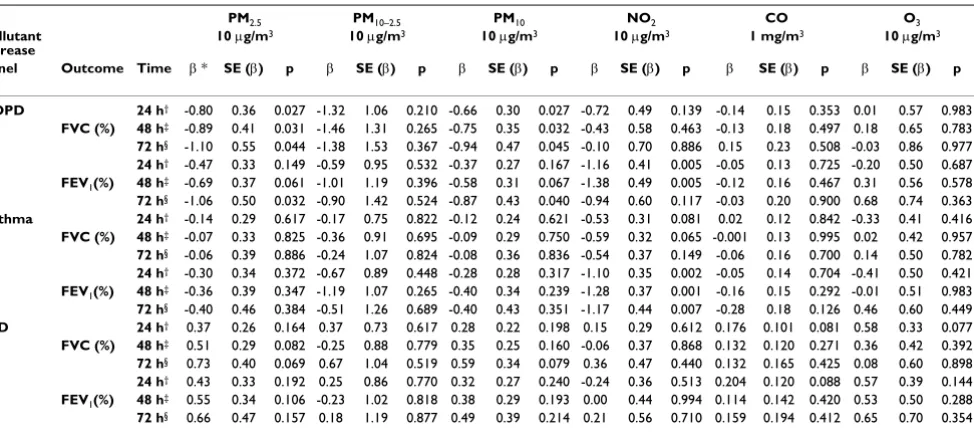
We observed a negative association between ambient PM2.5 and PM10 and respiratory function (FVC and FEV1) in the COPD panel (Table 4). The effect on FVC was evi-dent both at a short lag (24 h) and in relation to cumula-tive exposures over the previous 24 and 48 hours. The effect on FEV1 appeared only when 72 hours of exposure were accumulated. A FEV1 reduction was also seen with increasing NO2 concentrations during the previous 24 and 48 hours. In the asthmatic panel, we observed decreasing values of FEV1 related to cumulative exposure to NO2 con-centrations during the preceding 24, 48, and 72 hours (Table 4). No association between respiratory function indices and average concentrations of any of the pollutants (neither at various lags, nor as cumulative exposure over 48 or 72 h) was observed among IHD patients (Table 4).
In the COPD panel, Zn concentrations were associated with FVC and FEV1 decrements at single 24 h lag and at cumulative 48 h and 72 h lags (Figures 2 and 3). The asso-ciations were similar in size but less consistent for Fe and Ni. No statistically significant negative association between concentrations of metals and lung function indi-ces was observed in the asthmatic and IHD panels (data not shown).
In the group of asthmatics, a total of 107 measurements of NO concentrations in exhaled breath were performed. Overall, there was no clear association of the various pol-lutants with this biological marker of inflammation.
Discussion
This study suggests an effect of fine particles on lung func-tion of COPD patients. The metallic content of PM2.5 seems to be of importance, given the observed negative COPD panel: changes in FEV1 per interquartile increase of selected metals from PM2.5 samples during the previous 24, 48 or 72 hours*
Figure 3
effects of Zn, Fe and Ni concentrations on lung function indices. NO2 also was associated with FEV1 decrements among COPD cases. On the other hand, no effects of PM2.5 were found among asthmatics, whose respiratory function seemed to be negatively influenced by ambient NO2 concentrations. No pollutant-related lung function changes were observed among IHD subjects, with no pre-existing lung impairment.
We acknowledge several limitations of the study. Lack of personal exposure measurements is an important short-coming. Lifestyles and housing conditions among our study subjects were not homogenous, and we cannot expect outdoor PM2.5 concentrations in our study to be a perfect indicator of personal exposure variability, as it was reported among elderly subjects residing in a retirement facility [36,37]. However, the good correlation we observed between day-to-day variations in average out-door and inout-door PM2.5 should mitigate the possibility that findings among COPD patients are entirely due to errors in estimating personal exposure variability. Moreover, despite the high number of repeated observations per sub-ject, the reduced number of patients in each diagnostic category gives a low power to the study, thus we cannot exclude the possibility that small effects were not detected because of the reduced sample size. Last, the present study shares with other studies of air pollution related health effects the drawback of multiple statistical testing.
There are however strengths of the study that are worth underlining. They include: (i) supervised lung function tests; (ii) many repeated observations per patient, which allowed accounting for within-subject variability; (iii) a variety of measured urban pollutants, including fine par-ticles, coarse particles and transition metals. Furthermore, in the present study no association between respiratory function indices and average ambient concentrations of any pollutants was observed among IHD cases, whereas effects of the fine fraction of ambient particulate on lung function among COPD subjects were detected, which had a strong a priori hypothesis. In the light of such results, it seem less likely that the associations observed among COPD and asthmatic patients are chance findings due to the great number of relationships examined.
After considering validity issues, it is worth noting the results of other published works. To our knowledge, only two studies have evaluated lung function by supervised spirometry in relation to daily variation in air pollution among adults with COPD. In the panel study of Pope and Kanner [25], based on 2 repeated observations of 251 smokers with mild to moderate COPD, a 10 µg/m3 increase in PM10 was associated with an average decrease in FEV1 equal to approximately 0.2%. Brauer et al. [26], in their panel study of 16 COPD cases with moderate airway obstruction (FEV1 at baseline ≥ 0.75 l) observed a non-sig-nificant 1.1% decrease of FEV1 for 10 µg/m3 increase in ambient PM2.5. In four other studies [19-22], possible pol-lution-related effects on pulmonary function in COPD
Table 4: Variations in respiratory function per unit increase of air pollutant concentrations in the three panels
PM2.5 PM10–2.5 PM10 NO2 CO O3
Pollutant
increase 10 µg/m
3 10 µg/m3 10 µg/m3 10 µg/m3 1 mg/m3 10 µg/m3
Panel Outcome Time β * SE (β) p β SE (β) p β SE (β) p β SE (β) p β SE (β) p β SE (β) p
COPD 24 h† -0.80 0.36 0.027 -1.32 1.06 0.210 -0.66 0.30 0.027 -0.72 0.49 0.139 -0.14 0.15 0.353 0.01 0.57 0.983 FVC (%) 48 h‡ -0.89 0.41 0.031 -1.46 1.31 0.265 -0.75 0.35 0.032 -0.43 0.58 0.463 -0.13 0.18 0.497 0.18 0.65 0.783 72 h§ -1.10 0.55 0.044 -1.38 1.53 0.367 -0.94 0.47 0.045 -0.10 0.70 0.886 0.15 0.23 0.508 -0.03 0.86 0.977 24 h† -0.47 0.33 0.149 -0.59 0.95 0.532 -0.37 0.27 0.167 -1.16 0.41 0.005 -0.05 0.13 0.725 -0.20 0.50 0.687 FEV1(%) 48 h‡ -0.69 0.37 0.061 -1.01 1.19 0.396 -0.58 0.31 0.067 -1.38 0.49 0.005 -0.12 0.16 0.467 0.31 0.56 0.578 72 h§ -1.06 0.50 0.032 -0.90 1.42 0.524 -0.87 0.43 0.040 -0.94 0.60 0.117 -0.03 0.20 0.900 0.68 0.74 0.363 Asthma 24 h† -0.14 0.29 0.617 -0.17 0.75 0.822 -0.12 0.24 0.621 -0.53 0.31 0.081 0.02 0.12 0.842 -0.33 0.41 0.416 FVC (%) 48 h‡ -0.07 0.33 0.825 -0.36 0.91 0.695 -0.09 0.29 0.750 -0.59 0.32 0.065 -0.001 0.13 0.995 0.02 0.42 0.957 72 h§ -0.06 0.39 0.886 -0.24 1.07 0.824 -0.08 0.36 0.836 -0.54 0.37 0.149 -0.06 0.16 0.700 0.14 0.50 0.782 24 h† -0.30 0.34 0.372 -0.67 0.89 0.448 -0.28 0.28 0.317 -1.10 0.35 0.002 -0.05 0.14 0.704 -0.41 0.50 0.421 FEV1(%) 48 h‡ -0.36 0.39 0.347 -1.19 1.07 0.265 -0.40 0.34 0.239 -1.28 0.37 0.001 -0.16 0.15 0.292 -0.01 0.51 0.983 72 h§ -0.40 0.46 0.384 -0.51 1.26 0.689 -0.40 0.43 0.351 -1.17 0.44 0.007 -0.28 0.18 0.126 0.46 0.60 0.449 IHD 24 h† 0.37 0.26 0.164 0.37 0.73 0.617 0.28 0.22 0.198 0.15 0.29 0.612 0.176 0.101 0.081 0.58 0.33 0.077 FVC (%) 48 h‡ 0.51 0.29 0.082 -0.25 0.88 0.779 0.35 0.25 0.160 -0.06 0.37 0.868 0.132 0.120 0.271 0.36 0.42 0.392 72 h§ 0.73 0.40 0.069 0.67 1.04 0.519 0.59 0.34 0.079 0.36 0.47 0.440 0.132 0.165 0.425 0.08 0.60 0.898 24 h† 0.43 0.33 0.192 0.25 0.86 0.770 0.32 0.27 0.240 -0.24 0.36 0.513 0.204 0.120 0.088 0.57 0.39 0.144 FEV1(%) 48 h‡ 0.55 0.34 0.106 -0.23 1.02 0.818 0.38 0.29 0.193 0.00 0.44 0.994 0.114 0.142 0.420 0.53 0.50 0.288 72 h§ 0.66 0.47 0.157 0.18 1.19 0.877 0.49 0.39 0.214 0.21 0.56 0.710 0.159 0.194 0.412 0.65 0.70 0.354
*Regression coefficient from GEE models for panel data controlling for repeated individual observations, temperature, relative humidity, and day of the week (COPD and IHD panels) or β-2 stimulant inhalation (asthma panel), representing the change in lung function index (% of predicted) per unit increase of pollutant concentration.
cases were examined by unsupervised measurements of peak expiratory flow (PEF). To our knowledge, our study is the first that was able to document a specific role of fine particles on lung function of COPD patients.
PM-related exacerbation of chronic obstructive lung dis-ease may be sustained by multiple direct and indirect mechanisms [5,38,39]. There is empirical evidence and experimental support for direct damages to the respiratory mucosa (increased permeability and reduced mucociliar activity), for oxidative damage, and for secondary toxic effects mediated by pro-inflammatory cytokines. Relative to healthy subjects, patients with moderate-to-severe air-way obstruction receive an increased dose from ultra fine particle exposure [40]. Transition metals [7,8], as well as ultra fine particles [6], may induce oxidative stress and inflammatory response. We are not aware of previous panel studies of adult COPD cases examining pulmonary function changes in relation to the metallic content of air-borne PM. The exploratory analyses presented in this paper suggest that metals from inhaled particulate have a biological effect on pulmonary function. The results on Zn and Fe are of specific interest. Both metals present in the fine fraction are likely to be traffic related as they orig-inate from engine oils, brake, engine, exhaust systems and tire wear [41]. They have a high water solubility which has been directly related to oxidative damage [42].
Results from the asthmatic panel suggest a negative influ-ence of NO2 on FEV1, but no effect of fine particles. Our finding that NO2 is related to lung function decrements both among COPD and asthma patients is of interest. It is difficult to believe that NO2 per se is responsible of the observed effects, given its low intrinsic toxicity. It has been suggested, however, that NO2 may be considered a very good marker of the combustion mixture from traffic sources, in particular of ultra fine particles [43].
No effect of O3 concentrations on the respiratory function of asthmatics was detected, even when the analysis was restricted to the spring survey. The latter finding could be explained by the relatively good clinical conditions of the asthmatics included in the study (all in the mild intermit-tent stage), the relatively low levels of O3 recorded during the study period, or simply lack of power. Although many panel studies of adult asthmatics have reported associa-tions between asthma symptoms and both PM and O3 [13,14], inconsistent results were observed with regard to lung function. Moseholm and coworkers [16] found that increased levels of SO2 and NO2 corresponded synergisti-cally to decreased peak flow at levels above 40 µg/m3. In the asthmatic panel studied by Taggart et al. [24], changes in bronchial hyper-responsiveness were significantly cor-related with 24 h mean concentrations of SO2, NO2 and black smoke, none of the criteria air pollutants seemed to
affect FEV1, while previous-day NO2 levels were associated with FVC decrements. Ambient PM10 concentrations neg-atively affected PEF readings among the asthmatics fol-lowed by Peters et al. [17], with especially strong effects due to the number of ultra fine particles. Higgins et al. [19] observed PEF decrements associated with SO2 and O3 among the methacolin-reactors in their panel, but no independent effect of ambient NO2 levels. On the other hand, among the asthmatics followed by Hiltermann et al. [18], ambient concentrations of O3, PM10, black smoke and NO2 were found to be associated with increased symptom reports, but not with decreased PEF readings.
Conclusion
In conclusion our study, despite its limitations, suggests that the short-term negative impact of exposure to rela-tively low concentrations of air pollutants on lung func-tion is limited to individuals with already impaired respiratory health. The fine fraction of ambient PM seems responsible for the observed effects among COPD cases, with zinc and iron having a potential role. These hints require confirmation from larger and more focused panel studies, using appropriate methods to overcome the prob-lem of multiple comparisons [44].
Abbreviations
AAS = Atomic absorption spectrometry
BarP = Barometric pressure
BMI = Body mass index [weight (kg) / height2(m)]
°C = Celsius degrees
Cd = Cadmium
CO = Carbon monoxide
COHb = Carboxyhemoglobin
COPD = Chronic obstructive pulmonary disease
Cr = Chrome
Fe = Iron
FEV1 = Forced expiratory volume in 1 second (% of pre-dicted)
FVC = Forced vital capacity (% of predicted)
GEE = Generalized estimating equations
HbO2 = Arterial blood oxygen saturation
IHD = Ischemic heart disease
IQR = Interquartile range
IR = Infrared
Mean = Arithmetic mean
MEM = Micro Environmental Monitor
Max = Maximum
Min = Minimum
Mm Hg = Millimeters of mercury
µg/m3 = Micrograms per cubic meterng/m3 = Nanograms per cubic meter
Ni = Nickel
NO = Nitric oxide
NO2 = Nitrogen dioxide
O3 = Ozone
Obs = Number of observations
PEF = Peak expiratory flow
Pb = Lead
PM = Particulate matter
PM10 = Particulate matter with aerodynamic diameter less than 10 µm
PM10–2.5 = Particulate matter with aerodynamic diameter between 10 and 2.5 µm
PM2.5 = Particulate matter with aerodynamic diameter less than 2.5 µm
Pt = Platinum
PTFE = Polytetrafluoroethylene
RelHum = Relative humidity
SD = Standard deviation
SO2 = Sulphur dioxide
SpO2 = Partial oxygen pressure
T = Temperature
UCSC = Catholic University Hospital
UV = Ultraviolet
V = Vanadium
Zn = Zinc
Competing interests
The author(s) declare that they have no competing inter-ests.
Authors' contributions
SL conceived the study, participated in its design and in data analysis, coordinated its realization, made substan-tial contribution to the interpretation of results, and drafted the manuscript. FF conceived the study, partici-pated in its design, made substantial contribution to the interpretation of results and participated in drafting the manuscript. RP participated in the design of the study, selected the study subjects and coordinated the clinical monitoring. II participated in data acquisition and data management, and carried out the statistical analysis. PM participated in the design and in the coordination of the data collection. VF participated in the data management and statistical analysis. AM and GZ coordinated the mon-itoring of atmospheric pollutants and the analysis of envi-ronmental samples. BDO participated in design of the study and made substantial contribution in the interpre-tation of results.
Acknowledgements
The authors are grateful to Giorgio Cattani and Giordano Stacchini for the collection of PM samples, and to Drs Raffaele Antonelli Incalzi, Salvatore Basso, Raffaella Tiziana Benedetto, Anna Maria Della Corte, Leonello Fuso, Carmela Maiolo, Sandra Sammarro, Maria Serra, Salvatore Spadaro, Lorenzo Maria Tramaglino for the spirometries. A special thank goes to the two referees, Dr. Amanda Wheeler and Dr. Lewis Pepper, whose thought-ful suggestions helped us to greatly improve the presentation of results. The study has been funded by the Italian Ministry for the Environment (PR22-IS, 1998–2002).
References
1. Brunekreef B, Holgate ST: Air pollution and health. Lancet
360:1233-1242. 2002 Oct 19
2. Committee on Research Priorities for Airborne Particulate Matter, National Research Council. In Research priorities for air-borne particulate matter: I. Immediate priorities and a long-range research portfolio Washington, DC (USA): National Academy Press; 1998. 3. Utell MJ, Frampton MW: Who is susceptible to particulate
mat-ter and why? Inhal Toxicol 2000, 12(Suppl 1):37-40.
5. MacNee W, Donaldson K: Mechanism of lung injury caused by PM10 and ultrafine particles with special reference to COPD.
Eur Respir J 2003, 21(Suppl 40):47s-51s.
6. Kelly FJ: Oxidative stress: its role in air pollution and adverse health effects. Occup Environ Med 2003, 60:612-616.
7. Risom L, Moller P, Loft S: Oxidative stress-induced DNA dam-age by particulate air pollution. Mutat Res 2005, 592:119-137. 8. Roberts ES, Richards JH, Jaskot R, Dreher KL: Oxidative stress
mediates air pollution particle-induced acute lung injury and molecular pathology. Inhal Toxicol 2003, 15:1327-1346. 9. Holgate ST, Sandstrom T, Frew AJ, Stenfors N, Nordenhall C, Salvi S,
Blomberg A, Helleday R, Soderberg M: Health effects of acute exposure to air pollution. Part I: Healthy and asthmatic sub-jects exposed to diesel exhaust. Res Rep Health Eff Inst 2003,
112:1-30. discussion 51-67.
10. Lay JC, Bennett WD, Ghio AJ, Bromberg PA, Costa DL, Kim CS, Koren HS, Devlin RB: Cellular and biochemical response of the human lung after intrapulmonary instillation of ferric oxide particles. Am J Resp Cell Mol Biol 1999, 20:631-642.
11. Zhou Y-M, Zhong C-Y, Kennedy IM, Pinkerton KE: Pulmonary responses of acute exposure to ultrafine iron particles in healthy adult rats. Environ Toxicol 2002, 18:227-235.
12. Sunyer J: Urban air pollution and chronic obstructive pulmo-nary disease. Eur Respir J 2001, 17:1024-1033.
13. Desqueyroux H, Momas I: Pollution atmosphérique et santé: une synthèse des études longitudinales de panel publiées de 1987 à 1998. Rev Epidemiol Sante Publique 1999, 47:361-375. 14. Desqueyroux H, Momas I: Impact à court terme de la pollution
atmosphérique urbaine sur l'insufficence respiratoire par bronchopneumopathie chronique obstructive (BARPCO). Synthèse des études publiées de 1962 à Janvier 2000. Rev Epi-demiol Sante Publique 2001, 49:61-76.
15. Lebowitz MD, Collins L, Holberg CJ: Time series analyses of res-piratory responses to indoor and outdoor environmental phenomena. Environ Res 1987, 43:332-341.
16. Moseholm L, Taudorf E, Frøsig A: Pulmonary function changes in asthmatics associated with low-levels SO2 and NO2 air pollu-tion, weather, and medicine intake. Allergy 1993, 48:334-344. 17. Peters A, Wichmann HE, Tuch T, Heinrich J, Heyder J: Respiratory
effects are associated with the number of ultrafine particles.
Am J Respir Crit Care Med 1997, 155:1376-1383.
18. Hiltermann TJ, Stolk J, van der Zee SC, Brunekreef B, de Bruijne CR, Fischer PH, Ameling CB, Sterk PJ, Hiemstra PS, van Bree L: Asthma severity and susceptibility to air pollution. Eur Respir 1998,
11:686-693.
19. Higgins BG, Francis HC, Yates CJ, Warburton CJ, Fletcher AM, Reid JA, Pickering CA, Woodcock AA: Effects of air pollution on symptoms and peak expiratory flow measurements in sub-jects with obstructive airways disease. Thorax 1995,
50:149-155.
20. Harre ES, Price PD, Ayrey RB, Toop LJ, Martin IR, Town GI: Respi-ratory effects of air pollution in chronic obstructive pulmo-nary disease: a three month prospective study. Thorax 1997,
52:1040-1044.
21. Linn WS, Gong HJr, Clark KW, Anderson KR: Day-to-day particu-late exposures and health changes in Los Angeles area resi-dents with severe lung disease. J Air Waste Manag Assoc 1999,
49:108-115.
22. van der Zee SC, Hoek G, Boezen MH, Schouten JP, van Wijnen JH, Brunekreef B: Acute effects of air pollution on respiratory health of 50–70 yr old adults. Eur Respir J 2000, 15:700-709. 23. Shamoo DA, Linn WS, Peng RC, Solomon JC, Webb TL, Hackney JD,
Gong H Jr: Time-activity patterns and diurnal variation of res-piratory status in a panel of asthmatics: implication for short-term air pollution effects. J Expo Anal Environ Epidemiol
1994, 4:133-148.
24. Taggart SC, Custovic A, Francis HC, Faragher EB, Yates CJ, Higgins BG, Woodcock A: Asthmatic bronchial hyperresponsiveness varies with ambient levels of summertime air pollution. Eur Respir J 1996, 9:1146-1154.
25. Pope CA 3rd, Kanner RE: Acute effects of PM10 pollution on
pul-monary function of smokers with mild to moderate chronic obstructive pulmonary disease. Am Rev Respir Dis 1993,
147:1333-1340.
26. Brauer M, Ebelt ST, Fisher TV, Brumm J, Petkau AJ, Vedal S: Expo-sure of chronic obstructive pulmonary disease patients to
particles: respiratory and cardiovascular health effects. J Expo Anal Environ Epidemiol 2001, 11:490-500.
27. National Heart, Lung, and Blood Institute (NIHLBI). In Guide-lines for the diagnosis and management of asthma Bethesda, MD (USA): National Institute of Health (NIH), NIH Publication No 97-4051; 1997.
28. American Thoracic Society: Standardization of Spirometry, 1994 Update. Am J Respir Crit Care Med 1995, 152:1107-1136. 29. Quanjer PH, Tammeling GJ, Cotes JE, Pedersen OF, Peslin R, Yernault
JC: Lung volumes and forced ventilatory flows. Report Work-ing Party Standardization of Lung Function Tests, European Community for Steel and Coal. Official Statement of the European Respiratory Society. Eur Respir J Suppl 1993, 16:5-40. 30. Bernareggi M, Cremona : Measurements of exhaled nitric oxide in humans and animals. Pulm Pharmacol Ther 1999, 12:331-352. 31. US EPA: Air quality criteria for particulate matter 1996 [http://
cfpub.epa.gov/ncea/cfm/recordisplay.cfm]. US Environmental Protec-tion Agency, Report n. EPA/600/P-95/001aF
32. Cattani G, Stacchini G, D'Innocenzio F, Marconi A, Ziemacki G: Con-fronto tra campionatori per il prelievo della frazione di polv-eri aerodisperse PM10. In Proceedings of the II European Congress of Industrial Hygiene Edited by: Soleo L, Apostoli P, Cavallo D, Cottica D, Nano G, Ambrosi L. Pavia : Fondazione Maugeri; 411–414 [Symposia – I Congressi della Fondazione Maugeri, vol 2.]; 2000. 30 June – 3 July 1999 Bari
33. European Standard 12341. In Air quality – Determination of the PM10 fraction of suspended particulate matter – Reference method and field test procedure to demonstrate reference equivalence of measurement methods Brussels: CEN; 1998.
34. Diggle PJ, Heagerty P, Liang K-Y, Zeger SL: Analysis of longitudinal data
second edition. New York (USA): Oxford University Press, Oxford Statistical Science Series 25; 2002.
35. StataCorp: Stata Statistical Software Release 8.0 College Station, TX (USA): Stata Corporation; 2003.
36. Williams R, Suggs J, Zweidinger R, Evans G, Creason J, Kwok R, Rodes C, Lawless P, Sheldon L: The 1998 Baltimore particulate matter epidemiology-exposure study: Part 1: Comparison of ambi-ent, residential outdoor, indoor and apartment particulate matter monitoring. J Expo Anal Environ Epidemiol 2000,
10:518-532.
37. Williams R, Suggs J, Creason J, Rodes C, Lawless P, Kwok R, Zwei-dinger R, Sheldon L: The 1998 Baltimore particulate matter epidemiology-exposure study: Part 2. Personal exposure assessment associated with an elderly study population. J Expo Anal Environ Epidemiol 2000, 10:533-543.
38. White AJ, Gompertz S, Stockley RA: The aetiology of exacerba-tions of chronic obstructive pulmonary disease. Thorax 2003,
58:73-80.
39. Tao F, Gonzales-Flecha B, Kobzik L: Reactive oxygen species in pulmonary inflammation by ambient particulate. Free Radic Biol Med 2003, 35:327-340.
40. Brown JS, Zeman KL, Bennett WD: Ultrafine particle deposition and clearance in the healthy and obstructed lung. Am J Respir Crit Care Med 2002, 166:1240-1247.
41. Morawska L, Zhang J: Combustion sources of particles: 1. Rele-vance of sources signatures. Chemosphere 2002, 49:1045-1058. 42. Moreno T, Merolla L, Gibbons W, Greenwell L, Jones T, Richards R:
Variations in the source, metal content and bioreactivity of technogenic aerosols: a case study from Port Talbot, Wales, UK. Sci Total Environ 2004, 333:59-73.
43. Seaton A, Dennekamp M: Hypothesis: ill health associated with low concentrations of nitrogen dioxide – an effect of ultrafine particles? Thorax 2003, 58:1012-1015.