Open Access
Research
Quantifying the effectiveness of climate change mitigation through
forest plantations and carbon sequestration with an integrated
land-use model
Jelle G van Minnen
1, Bart J Strengers
2, Bas Eickhout
2, Rob J Swart
2and
Rik Leemans*
1Address: 1Environmental Systems Analysis Group, Wageningen University, P.O. Box 47, NL-6700 AA Wageningen, The Netherlands and 2Netherlands Environmental Assessment Agency (MNP), P.O. Box 303, NL-3720 AH Bilthoven, The Netherlands
Email: Jelle G van Minnen - [email protected]; Bart J Strengers - [email protected]; Bas Eickhout - [email protected]; Rob J Swart - [email protected]; Rik Leemans* - [email protected]
* Corresponding author
Abstract
Background: Carbon plantations are introduced in climate change policy as an option to slow the build-up of atmospheric carbon dioxide (CO2) concentrations. Here we present a methodology to evaluate the potential effectiveness of carbon plantations. The methodology explicitly considers future long-term land-use change around the world and all relevant carbon (C) fluxes, including all natural fluxes. Both issues have generally been ignored in earlier studies.
Results: Two different baseline scenarios up to 2100 indicate that uncertainties in future land-use change lead to a near 100% difference in estimates of carbon sequestration potentials. Moreover, social, economic and institutional barriers preventing carbon plantations in natural vegetation areas decrease the physical potential by 75–80% or more.
Nevertheless, carbon plantations can still considerably contribute to slowing the increase in the atmospheric CO2 concentration but only in the long term. The most conservative set of assumptions lowers the increase of the atmospheric CO2 concentration in 2100 by a 27 ppm and compensates for 5–7% of the total energy-related CO2 emissions. The net sequestration up to 2020 is limited, given the short-term increased need for agricultural land in most regions and the long period needed to compensate for emissions through the establishment of the plantations. The potential is highest in the tropics, despite projections that most of the agricultural expansion will be in these regions. Plantations in high latitudes as Northern Europe and Northern Russia should only be established if the objective to sequester carbon is combined with other activities.
Conclusion: Carbon sequestration in plantations can play an important role in mitigating the build-up of atmospheric CO2. The actual magnitude depends on natural and management factors, social barriers, and the time frame considered. In addition, there are a number of ancillary benefits for local communities and the environment. Carbon plantations are, however, particularly effective in the long term. Furthermore, plantations do not offer the ultimate solution towards stabilizing CO2 concentrations but should be part of a broader package of options with clear energy emission reduction measures.
Published: 15 April 2008
Carbon Balance and Management 2008, 3:3 doi:10.1186/1750-0680-3-3
Received: 20 December 2007 Accepted: 15 April 2008
This article is available from: http://www.cbmjournal.com/content/3/1/3
© 2008 van Minnen et al; licensee BioMed Central Ltd.
Background
Climate on earth is changing and this has led to a series of impacts on the environment and human society [1]. This climate change is most likely caused by the increased greenhouse gas concentration with carbon dioxide (CO2) as the most important gas [2]. The United Nations Frame-work Convention on Climate Change (UNFCCC) in its mandate to limit future climate change and its impacts, aims to 'stabilize greenhouse gas (GHGs) concentrations in the atmosphere at a level that would prevent dangerous anthropogenic interference with the climate system' (Arti-cle 2 [3]). Many studies have compared emission reduc-tion strategies to achieve different stabilizareduc-tion levels of CO2 and quantified their consequences (e.g. [4,5]). Most of these studies concentrate on reducing energy-related CO2 emissions and ignore abatement options that enhance CO2 uptake (or increase C sinks) by the bio-sphere. Such uptake also slows down the concentration increase.
The Kyoto Protocol, drafted in 1997 and entered into force in 2005, includes quantitative targets for industrial countries (the so-called "Annex B") to limit the emissions of six GHGs (CO2, CH4, N2O, and three fluorinated gases) by the 2008–2012 period. In addition to reducing emis-sions from fossil fuel burning, the Kyoto Protocol pro-vides explicit opportunities for Annex B countries to partly achieve their reduction commitments by planting new forests, or by managing existing forests or agricultural land differently (so-called Land-Use, Land-Use Change and Forestry measures: LULUCF). The presumption of these LULUCF options is that removing CO2 from the atmosphere can also contribute to the stabilization of the atmospheric CO2 concentration and thus to a limitation of climate change. After the Kyoto Protocol was signed, a number of technical issues regarding the use of carbon plantations in achieving the country commitments remained open. For example, it has been unclear how to quantify the LULUCF potential, both in the short and the long terms. Furthermore, criticism on establishing new forests (so-called carbon plantations) as a mitigation strat-egy were related to the permanency of sequestration and whether the sequestration is additional to default devel-opments (e.g. [6]). Permanency is uncertain, since the pressure on land for other purposes than carbon planta-tions may increase considerably in the near future along with shifts in disturbance regimes. The Food and Agricul-ture Organization of the United Nations (FAO), for exam-ple, projects considerable increases in arable land needed for food production [7], whereas land requirements for modern biofuels are increasing considerably as well [8]. Furthermore, the Kyoto Protocol clearly states that activi-ties should not be in conflict with existing conventions, such as the Convention on Biological Diversity. Thus
land-use changes that drive losses in biodiversity should be prevented [9].
The Kyoto Protocol has resulted in several studies estimat-ing the sequestration potential in plantations. The IPCC's special report on Land use, land-use change and forestry (LULUCF), for example, suggests that there is a potential to sequester an additional 87 Pg C by 2050 in global for-ests alone [10]. Other studies even suggest that land-based mitigation could be cost-effective compared to energy-related mitigation options, and could provide a large pro-portion of the total mitigation [11,12]. However, it is often difficult to compare the results of these studies because they differ in terms and definitions and methods used. Furthermore, studies determine the sequestration potential in specific regions or specific land-cover types (e.g. [13-15]). Finally, there are studies that incorporate crude assumptions for future land-use change. For exam-ple, Sathaye et al. [16] based their projections of C sinks on linear extrapolation of continuing deforestation and afforestation rates, whereas Sohngen & Sedjo [17] only considered an increase in forest product demand, discard-ing future food demand.
The main objective of this paper is to present a methodol-ogy that quantifies the possible role of C plantations around the world in mitigating the build-up of CO2 in the atmosphere at different cost levels and assumptions; it also takes into account the aforementioned limitations and concerns. We specifically address the issue of net car-bon sequestration, including the continued carcar-bon sequestration of the original natural vegetation. Moreo-ver, we only consider the carbon sequestration potential in regions that are not used for other ecosystem services (like food supply), and include future land-use change. In this study we use the methodology as being implemented in the IMAGE-2 model (Integrated Model to Assess the Global Environment [18]) to show the long-term poten-tial in eighteen different world regions.
Results
within our projected "social potential" may be larger than that within the physical potential. The final step 3 (= eco-nomic potential, including also land and establishment costs) is described in detail in Strengers et al [19], includ-ing the sequestration potential. The experiments differ with respect to the used management of the carbon plan-tations and baseline scenarios used. The latter refer to the IPCC SRES A1b and B2 baseline scenarios [20] (see sec-tion on Model applicasec-tion for differences between these scenarios). Regarding management, the carbon planta-tions are either harvested at regular intervals or not har-vested at all (called permanent carbon plantation). These management options can have a considerable effect on the uptake potential of plantations (see methodology sec-tion).
Experiments 1, 2 and 3: Physical potential of carbon plantations
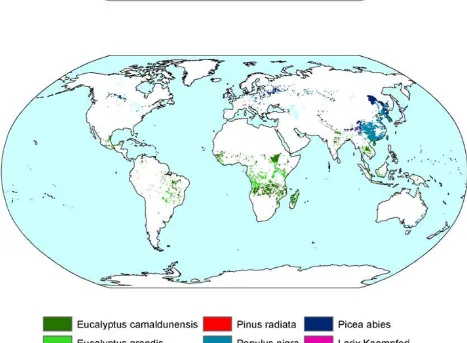
In these experiments carbon plantations are established wherever they can grow and wherever they are carbon-effective compared to the baseline. Under this assump-tion, the six plantation types are found to be effective over large areas around the world (Figure 1). Under the A1b baseline scenario, about 3990 and 3850 Mha (i.e. 1010
m2) plantations can be established under the permanent
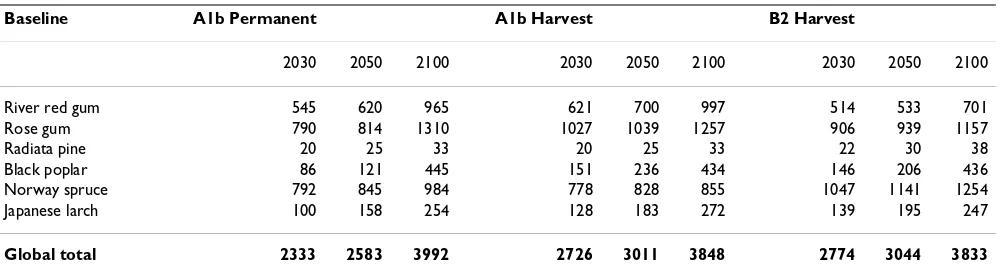
and frequent-harvest management options, respectively up to 2100 (Table 1). Plantations of gum species ( Eucalyp-tus spp.), for example, are projected for establishment mainly in regions that are currently covered by savanna, woodland and even some tropical forest. The potential over the next few decades is limited because much land is needed for agricultural production (this land cannot be used because of the assumption that current and future agricultural land is to be excluded). Under the alternative B2 baseline scenario less land is projected to become available for plantations than under the A1b baseline, due to greater demand for agricultural land. The projected dif-ference between the two management options (i.e. har-vested or permanent plantations) has two reasons. First, the difference results from the assumption for permanent plantations that abandoned agricultural land is not
avail-able if the re-grown natural forest is used at a later stage to fulfill the wood demand. Second, close to 2100 perma-nent plantations are estimated to be more widely distrib-uted because the CO2 emissions related to the harvest of plantations need to be compensated before harvested plantations become an effective C sink.
The projected cumulative physical C sequestration of plantations in the A1b scenario is 583 Pg C and 913 Pg C up to 2100 for the permanent and harvest options, respec-tively (Figure 2). Under the B2 baseline scenario, the cumulative potential is estimated to be 858 Pg C, consid-ering frequent harvests (i.e. 6% less compared to A1b). These uptake rates equal about 37% and 58% of the pro-jected overall CO2 energy and industry emissions in the
A1b scenario for the permanent and harvest options, respectively. Under the B2 baseline, the estimated uptake is even 67% of the energy and industry emissions. Hence, the projected long-term physical potential of carbon plan-tations for slowing down the atmospheric CO2 increase is
large. However, it will take more than 20 years to compen-sate for carbon emissions related to the establishment of the plantations. The projected physical potential up to 2020 is negligible where the cumulative potential up to 2030 is about 100–150 Pg C (Figure 2).
The two management options show a higher C sequestra-tion potential in the case of harvested carbon plantasequestra-tions, especially beyond 2050 (Figure 2). This is caused by a decreasing sequestration rate for permanent carbon plan-tations, whereas the uptake potential remains high if a car-bon plantation is frequently harvested harvests. This difference is induced by the C sequestration of plantations decreasing with age. The average age increases in perma-nent plantations but remains low in the frequent harvest case. This difference is projected specifically for planta-tions in Latin America and Africa.
Geographically speaking, the highest physical sequestra-tion rates have been projected for plantasequestra-tions in tropical regions like South America and Africa, dominated by the
Table 1: Physical potential distribution of carbon plantations (in Mha).
Baseline A1b Permanent A1b Harvest B2 Harvest
2030 2050 2100 2030 2050 2100 2030 2050 2100
River red gum 545 620 965 621 700 997 514 533 701
Rose gum 790 814 1310 1027 1039 1257 906 939 1157
Radiata pine 20 25 33 20 25 33 22 30 38
Black poplar 86 121 445 151 236 434 146 206 436
Norway spruce 792 845 984 778 828 855 1047 1141 1254
Japanese larch 100 158 254 128 183 272 139 195 247
Physical (top) and social (bottom) potential distribution of permanent carbon plantations in 2100 using the A1b scenario
Figure 1
two Eucalyptus plantation types (Figure 2). The projected sequestration potential is relatively low in high latitudes, because of low growth rates. In various parts of Canada and Russia, the net cumulative carbon sequestration even remains negative for about 50 years.
Experiments 4, 5 and 6: Social potential of carbon plantations
We assessed the social sequestration potential of C planta-tions up to 2100 using wood availability and nature con-servation as main constraints in addition to the food security criterion. These constraints have been imple-mented by estimating the potential on abandoned agri-cultural land only. Assuming permanent carbon plantations (Experiment 4), 181 and 831 Ma are projected in the A1b scenario potentially to be established around the world up to 2050 and 2100, respectively (Table 2). In
the case of harvested carbon plantations, the area availa-ble in 2100 is projected to be 1014 and 695 Mha under the A1b and B2 baseline scenarios, respectively (Experi-ments 5 & 6). The difference between the baseline scenar-ios is caused by a larger land abandonment under the A1b baseline scenario than under the B2 baseline. The differ-ence between the two management options is caused by the assumption for permanent carbon plantations that abandoned agricultural land is not available if the re-grown natural forest is needed at a later stage to fulfill the wood demand. For frequently harvested carbon planta-tions, the timber from the plantations is used to fulfill the wood demand, reducing the pressure on existing forests. Similar to the physical potential, the difference between the management options is projected to decrease near to 2100 because the CO2 emissions related to the harvest need to be compensated before the plantations become
Cumulative physical global (top) and regional (bottom) C sequestration potential (CSeq)
Figure 2
Cumulative physical global (top) and regional (bottom) C sequestration potential (CSeq). The regional figure illustrates the trend in the A1b harvest experiment (in Pg C).
-200
0
200
400
600
800
1000
Up
ta
k
e
(Pg
C)
A1b harvest A1b permanent B2 harvest
2000
2020
2040
2060
2080
2100
Year
Up
ta
k
e
(Pg
C)
-100
100
200
300
400
South America Western Africa South East Asia Former USSR Canada
an effective C sink. As a consequence, fewer harvested plantations will be established.
The majority of the carbon plantations is projected in all the experiments to be established after 2050, because land only becomes available then, due to decreasing popula-tion and increasing efficiency. The projected cumulative global social C sequestration potential remains low in the coming decades (Figure 3), and, up to 2050, reaches 12–17 Pg C for the different baselines and harvest regimes (Table 3). Under the A1b scenario the potential increases
up to 93 and 133 Pg C in 2100 for permanent and har-vested plantations, respectively (Figure 3 and Table 3). This is 5–7% of the projected cumulative emissions up to 2100 coming from the energy and industry sector (i.e. about 1740 Pg C). The potential uptake up to 2100 under the B2 scenario is 68 Pg C, implying 5% of the energy and industry emissions (i.e. 1272 Pg C). The net C sequestra-tion potential can be higher under a frequent harvest regime due to a higher area-based uptake and the broader distribution. Comparing the 2 baseline scenarios, the pro-jected global sequestration of carbon plantations in 2100
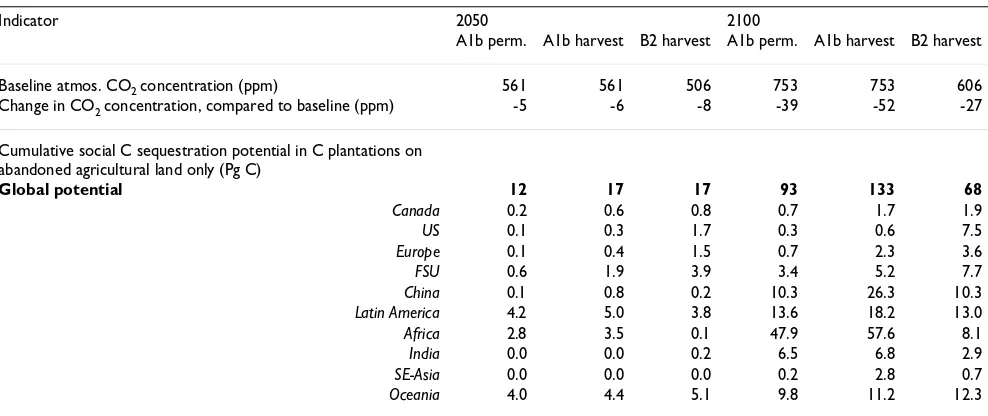
Table 3: Implications of establishing carbon plantations on abandoned agricultural land.
Indicator 2050 2100
A1b perm. A1b harvest B2 harvest A1b perm. A1b harvest B2 harvest
Baseline atmos. CO2 concentration (ppm) 561 561 506 753 753 606
Change in CO2 concentration, compared to baseline (ppm) -5 -6 -8 -39 -52 -27
Cumulative social C sequestration potential in C plantations on abandoned agricultural land only (Pg C)
Global potential 12 17 17 93 133 68
Canada 0.2 0.6 0.8 0.7 1.7 1.9
US 0.1 0.3 1.7 0.3 0.6 7.5
Europe 0.1 0.4 1.5 0.7 2.3 3.6
FSU 0.6 1.9 3.9 3.4 5.2 7.7
China 0.1 0.8 0.2 10.3 26.3 10.3
Latin America 4.2 5.0 3.8 13.6 18.2 13.0
Africa 2.8 3.5 0.1 47.9 57.6 8.1
India 0.0 0.0 0.2 6.5 6.8 2.9
SE-Asia 0.0 0.0 0.0 0.2 2.8 0.7
Oceania 4.0 4.4 5.1 9.8 11.2 12.3
Table 2: Social potential distribution of carbon plantations with establishment on abandoned agricultural land only (in Mha).
Baseline A1b Permanent A1b Harvest B2 Harvest
2030 2050 2100 2030 2050 2100 2030 2050 2100
River red gum 31 75 317 33 83 332 30 37 158
Rose gum 20 26 230 30 41 256 21 34 108
Radiata pine 2 2 3 2 2 3 2 2 3
Black poplar 16 24 192 23 83 219 31 84 163
Norway spruce 31 48 75 128 164 181 119 203 234
Japanese larch 4 5 14 11 16 22 15 23 29
Global total 105 181 831 228 390 1014 218 383 695
Canada 2.2 6.7 14.8 16.2 27.2 26.4 15.9 36.2 30.2
US 0.9 0.9 2.9 5.0 5.2 5.1 18.4 53.2 69.0
Europe 0.3 0.9 19.5 4.3 12.2 24.7 17.4 36.5 35.4
FSU 13.7 20.5 49.9 48.7 67.1 79.9 80.6 107.1 135.8
China 0.3 14.9 187.5 3.0 60.8 254.7 0.0 25.2 125.2
Latin America 40.0 47.7 102.9 76.3 85.9 133.3 35.5 56.6 63.8
Africa 6.4 43.5 314.6 10.5 61.1 326.1 0.4 1.6 124.8
India 0.4 0.4 54.8 0.6 0.6 56.5 1.2 1.2 27.2
SE-Asia 0.0 0.0 27.6 0.0 0.9 30.4 0.0 0.0 7.2
is 95% higher under the A1b scenario than in the B2 base-line (Table 3). This is mainly due to the higher establish-ment rates.
Geographically speaking, most plantations are projected for establishment in tropical regions (Figure 1 and Table 2). The consequences for the C sequestration are that under the A1b baseline scenario, 40–50% of the global potential can be sequestered in plantations in Africa, 10–20%, in China, 10% in Latin America, and 10% in Oceania (Table 3). Although a considerable amount of abandoned agricultural land is projected for Europe, Can-ada and the FSU as well, the effectiveness of establishing C plantations here is projected as being rather limited. For example, 6% of the global potential area can be estab-lished in the FSU up to 2100, sequestering only 4% of the global potential.
With respect to the social potential, evaluating the effec-tiveness of carbon plantations in slowing down the build-up of CO2 in the atmosphere shows that the concentration in 2100 under the A1b scenario can be reduced from 752 to 713 ppm (i.e. a 39 ppm reduction) when planting per-manent carbon plantations, whereas it reaches 700 ppm (i.e. a 52 ppm reduction) assuming frequently harvested plantations (Table 3). The two management options differ because of the broader distribution of carbon plantations when planting frequently harvested plantations and because of the additional C that will be stored in the soil compartment. The lower social sequestration potential projected under the B2 baseline scenario results, obvi-ously, in a lower effectiveness. Assuming frequently har-vested carbon plantations, we project a CO2 concentration of 579 ppm in 2100, which is 27 ppm less than in the baseline.
Social C sequestration potential (CSeq) on abandoned agricultural land
Figure 3
Social C sequestration potential (CSeq) on abandoned agricultural land; top – annual (Pg C/yr), bottom – cumulative (Pg C).
0
50
100
2000
2020
2040
2060
2080
2100
year
Up
ta
k
e
(Pg
C)
A1b harvest
A1b permanent
B2 harvest
0
1
2
3
4
Up
ta
k
e
(Pg
C y
r
-1
)
A1b harvest
A1b permanent
B2 harvest
Discussion
The carbon sequestration potential in comparison with other studies
Here we have presented a methodology to assess the glo-bal and regional sequestering potential of carbon planta-tions established after 2000. Based on ecological and environmental constraints alone, carbon plantations can be effective in large parts of the world with a projected cumulative sequestering potential of 913 Pg C up to 2100. In the A1b baseline scenario this equals 52% of the total cumulative CO2 emissions from energy and industry from 2000 to 2100. In the B2 scenarios it is even 67%. The social sequestration potential is much lower but still con-siderable. The annual average global potential is projected at 0.1 – 0.2 Pg C yr-1 up to 2050, and 0.68–1.3 Pg C yr-1 up
to 2100 (Table 3). In 2100 this leads to a 27–52 ppm smaller increase in the atmospheric CO2 concentration and compensates for 5–7% of the total energy and indus-try related CO2 emissions. The sequestration potential is likely to considerably increase beyond 2100, because many plantations are projected to be established only close to the end of the 21st century. This holds especially
for regions where large areas of arable land are expected to be abandoned towards 2100, such as China.
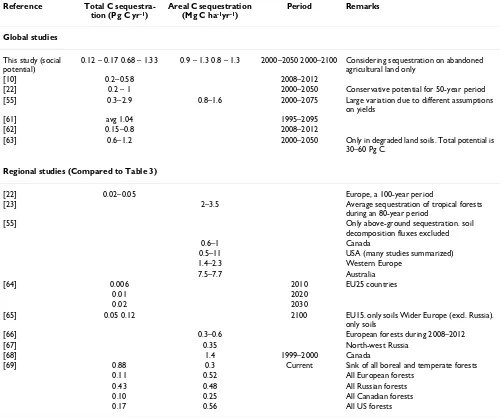
The social sequestration potential of the plantations pro-jected up to 2050 is at the low end of ranges found in the literature, whereas values for the coming 100 years are more in line (Table 4). Geographically, the most effective plantations are located in tropical regions, whereas due to low growth rates the C sequestration in high latitudinal plantations is limited (Table 3). This is in line with the findings of Masera et al. [21] and Cannell [22]. Many other estimates are especially useful in a comparison with our area-based potentials, because the studies often focus on the C sequestration potential in existing forests (Table 4). For example, the projected social C sequestration potential of tropical plantations of Latin America and Africa (1.6–1.9 Mg C ha-1 yr-1 for 2000–2100), is found at
the low end of the range given by Silver et al. [23]. Our projections for Europe up to 2100 – between 0.3 and 1.1 Mg C ha-1 yr-1 – are well in line with the projected area-based uptake of 0.52 Mg C ha-1 yr-1 given by Liski et al [24]. Note that we have used a particular definition of "social potential", possibly causing differences with other studies in either direction. Areas that we excluded, for example, because of competition with other needs may be converted in reality, while areas that we included could not be appropriate for the establishment of plantations because of other social or institutional factors.
Despite the estimated considerable C sequestration potential up to 2100, the uptake potential for the coming decades is projected to be limited (Figure 3). It can take about 20 years to compensate for the emissions related to
the establishment of the plantations. Moreover, not much agricultural land will likely be abandoned in coming dec-ades due to the current and projected agricultural pres-sure. The limited potential in coming decades is in line with findings of Marland & Schlamadinger [25], who showed that the sequestration potential in forests estab-lished since 1990 is mainly relevant in the long term. As such, we do not confirm the suggestion of Kirschbaum [26] that plantations may help to buy some time in initi-ating emission reductions already in the next few decades.
The limited role of plantations in the coming decades might be caused by our assumptions that C plantations can only be established after 2000. Various other studies report afforestation activities in different locations around the world, even before 2000. Brown [27] and FAO [28], for example, reported that globally 124 Mha and 187 Mha forest plantations have been established up to 1995 and 2000, respectively. More than 90% of these plantations have been established in 30 countries only, mainly in such Asian countries as China (45 Mha), India (32 Mha), and Japan (11 Mha). Furthermore, various studies report existing afforestation activities, but seldom account for deforestation in the same region (the so-called leakage effect). This has also been shown by others (e.g. [29]) by estimating an annual afforestation rate in the tropics of 2.6 Mha yr-1 throughout the 1980s, but at the same time a
deforestation rate of 15.4 Ma yr-1. In our methodology,
leakage is not possible because we only establish planta-tions on land that is available for the entire simulation period (i.e. up to 2100). Finally, our projections are lower than in other studies that account for the C sequestration in forests planted for various other reasons (e.g. recrea-tion, agroforestry and soil restoration). For India, for example, we have project a negligible afforestation poten-tial up to 2030 because of the large pressure on the land for food production. Nevertheless, Ravindranath & Somashekhar [30] reported an afforestation rate of India of 1.6 Mha yr-1, mainly for agroforestry purposes. Again,
these afforestation rates are partly counterbalanced by deforestation activities in India [30,31].
The methodology in relation to conventions and protocols
The methodology presented is aimed at quantifying the sequestration potential of carbon plantations around the world, in consideration of the requirements mentioned in different conventions and protocols. The UN Framework Convention on Climate Change [3] and its underlying Kyoto Protocol, which opened the possibility for devel-oped countries to use afforestation programs in achieving their reduction commitments, clearly stress that C planta-tions are only effective in the long term if (see also [10,32,33]):
• all C fluxes are considered (i.e. full C accounting);
• they are permanent. If not, a carbon plantation has little value in terms of actually reducing the concentration of GHG in the atmosphere, since carbon sequestered over various years will return to the atmosphere;
• the credited C sequestration in one region is not to be compensated by C losses elsewhere (i.e. no leakage [34]),
• the C sequestration in plantations exclude 'indirect human influences' in terms of, for example, climate and CO2 change.
The additionality issue has been taken into account in the methodology presented by considering the sequestration
potential of both plantations and natural ecosystems. Fur-thermore, the methodology considers all C fluxes by keep-ing track of fluxes in both vegetation and soil, plus the carbon losses due to the establishment of the plantations. The permanency concern is taken into account by compar-ing the C plantation option with various other land-use options. Alternative land-use options pose a main threat to the permanency of a carbon plantation, especially in the long term (e.g. when the demand for agricultural land fluctuates or prices of land-use products change). Since permanency is more certain if plantations are established in areas that are not used for food, fodder and timber pro-duction, areas needed for agriculture or wood up to 2100 have been excluded in the all experiments. As mentioned earlier, leakage is not possible in the methodology pre-sented because we only establish plantations on land Table 4: Comparison of existing C sequestration projections.
Reference Total C
sequestra-tion (Pg C yr-1)
Areal C sequestration
(Mg C ha-1yr-1)
Period Remarks
Global studies
This study (social potential)
0.12 – 0.17 0.68 – 1.33 0.9 – 1.3 0.8 – 1.3 2000–2050 2000–2100 Considering sequestration on abandoned
agricultural land only
[10] 0.2–0.58 2008–2012
[22] 0.2 – 1 2000–2050 Conservative potential for 50-year period
[55] 0.3–2.9 0.8–1.6 2000–2075 Large variation due to different assumptions
on yields
[61] avg 1.04 1995–2095
[62] 0.15–0.8 2008–2012
[63] 0.6–1.2 2000–2050 Only in degraded land soils. Total potential is
30–60 Pg C.
Regional studies (Compared to Table 3)
[22] 0.02–0.05 Europe, a 100-year period
[23] 2–3.5 Average sequestration of tropical forests
during an 80-year period
[55] Only above-ground sequestration. soil
decomposition fluxes excluded
0.6–1 Canada
0.5–11 USA (many studies summarized)
1.4–2.3 Western Europe
7.5–7.7 Australia
[64] 0.006 2010 EU25 countries
0.01 2020
0.02 2030
[65] 0.05 0.12 2100 EU15. only soils Wider Europe (excl. Russia).
only soils
[66] 0.3–0.6 European forests during 2008–2012
[67] 0.35 North-west Russia
[68] 1.4 1999–2000 Canada
[69] 0.88 0.3 Current Sink of all boreal and temperate forests
0.11 0.52 All European forests
0.43 0.48 All Russian forests
0.10 0.25 All Canadian forests
available for the entire simulation period (i.e. up to 2100). Finally, the methodology accounts only for carbon sequestered directly by the plantations, corrected for cli-mate change and CO2 fertilization (i.e. indirect human influences). This has been done both for the historical uptake – where we corrected 1995 growth rates for observed changes in CO2 and climate (see Equation 2) –
as well as the projected future (reducing the projected social potential in the supply curves for climate and CO2 changes in the baseline).
The effectiveness of carbon plantations in a broader environmental context
The effectiveness of harvesting plantations and using the biomass to displace fossil fuels and/or timber, compared to having carbon stored in a permanent plantation, depends to a great extent on the displacement factor (i.e. the extent to which wood from carbon plantations can be effectively used to replace fossil fuels) [35]. Here, a dis-placement factor of 'one' is assumed. Theoretically this can be achieved if fossil fuels are displaced by harvested wood [22,36]. However, if the displacement factor is (much) smaller than 'one', the environmental effective-ness of harvested plantations decreases sharply. Likewise, establishing carbon plantations is, in general, less effective than avoiding deforestation (especially in tropical regions, [37,16]). This, however, is associated with vari-ous social difficulties and avoiding deforestation in one region may be counterbalanced by additional deforesta-tion elsewhere.
The effectiveness of carbon plantations in especially high latitudes is questioned because of the effect on different biophysical processes (i.e. changed radiation balance) that may counterbalance the additional C sequestration [38-40]. On the basis of the albedo effect and the pro-jected low net sequestration potential for high latitudinal plantations (i.e. in parts of Canada and Russia the net C sequestration even remains negative for about 50 years), the establishment of carbon plantations in high latitudes is only favorable if the objective to sequester carbon is combined with other environmental considerations. For example, plantations may also contribute to water protec-tion and soil erosion control [21,41].
An environmental constraint often mentioned for large-scale C plantations is the availability of water and nitro-gen [41-43]. Also in the methodology presented, the high growth rates of the carbon plantations (compared to nat-ural forests) rely on a high level of management, includ-ing nitrogen fertilization for plantations situated on poor or degraded soils. The additional use of water and ferti-lizer should indeed be a concern in the planning and management of the plantation, especially because a (higher) fertilizer use could imply additional emissions of
N2O, which were neither accounted for in our study, nor in most other studies. Likewise, afforestation activities have recently also been questioned in the context of pos-sible additional methane emissions from trees – the sec-ond-most important greenhouse gas [44]. Although this issue is currently still under scientific debate, the effective-ness of afforestation programs would be reduced by a maximum of 10%. This has been confirmed by others (see, for example, [45] for a more detailed discussion).
Conclusion
We have presented a rule-based methodology to quantify the long-term physical and social sequestration potential of carbon plantations up to the end of the 21st century and
their effectiveness in slowing down the increase in atmos-pheric CO2. Applying the methodology, we conclude that projected potentials differ considerably for different experiments, regions and management options. For exam-ple, we projected a nearly 100% difference in the seques-tration potential up to 2100 between two baseline scenarios, showing the effect of uncertainties in future land use. Nevertheless, in all cases the C sequestration potential can be substantial. Even under a conservative set of assumptions, the cumulative sequestration potential up to 2100 compensates for 5–7% of the total energy and industry related CO2 emissions. But the sequestration potential is substantial only in the long term. The poten-tial for the coming decades is limited due to the limited amount of available land and the long period needed to compensate for emissions related to the establishment of the plantations. Geographically speaking, plantations in tropical regions are most effective. The C sequestration potential of plantations in high latitudes is low and because of biophysical feedbacks on the climate system its effectiveness can even be questioned. The establishment of plantations in these regions is only favorable if the objective to sequester carbon is combined with other environmental considerations.
Finally, our analysis showed that C sequestration in plan-tations may be substantial and thus can help to slow down the future increase in atmospheric CO2. But C plan-tations do not represent the ultimate solution to the prob-lem of establishing a stabilization of the atmospheric CO2
concentration. They should form part of a broader pack-age of options, with clear measures for also reducing energy emissions.
Methodology
The algorithmof the long-term potential of carbon plantations in differ-ent parts of the world in mitigating the build-up of CO2 in
the atmosphere. We distinguish different potentials, defined according IPCC definitions [46]. The methodol-ogy consists of three steps (Figure 4). The first step is to determine the physical sequestration potential of C planta-tions, accomplish by adding carbon plantations as a new land cover class in IMAGE 2 (see below for a general description of the IMAGE 2 model). All carbon pools and fluxes of the potential carbon plantations (e.g. Net Pri-mary Production – NPP and Net Ecosystem Productivity – NEP) are calculated by the IMAGE-2 terrestrial C-cycle model, taking environmental (e.g. climate and atmos-pheric CO2) and local conditions (e.g. soil) into consider-ation. In the second step, the social potential of plantations is determined using the restriction 'no interference with food supply and nature conservation'. In the third step, the social potential is transferred into the economic
potential by linking the C sequestration potential to establishment and land costs. The resulting marginal abatement cost curves can be used to compare the poten-tial of carbon plantations with other mitigation strategies using cost minimization (e.g. [47]). The focus of this paper is on describing and analyzing steps 1 and 2 of the methodology. We will also summarize step 3 (i.e. eco-nomic potential), but refer for details on this to the com-panion paper by Strengers et al. [19].
Step 1: The physical sequestration potential
The starting point for this step is the potential distribution
of C plantations around the world. Six plantations types were selected on the basis of the 'Top 14 Most Planted World's Trees' [28,48] to represent suitable species in dif-ferent climatic zones around the world (Table 5). We used, for example, gum species (Eucalyptus spp.) for the tropical regions, and spruce (Picea abies) and larch (Larix
Steps to quantify sequestration potential of carbon plantations
Figure 4
Steps to quantify sequestration potential of carbon plantations.
C-sequestration potential compared
to baseline
Characteristics for six representative tree species
Harvest regime
Two stages:
(1) establishment of plantations on specific locations under certain restriction (2) C-Sequestration supply curves per IMAGE region and every five years
Construction of cost supply
curves
Land costs
Establishment costs
Barriers like implementation factors,
€ T-1C Cost supply curves
IMAGE
Comparison of different mitigation
options
IMAGE
Step 1
(physical potential)
Step 2
(social potential)
Step 3
(economic potential)
Ha
Mt C
kaempferi) for plantations in cool and boreal regions, respectively. 'Potential distribution' in this context refers to the availability and suitability of land. Land is assumed to be available when it is not assigned as protected area and no longer used for agriculture (neither cropland nor pasture). Hence, a more realistic potential is provided, given the many other land-use purposes that may expand in the (short-term) future. Suitability of land is driven by various environmental conditions in terms of climate and soil. All these conditions need to be fulfilled to allow a specific plantation type in a certain region. The climatic characteristics of the plantations are derived from the best matching Plant Functional Types (PFT) – classes of plant species grouped according to physiological characteristics and the sensitivity to changes in temperature and water availability (Table 5).
Secondly, the best growing plantations out of these six types are determined for each grid cell by using the param-eters describing the C dynamics (e.g. lifetimes, allocation fractions). These parameters of the different plantation types are linked to the parameters used for the natural land-cover type that best matches the plantation type con-sidered (Tables 5 &6; [49,19]). The Net Primary
Produc-tion (NPPCPts) rates averaged over the longest likely
rotation length (LRL) of each plantation type (Equation 1) are compared. The longest LRL has been chosen to take into account the period needed to reach the maximum NPP for all possible plantation types.
NPPCPts(t) = RF(t)·FNPPlct(ts)(t)·AGFts (1)
where
ts Index for tree species in a carbon plantation (1,..,6)
lct(ts) Land cover type by which the carbon dynamics of tree species (ts) are described (Table 1)
RF(t) Reduction Factor (≤1) during the period towards maximum average growth in terms of NPP, i.e. the recov-ery time (-) (Table 1)
FNPPlct(ts)(t) NPP of full-grown natural vegetation in year t if the grid cell were to be covered by land-cover type lct(ts), as computed by the IMAGE 2 C cycle model (Mg C ha-1 yr-1)
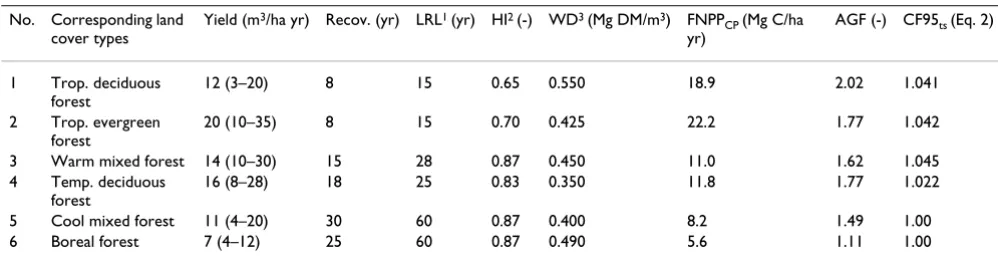
Table 6: The carbon characteristics of the selected tree species for carbon plantations.
No. Corresponding land
cover types
Yield (m3/ha yr) Recov. (yr) LRL1 (yr) HI2 (-) WD3 (Mg DM/m3) FNPP
CP (Mg C/ha
yr)
AGF (-) CF95ts (Eq. 2)
1 Trop. deciduous
forest
12 (3–20) 8 15 0.65 0.550 18.9 2.02 1.041
2 Trop. evergreen
forest
20 (10–35) 8 15 0.70 0.425 22.2 1.77 1.042
3 Warm mixed forest 14 (10–30) 15 28 0.87 0.450 11.0 1.62 1.045
4 Temp. deciduous
forest
16 (8–28) 18 25 0.83 0.350 11.8 1.77 1.022
5 Cool mixed forest 11 (4–20) 30 60 0.87 0.400 8.2 1.49 1.00
6 Boreal forest 7 (4–12) 25 60 0.87 0.490 5.6 1.11 1.00
1 Likely Rotation Length: derived from [28] for both eucalyptus plantations; pine average of [48; 61; 71]; poplar based on [48; 71]; spruce based on
[61] and larch derived from yield tables (e.g. [72; 73]), use the moment that growth rates start to decline.
2 Harvest Index-based [34]
3 Wood density mainly based on [34]; If not available, use [71; 74; 75; 76].
Table 5: The climatic characteristics of the selected tree species for carbon plantations.
No Tree species Corresponding PFT Tcold (°C) Moisture2 GDD5
min
1 Eucalyptus camadulensis River red gum Tropical deciduous trees >15.5 0.45 to 0.8
2 Eucalyptus grandis Rose gum Tropical evergreen trees >15.5 0.8 to 1.0
3 Pinus radiate Radiata pine Temperate evergreen trees >5 0.55 to 0.95
4 Populus nigra Black poplar Temperate deciduous trees -15 to 15.5 0.65 to 1.0 1200
5 Picea abies Norway spruce Boreal evergreen trees -35 to -2 0.75 to 1.0 350
6 Larix kaempferi Japanese Larch Boreal deciduous trees < 5 0.65 to 1.0 350
1 T
cold is the average temperature of the coldest month.
2Moisture is expressed as the ratio between actual and potential evapotranspiration [70]. The lower end of the range may decrease due to
increasing Water Use Efficiency. This is the result of increasing atmospheric CO2 levels. 3 GDD5
AGFts Additional Growth Factor of tree species ts (-), (Table 1, Equation 2)
The additional growth factor (AGFts, Equation 2) is defined as the growth rate of a plantation – based on a lit-erature review (Equation 3) – compared to the average growth of the natural land-cover type, corrected for histor-ical environmental changes – CF95ts. The latter correction factor is needed because the information taken from the literature on the NPP of plantations comprised, in gen-eral, data from around 1995. Following the rules in the Kyoto Protocol – stating that sequestration credits should only be based on 'direct human activities' – the NPP data needed to be adjusted. This is because these data include a growth stimulus caused by, among other factors, increasing CO2 concentrations (which form 'indirect human activities'). The CF95 value for each plantation type (Table 5) has been derived by applying the IMAGE-2 C-cycle model in order to define the growth stimulants from CO2 and climate since 1970. Note that we correct the
sequestration potential up to 2100 in a similar way:
where
FNPPCP,ts Average NPP of full grown plantations (Mg C ha-1 yr-1) around 1995 (Eq. 3)
NPPIlct(ts) Average NPP of all grid cells in 1970 covered by
land-cover type lct(ts) (Mg C ha-1 yr-1) [19]
CF95ts Correction Factor for climate-induced growth
stim-ulants for 1970–1995 (-).
FNPPCP can be derived from especially literature on plan-tations yields ([27,28,34,50,51] and Table 6). This infor-mation is subsequently used in Equation 3 (see also [19])
where
AS Allocation Fraction of Stems (= 0.3)
LS Lifetime of stems, based on the underlying land-cover types lct(ts) (yr)
AB Allocation Fraction of Branches (= 0.2)
LB Lifetime of branches, based on the underlying land-cover types lct(ts) (yr)
YLD Yield of a plantation averaged over a rotation (m3
Fresh Volume ha-1 yr-1); (Table 7)
WD Wood density (Mg dry matter.m-3 fresh volume; see
Table 1)
HI Average harvest index or the fraction of above-ground biomass used (Table 1) of which the remainder decom-poses to humus (-)
CF Average carbon factor or carbon content (Mg C m-3 dry
matter)
Recov Recovery time or the average time for a carbon plantation to reach maturity in terms of NPP (yr) (Table 6).
The last part in determining the physical potential (step 1) is to estimate the net C sequestration (CSeq) potential of the best growing species in a grid cell. This calculation is based on the concept of SPP (Surplus Potential Productiv-ity), as introduced by Onigkeit et al. [52]. The basic phi-losophy is to account only for the net C uptake of a plantation (Equation 4). This is calculated by using emis-sions associated with the conversion from natural land cover into a plantation and comparing the NEP flux of a plantation with the NEP flux of the natural vegetation that would otherwise grow in the area. As such, CSeq deter-mines the additionality compared to the situation of hav-ing no plantations. Note that a negative value of CSeq corresponds to a biospheric uptake of carbon from the atmosphere. In our application, the NEP fluxes are simu-lated by the terrestrial C cycle model of IMAGE 2, taking into account NPP and soil respiration (see below).
where
CSeq Net carbon sequestration in a grid cell in the period t0 through 2100 (Mg C ha-1)
t Year (between 2000 and 2100)
t0 Starting year of carbon plantations in a grid cell
NEPCP(t) Net Ecosystem Productivity of best growing tree species in a grid cell (Mg C ha-1 yr-1)
NEP(t) NEP of the original vegetation according to the baseline scenario (Mg C ha-1 yr-1)
AGF FNPPCP ts NPPIlct ts CF ts
ts = ⋅,
( ) 95 (2)
F AS LS AB LB AS LS AB LB FNPP
YLD WD CF LR
CP =⎛ − ⎝⎜ ⎞ ⎠⎟+ − − ⎛ ⎝⎜ ⎞ ⎠⎟ = ⋅ ⋅ ⋅
0 5. 2 2
L L HI F⋅⎛LRL−
⎝⎜ ⎞ ⎠⎟ Re cov 2 (3)
CSeq b E NEP t NEPCP t
E C content of natural vegetation before the conversion into a carbon plantation (Mg C ha-1)
b Burn factor of the initial harvest [either 0 or 1] (-)
The variables E and b account for carbon emissions related to the establishment of a carbon plantation. For plantations established on abandoned agricultural land, grassland or forest land just being logged, there is no clear-ing needed and 'b' is close to zero. When, however, an existing natural forest or woodland is converted into a car-bon plantation, the original vegetation is assumed to be burnt entirely (i.e. b = 1), resulting in instantaneous emis-sions of carbon into the atmosphere. These emisemis-sions must first be compensated before a plantation is effective in mitigating the CO2 build-up in the atmosphere.
Since management can have a considerable effect on the carbon uptake potential of plantations [53,54], we included two possible harvest regimes. Either plantations are harvested at regular intervals or no harvest takes place at all. In the latter case, a plantation will grow to a stable level of carbon storage and a low additional C sequestra-tion further in time in the soil. In the former case, a plan-tation is harvested at the moment of maximum C sequestration, (i.e. the NEP of a plantation averaged over the stand age starts to decrease), followed by re-growth. In our assessment the harvested wood from stems and branches is used to fulfill the wood demand. Leaves, roots and the non-harvested stems and branches enter the litter and humus carbon pools in the soil. The approach of dis-placing wood demand amounts to a displacement factor of 1 (assuming no leakage, i.e. no change in the wood sec-tor).
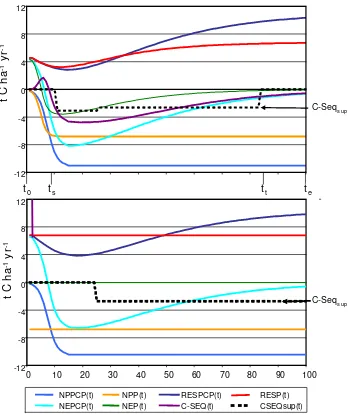
Figure 5 illustrates step 1, showing the C dynamics of a
Pinus radiata plantation on either abandoned agriculture or replacing a natural forest. In the case of establishing this plantation on abandoned agricultural land, the NPP of both the plantation and the natural forest – that would otherwise grow in the area – increases from zero up to the maximum value within the predefined recovery period. If responses to changing atmospheric CO2 levels and
cli-mate are excluded, the NPP values will remain constant at the maximum value. The soil respiration of both the plan-tation and natural forest first decline because the carbon input from young trees is limited, whereas the decompo-sition rate starts at the much higher equilibrium level with respect to the previous (in this case agricultural) vegeta-tion. After a period of decline, the respiration flux increases, since the soil carbon pools are filled up again. The respiration flux increases until it exceeds NPP. If the net carbon uptake of the carbon plantation [NEPCP(t)] is larger than the net uptake of the natural forest [NEP(t)] (i.e. more negative), the plantation is effective in slowing down the build-up of atmospheric CO2. This is illustrated by negative values of CSeq. Since it is unknown in advance
when a certain potential is actually used in a mitigation effort, we averaged the carbon sequestration over a prede-fined period of time expressed as CSeqsup. As such, the CSe-qsup over the time interval [ts, tt] is an approximation of the average net carbon sequestration over the time interval [t0,te].
In the case of the establishment of a C plantation on slash and burnt natural ecosystems (Figure 5), large quantities of carbon are emitted instantaneously (i.e. E will be large). Afterwards, CSeq(t) in year t equals NEPCP(t), assuming no CO2 fertilization and other climate feedbacks (as such, the NEP of the natural vegetation is about 0). However, the year that a plantation starts to actually sequester car-bon is postponed because the initial emissions have to be compensated (about 23 years for the example in Figure 5).
Step 2: The social sequestration potential
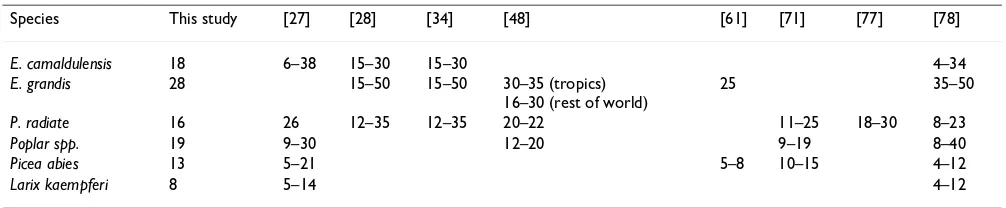
The social potential of the afforestation activities is esti-mated in two stages. Firstly, we establish plantations around the world using certain restrictions based on social acceptance. This is accomplished by using a particular def-inition of social importance: Considering only those areas that are neither needed for food and wood supply nor are covered by natural ecosystems (because of their impor-tance for nature conservation). Establishing plantations on abandoned agricultural land is the only possibility. This leads to uptake potentials per grid cell (geographical explicit). Secondly, supply curves have been constructed Table 7: Comparison of plantation growth rates around the world (m3 ha-1 yr-1).
Species This study [27] [28] [34] [48] [61] [71] [77] [78]
E. camaldulensis 18 6–38 15–30 15–30 4–34
E. grandis 28 15–50 15–50 30–35 (tropics)
16–30 (rest of world)
25 35–50
P. radiate 16 26 12–35 12–35 20–22 11–25 18–30 8–23
Poplar spp. 19 9–30 12–20 9–19 8–40
Picea abies 13 5–21 5–8 10–15 4–12
for each IMAGE-2 region, summing-up the gridded sequestration potentials for all grid cells within that region where the average carbon sequestration, corrected for climate change and CO2 fertilization effects, is positive
in a year 'z' (Figure 5, [19]). Since it is unknown when a certain potential is actually used in a mitigation effort, and to allow for comparison with other greenhouse gas mitigation options, the carbon sequestration is averaged over a predefined period of time (CSeqsup(t)). Thus each point in a supply curve represents the regional sum of the average annual carbon sequestration potential of a grid cell assigned to a time interval [ts, tt], starting with the
most productive grid cells (i.e. cells with highest seques-tration rate per hectare), ending with ineffective grid cells.
Step 3: The economic sequestration potential
The social C sequestration potential is used to determine the economic potential by linking it to costs (see [19] for details). This results in Marginal Abatement Curves (MACs) or cost-supply curves dependent on geographical-explicit environmental circumstances and possible future changes in land use. In general, the most important cost factor in producing or conserving carbon sinks is land [55]. In addition, we also consider establishment costs.
Illustrative growth curves of a Pinus radiata plantation
Figure 5
Illustrative growth curves of a Pinus radiata plantation: top – permanent plantation on abandoned agricultural land; bot-tom – permanent plantation on former forest area. Note that negative numbers represent a C uptake. Furthermore, the curves assume neither CO2 fertilization nor climate feedbacks.
NPPCP(t) NPP(t) RESPCP(t) RESP(t) NEPCP(t) NEP(t) C-SEQ(t) CSEQsup(t) -12
-8 -4 0 4 8 12
0 10 20 30 40 50 60 70 80 90 100
-12 -8 -4 0 4 8 12
t
C
ha
-1
yr
-1
C-Seqsup
t0 ts tt te
C-Seqsup
t C
h
a
-1
yr
Other types of costs are excluded because they are either low (e.g. maintenance costs), compensated by revenues from timber, or difficult to quantify [56]. Land costs are based on GTAP data [57] for land values of agricultural land around the world. Establishment costs, set at 435 US$ (1995) per ha, are uniform in time and space. This assumption is supported by the survey of Sathaye et al. [15]. The value of 435 US$ (1995) per ha is based on ana-lyzing variations between the regions and the ranges within the regions.
The IMAGE 2 model
The methodology presented has been implemented in IMAGE 2 (Integrated Model to Assess the Global Environ-ment [18,58,59]). This is a multi-disciplinary, integrated assessment model, designed to explore causes and effects of global environmental change. IMAGE 2 integrates dif-ferent land-use demands like food, fodder, biofuels and C sequestration. IMAGE 2 is global in application and inte-grates regional socio-economic (i.e. eighteen regions) and geographically explicit grid dimensions (i.e. 0.50
longi-tude by 0.50 latitude). Each grid cell is characterized by its
climate, soil and land cover (natural ecosystems or agri-culture). Because of the dynamic land use, the geographic explicit modeling and the global perspective, IMAGE 2 is very suitable for the presented methodology.
IMAGE 2 consists of various sub-models (Figure 6). Driv-ers of the model are regional trends in wealth, demogra-phy and technology for the period 1970 to 2100. These trends determine, for example, the demand for land resources. Changes in production of or demand for land-related products (i.e. food, fodder, biofuel, timber and C sequestration) drive land-use changes, leading to land-use emissions of various greenhouse gases into the atmos-phere. The IMAGE 2 atmospheric and ocean sub-model computes changes in atmospheric composition (e.g. CO2 and CH4) and, subsequently, the climate by using the land-use and energy-related emissions and by taking oce-anic and terrestrial CO2 uptake and atmospheric chemis-try into account. The climatic changes alter the distribution and productivity of ecosystems and agricul-ture, with both, in turn, affecting the terrestrial C dynam-ics.
Carbon plantations have been added as a separate land-cover class into the land-land-cover sub-model of IMAGE 2, whereas their carbon pools and fluxes are computed by the terrestrial C cycle sub-model [19,49,60]. The driving force of the C cycle sub-model is Net Primary Productivity (NPP), which is the photosynthetically fixed C in plants minus C losses due to plant respiration. NPP in IMAGE 2 is a function of atmospheric CO2 concentration, climate, soil nutrient and moisture status, biome type and the suc-cessional stage of a biome. NPP determines the Net
Eco-system Productivity (NEP) in an area, together with the heterotrophic soil respiration. NEP represents the net C flux between the atmosphere and terrestrial ecosystems. Soil respiration depends on the C stocks in the different soil compartments (i.e. litter, humus and charcoal), their turnover rates and environmental conditions (i.e. soil water availability and temperature). All fluxes are calcu-lated on a monthly basis, while the carbon pools are updated annually.
Model application and experimental design
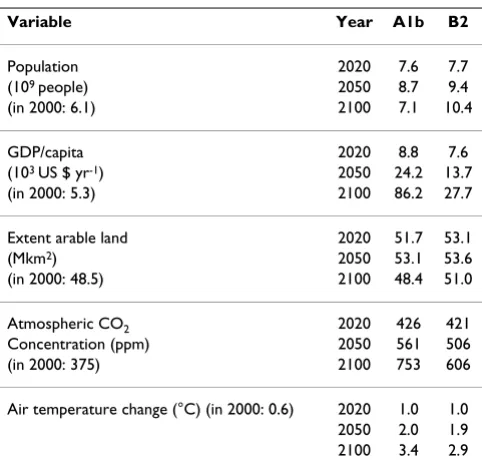
The IMAGE 2 model, along with the methodology pre-sented here, has been applied to a number of experiments to show different sequestration potentials of C planta-tions up to 2100 under different baseline scenarios and management options. The experiments form variants to the implementation of the IPCC SRES A1b and B2 base-line scenarios [20,59]. The two basebase-line scenarios differ considerably in socio-economic and population develop-ments (Table 8). In the B2 scenario, the demands up to 2050 for goods (e.g. food, timber and biofuels) are lower than in A1b baseline. But between 2050 and 2100, the demands remain high in B2, and drop in the A1b sce-nario. Combined with lower yield increases in the B2 world due to lower economic development and a frag-mented world (e.g. leading to less technology exchange), less agricultural land is projected as being available for C plantations in the B2 scenario than in the A1b scenario. The consequences for the atmospheric CO2 concentration and global climate in the two scenarios are given in Table 8. Regionally, large temperature changes (up to 6°C) are simulated for the high latitudes, the Amazonian region, southern Africa and India.
Structure of IMAGE 2
Figure 6
List of abbreviations
CO2: Carbon dioxide; Ha: Hectare; NPP: Net Primary Pro-duction; NEP: Net Ecosystem Productivity.
Competing interests
The authors declare that they have no competing interests.
Authors' contributions
The methodology and its applications were designed by JvM, who also prepared this manuscript. B.S. co-designed the methodology, implemented it in IMAGE 2 and con-tributed to the paper. BE concon-tributed to the different stages of the methodology and earlier versions of this paper. RS and RL contributed to all stages of the paper. All authors read and approved the final manuscript.
Table 8: Main global characteristics of the IPCC A1b and B2 baseline scenarios (derived from The IMAGE Team [59]).
Variable Year A1b B2
Population 2020 7.6 7.7
(109 people) 2050 8.7 9.4
(in 2000: 6.1) 2100 7.1 10.4
GDP/capita 2020 8.8 7.6
(103 US $ yr-1) 2050 24.2 13.7
(in 2000: 5.3) 2100 86.2 27.7
Extent arable land 2020 51.7 53.1
(Mkm2) 2050 53.1 53.6
(in 2000: 48.5) 2100 48.4 51.0
Atmospheric CO2 2020 426 421
Concentration (ppm) 2050 561 506
(in 2000: 375) 2100 753 606
Air temperature change (°C) (in 2000: 0.6) 2020 1.0 1.0
2050 2.0 1.9
2100 3.4 2.9
Table 9: Overview of simulation experiments for the IPCC A1b or B2 baseline scenarios
Plantation management IPCC A1b IPCC B2
Physical potential Permanent Experiment 1
Frequent harvest Experiment. 2 Experiment 3
Social potential Permanent Experiment 4
Acknowledgements
The research was made possible by internal funding from MNP and WUR.
We would like to thank Michiel Schaeffer for his contribution and discus-sion to the development the plantation scenarios based on the SRES sce-narios. We are also indebted to Ruth de Wijs for carefully checking and improving the English.
References
1. Schellnhuber HJ, Cramer W, Nakicenovic N, Wigley T, Yohe G, Eds: Avoiding Dangerous Climate Change. Cambridge, UK: Cam-bridge University Press; 2006:406.
2. Hegerl GC, Zwiers FW, Braconnot P, Gillett NP, Luo Y, Marengo J, Nicholls N, Penner JE, Stott PA: Understanding and Attributing Climate Change. In Climate Change 2007: The Physical Science Basis. Working Group 1 Contribution to the Fourth Assessment Report of the Intergovernmental Panell on Climate Change (IPCC)Volume Chapter 9. Edited by: Solomon S, Qin D, Manning M, Chen Z, Marquis M, Averyt K, Tignor MMB, Miller HL. Cambridge University Press, Cambridge, UK; 2007:663-746.
3. UNFCCC: The United Framework Convention on Climate Change. UN 1993.
4. Morita T, Robinson J, Adegbulugbe A, Alcamo J, Herbert D, La Rovere EL, Nakicenovic N, Pitcher H, Raskin P, Riahi K, et al.: Green-house Gas Emission Mitigation Scenarios and Implications. In Climate change 2001: Mitigation, Contribution of working group III to the Third Assessment Report of the Intergovernmental Panell on Climate Change (IPCC)Volume Chapter 3. Edited by: Metz B, Davidson O, Swart R, Pan J. Cambridge University Press, London, New York; 2001:115-166.
5. Leemans R, Eickhout B: Another reason for concern: regional and global impacts on ecosystems for different levels of cli-mate change. Global Environmental Change 2004, 14:219-228. 6. Noble IR, Scholes RJ: Sinks and the Kyoto Protocol. Climate Policy
2000, 1:5-25.
7. Bruinsma JE, Ed: Agriculture: Towards 2015/2030. A FAO Per-spective. London: Earthscan; 2003:432.
8. Hoogwijk M, Faaij A, Eickhout B, De Vries B, Turkenburg W: Poten-tial of biomass energy out to 2100 for four IPCC SRES land-use scenarios. Biomass & Bioenergy 2005, 29:225-257.
9. Reid WV, Mooney HA, Cropper A, Capistrano D, Carpenter SR, Chopra K, Dasgupta P, Dietz T, Duraiappah AK, Hassan R, Kasperson R, Leemans R, May RM, McMichael AJ, Pingali P, Samper C, Scholes R, Watson RT, Zakri AH, Shidong Z, Ash NJ, Bennett E, Kumar P, Lee MJ, Raudsepp-Hearne C, Simons H, Thonell J, Zurek MB: Millen-nium Ecosystem Assessment Synthesis Report. Island Press, Washington DC; 2005:219.
10. Watson RT, Noble IR, Bolin B, Ravindranth NH, Verado D, Dokken DJ, Eds: IPCC Special report on Land Use, Land-Use Change, and Forestry. Cambridge: Cambridge University Press; 2000:377. 11. Schneider U, McCarl B: Economic Potential of Biomass Based Fuels for Greenhouse Gas Emission Mitigation. Environmental & Resource Economics 2003, 24(4):291-312.
12. Sohngen B, Mendesohn R: An Optimal Control Model of Forest Carbon Sequestration. American Journal of Agricultural Economics
2003, 85:448-457.
13. Hamilton C, Vellen L: Land-use changes in Australia and the Kyoto protocol. Environmental, Science and Policy 1999, 2:135-144. 14. Nabuurs GJ, Dolman AJ, Verkaik E, Kuikman PJ, van Diepen CA,
Whitmore AP, Daamen WP, Oenema O, Kabat P, Mohren GMJ: Article 3.3 and 3.4 of the Kyoto Protocol: consequences for industrialised countries' commitment, the monitoring needs, and possible side effects. Environmental Science and Policy
2000, 3:123-134.
15. Sathaye JA, Markundi W, Andrasko K, Boer R, Ravindranath NH, Sudha P, Rao S, Lasco R, Pulhin F, Masera O, et al.: Carbon mitiga-tion potential and costs of forestry opmitiga-tions in Brazil, China, India, Indonesia, Mexico, the Philippines and Tanzania. Miti-gation and Adaptation Strategies for Global Change 2001, 6:185-211. 16. Sathaye JA, Markundi W, Dale L, Chan P, Andrasko K: GHG
Mitiga-tion Potential, Costs and Benefits in Global Forests: A Dynamic Partial Equilibrium Approach. Multi-Greenhouse
Gas Mitigation and Climate Policy Special Issue #3. Energy Journal 2006.
17. Sohngen B, Sedjo RJ: Carbon sequestration costs in global for-ests. Energy Journal 2006.
18. MNP: Integrated modelling of global environmental change. An overview of IMAGE 2.4. Bilthoven, the Netherlands: Nether-lands Environmental Assessment Agency (MNP); 2006:228. 19. Strengers B, van Minnen JG, Eickhout B: The costs and
uncertain-ties in establishing C plantations in order to mitigate climate change. Climatic Change 2008 in press.
20. Nakicenovic N, Alcamo J, Davis G, de Vries B, Fenhann J, Gaffin S, Gregory K, Grübler A, Jung TY, Kram T, Emilio la Rovere E, Michaelis L, Mori S, Morita T, Pepper W, Pitcher H, Price L, Riahi K, Roehrl A, Rogner H-H, Sankovski A, Schlesinger ME, Shukla PR, Smith S, Swart RJ, van Rooyen S, Victor N, Dadi Z, Eds: IPCC Special Report on Emissions Scenarios. Cambridge: Cambridge University Press London, New York; 2000:599.
21. Masera OR, Garza-Caligaris JF, Kanninen M, Karjalainen T, Liski J, Nabuurs GJ, Pussinen A, Jong BHJd, Mohren GMJ: Modeling carbon sequestration in afforestation, agroforestry and forest man-agement projects: the CO2FIX V.2 approach. Ecological Mod-elling 2003, 164:177-199.
22. Cannell MGR: Carbon sequestration and biomass energy off-set: Theoretical, potential and achievable capacities globally, in Europe and the UK. Biomass and Bioenergy 2003, 24:97-116. 23. Silver WL, Ostertag R, Lugo AE: The potential for carbon
sequestration though reforestation of abandoned tropical agricultural and pasture lands. Restoration Ecololgy 2000, 8:394-407.
24. Liski J, Karjalainen T, Pussinen A, Nabuurs GJ, Kauppi P: Trees as carbon sinks and sources in the European Union. Environmen-tal Science and Policy 2000, 3:91-97.
25. Marland G, Schlamadinger B: The Kyoto protocol could make a difference for the optimal forest based CO2 mitigation strat-egy: Some results for GORCAM. Environmental Science and Policy
1999, 2:111-124.
26. Kirschbaum MF: Can trees buy time? An assessment of the role of vegetation sinks as part of the global carbon cycle. Climatic Change 2003, 58:47-71.
27. Brown C: The global outlook for future wood supply from for-est plantations. Food and Agriculture Organization of the United Nations (FAO), Report GFPOS/WP/03, Rome; 2000:141.
28. FAO: Global forest resources assessment 2000. Food and Agri-culture Organization of the United Nations (FAO), Main Report 140
2001:479.
29. Houghton RA: Revised estimates of the annual flux of carbon to the atmosphere from changes in land use and land man-agement 1950–2000. Tellus B 2003, 55:378-390.
30. Ravindranath N, Somashekhar B: Potential and Economics of Forestry Options for Carbon Sequestration in India. Biomass and Bioenergy 1995, 8:323-336.
31. Sathaye JA, Andrasko K, Markundi W, Lebre La Rovere E, Ravin-dranath NH, Melli A, Rangaschari A, Imaz M, Gay C, Friedmann R, et al.: Concerns about climate change mitigation projects: Sum-mary of findings from case studies in Brazil, India, Mexico and South Africa. Environmental Science and Policy 1999, 2:187-198. 32. Metz B, Berk M, Kok M, Van Minnen JG, De Moor A, Faber A: How can the European Union contribute to a CoP-6 agreement? An overview for policy makers. International Environmental Agree-ment: Politics, Law and Economics 2001, 1:167-185.
33. Schlamadinger B, Marland G: The Kyoto Protocol: Provision and unresolved issues relevant to land-use change and forestry.
Environmental Science and Policy 1998, 1:313-327.
34. IPCC: Good Practice Guidance for Land Use, Land-Use Change and Forestry. Special report of the Intergovernmental Panell on Climate Change (IPCC), Cambridge University Press, Cam-bridge, UK:599.
35. Stinson G, Freenman B: Potential for carbon sequestration in Canadian forests and agroecosystems. Mitigation and Adaptation Strategies for Global Change 2001, 6:1-23.
36. Deckmyn G, Muys B, Garcia Quijano J, Ceulemans R: Carbon sequestration following afforestation of agricultural soils: comparing oak/beech forest to short-rotation poplar cop-pice combining a process and a carbon accounting model.