Open Access
Methodology
The effect of column purification on cDNA indirect labelling for
microarrays
M Lia Molas and John Z Kiss*
Address: Department of Botany, Miami University, Oxford, OH 45056, USA
Email: M Lia Molas - [email protected]; John Z Kiss* - [email protected] * Corresponding author
Abstract
Background: The success of the microarray reproducibility is dependent upon the performance of standardized procedures. Since the introduction of microarray technology for the analysis of global gene expression, reproducibility of results among different laboratories has been a major problem. Two of the main contributors to this variability are the use of different microarray platforms and different laboratory practices. In this paper, we address the latter question in terms of how variation in one of the steps of a labelling procedure affects the cDNA product prior to microarray hybridization.
Results: We used a standard procedure to label cDNA for microarray hybridization and employed different types of column chromatography for cDNA purification. After purifying labelled cDNA, we used the Agilent 2100 Bioanalyzer and agarose gel electrophoresis to assess the quality of the labelled cDNA before its hybridization onto a microarray platform. There were major differences in the cDNA profile (i.e. cDNA fragment lengths and abundance) as a result of using four different columns for purification. In addition, different columns have different efficiencies to remove rRNA contamination. This study indicates that the appropriate column to use in this type of protocol has to be experimentally determined. Finally, we present new evidence establishing the importance of testing the method of purification used during an indirect labelling procedure. Our results confirm the importance of assessing the quality of the sample in the labelling procedure prior to hybridization onto a microarray platform.
Conclusion: Standardization of column purification systems to be used in labelling procedures will improve the reproducibility of microarray results among different laboratories. In addition, implementation of a quality control check point of the labelled samples prior to microarray hybridization will prevent hybridizing a poor quality sample to expensive micorarrays.
Background
Microarray technology has become widely used to evalu-ate global gene expression. Despite the increasing reliance on this technology, the poor reproducibility of microarray data among laboratories and across platforms is still a major concern [1]. Currently, there are a variety of
plat-forms available, ranging from cDNA to oligonucleotide microarrays, to customized arrays, and to commercially developed microarrays. In addition, there is a large diver-sity in the procedures used by different laboratories for RNA manipulation and labelling as well as software used to analyze the output data. As a result of these
multifac-Published: 27 June 2007
Plant Methods 2007, 3:9 doi:10.1186/1746-4811-3-9
Received: 13 March 2007 Accepted: 27 June 2007
This article is available from: http://www.plantmethods.com/content/3/1/9
© 2007 Molas and Kiss; licensee BioMed Central Ltd.
eted approaches to assess gene expression, comparisons of the final results are complex and many times not repro-ducible [1].
A number of recent studies have addressed the complexity of microarray variability [2-8]. The use of different micro-array platforms and different practices in laboratories (i.e., lab-to-lab variability or "lab effect") emerges as a major source of variability. In this regard, preparation of samples and labelling procedures increase the technical variation and significantly affect the quality and reproducibility of the data [9,6]. For example, procedures such as RNA extraction have proven to significantly increase the techni-cal variability in microarray data [10]. Hence, standardiz-ing methodologies and establishstandardiz-ing quality control check points to ensure reproducibility are recognized as critical in microarray experiments. In an attempt to reach consen-sus on the generation, analysis and application of micro-aray data, the microarray quality control (MAQC) project evaluated the reproducibility in microarray results among platforms [7,8]. Comparison of quantitative gene expres-sion of two commercial human RNA samples was consid-erably consistent among platforms compared to reports in previous studies. These studies conclude that using com-mon tools for data analysis, applying quality control crite-ria, and standardizing the data report provide confidence in the consistency of gene expression data.
Microarray technology utilizes various procedures to label mRNA samples [11]. Indirect labelling protocols use amino-substituted nucleotides incorporated during a reverse transcription reaction into cDNA. A nucleotide analog carrying a chemically reactive amine group (i.e. amino-allyl substituted dUTP) is later conjugated to a flu-orescent dye [12]. The resulting primary amine group from the amino-allyl dUTP (aa dUTP) is conjugated to a succinimidyl ester cyanine (Cy) fluorescent molecule at the 5- or 3- (Cy3 and Cy5) carbon of the pyrimidine base. For the cDNA and oligonucleotide microarrays, Cy3 and Cy5 are commonly used fluorescent dyes that are exited by different wavelengths of light. As a result, they can be used in combination, one labelling a control or reference sample and the other labelling the treatment or test sam-ple. Gene expression can be measured by calculating the ratio of the two different cyanine dye fluorescence inten-sities detected after combining the two labeled cDNA samples and hybridizing to a microarray platform.
The quality of the initial RNA sample is the first step to ensure successful cDNA and cRNA synthesis before micro-array hybridization. One of the most effective tools for characterizing RNA integrity is capillary electrophoresis, in which RNA degradation is indicated by an altered 28S/ 18S ribosomal RNA (rRNA) signal ratio. Auer and colleges established a "degradation factor" utilizing data obtained
from a RNA assay of the Agilent Bioanalyzer as a more quantitative approach [13]. This approach calculates a ratio between the 18S ribosomal peak area and the aver-age of the peaks smaller than 18S that are indicative of degradation. The authors show that if we compared two samples, intact and degraded RNA, respectively, up to three quarters of differential gene expression measured was due solely to differences in RNA integrity between two samples [13].
The percentage of intact rRNA present in the original sam-ple has been suggested as an important criterion of a non-degraded RNA sample [14]. In the same way, the median size of the cDNA and cRNA synthesis products is a good indicator of the quality of the sample. cDNA and cRNA synthesis products with median sizes of 2.0 and 3.0 kb, respectively, were found suitable for microarray hybridi-zation [14].
This study shows one source of technical variability dur-ing sample preparation prior to microarray hybridization by analyzing a cDNA labelling procedure. Specifically, the aminoallyl indirect labelling protocol was evaluated by using four different ultrafiltration devices for purifying fluorescently labeled cDNA products. We found that dif-ferent systems of column purification used during the labelling procedure resulted in different cDNA popula-tions. In addition, contamination with rRNA is present in some cases. Consequently, assessing the quality of cDNA samples immediately prior to microarray hybridization is an important checkpoint that will help diminish technical variability.
Results
In the present study we analyzed the amino-allyl indirect labelling method to generate cDNA probes labeled with Cy5 (Figure 1). Using a standard procedure, we contrasted the performance of four different chromatographic col-umns for cDNA purification. In brief, we used AutoSeq G-5-columns (Amersham), Qiaquick PCR purification kit (Qiagen), Microcon YM-30 centrifugal filter (Millipore), and DNA Clean and Concentrator-5 (Zymo Research). We designate each column as column A, B, C and D, respec-tively. After labelling the sample, we analyzed the quality of the Cy5-labeled cDNA product by two electrophoretic methods, the Agilent 2100 Bioanalyzer and agarose gel electrophoresis.
identified with the Agilent Bioanalyzer (indicated in Fig-ure 2).
Results with column A show a smooth Cy5-cDNA profile, concentrated in the middle region and few individual peaks. Columns B and C present similar profiles in the electropherograms, both of these have more defined peaks with flat baselines and relatively flat valleys between the peaks (Figure 2B and 2C). Both columns B and C have significant contamination with rRNA. On the other hand, column D presents an evenly distributed pro-file, and the absence of individual peaks. Column D per-formed very well in terms of having little rRNA contamination and high cDNA yield.
To better characterize the performance of each purifica-tion device, the median size of the cDNA populapurifica-tion, the presence of rRNA in the sample, and the cDNA yield per column was measured (Table 1). The three parameters evaluated showed significant variability. Overall, columns with high yield present high rRNA content. cDNA median size differs among columns indicating that, even when they have a wide range for product size isolation, they act more efficiently in separating certain sizes of cDNA tran-scripts.
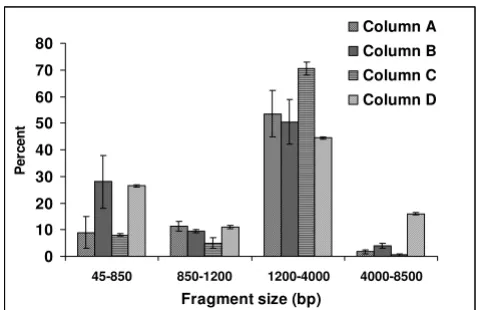
To examine the variability in the cDNA patterns, we divided the electropherograms into regions based on cDNA size (in bp). These regions were used to quantify the percentage of cDNA fragments (i.e., transcripts) present in each region. The amount of transcript present in each region was calculated by integrating the area under the curve in each region in relation to the total area. rRNA fragments were not included in this analysis since they have been quantified in Table 1. Figure 3 shows a compar-ison per region of the cDNA fragment length obtained from the columns evaluated. High variability in each region can be observed based on the type of column used.
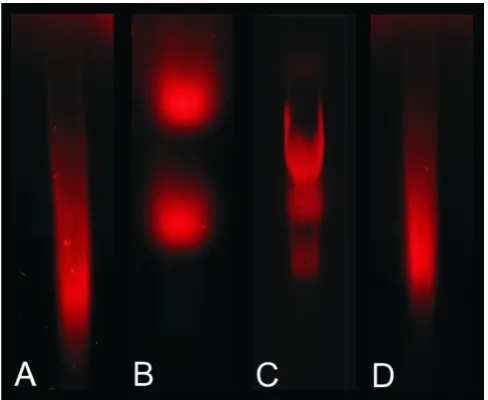
Labeled Cy5-cDNA analyzed by agarose gel electrophore-sis also showed different Cy5-cDNA populations visual-ized as different smear profiles on the gel (Figure 4). Evaluation of the Cy5 cDNA samples prior to microarray hybridization via gel electrophoresis does not provide information about rRNA contamination since its pres-ence, if any, is overlapped by Cy5-cDNA fragments migrating in the same region. Hence, discrimination between rRNA and cDNA is not possible using agarose gel electrophoresis.
Microarray analyses were performed employing labeled cDNA with the standard procedure using two columns of contrasting cDNA pattern (i.e. column B and D). The genes regulated at least 2-fold (log2 ratio of red/dark sig-nal > 1) showed similar percentage of the total number of genes in both experiments (13.9 % and 17.3 % as up-reg-ulated for column B and D respectively and 17.2 % and 19.1 % down-regulated in column B and D respectively). However, the number of genes detected for both column B and D overlap only 21 and 23 % for up- and down-reg-ulated genes respectively (Figure 5). These results indicate that both purification devices isolate cDNA suitable for hybridization but that this is not enough to reproduce the same microarray results.
Discussion
Different purification systems generate different Cy5 cDNA population
Cy5-cDNA samples purified with the four different meth-ods show cDNA electropherogram patterns that are
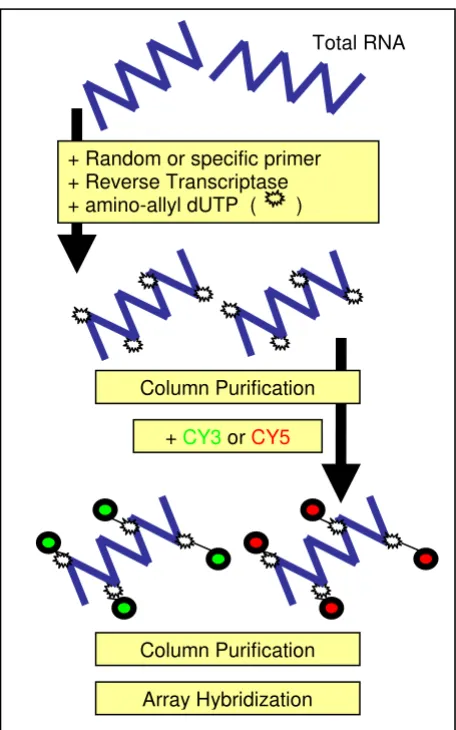
signif-Principle of cDNA indirect labelling method, starting form total RNA sample
Figure 1
Principle of cDNA indirect labelling method, starting form total RNA sample. Total RNA is labeled by reaction of Cy-dyes with amino-allyl dUTP incorporated during the first cDNA strand synthesis (cDNA indirect labeling). The same columns for cDNA purification were used before and after labeling.
Total RNA
+ Random or specific primer + Reverse Transcriptase + amino-allyl dUTP ( )
+ CY3 or CY5 Column Purification
Column Purification
icantly different (Figure 2 and 3). Analysis of the cDNA pattern shows that different cDNA fragment lengths and abundance are obtained based on the method used for Cy5 cDNA purification (Figure 2 and 3). In addition, the yield per column and the efficiency to remove rRNA from the cDNA sample is noticeably different among the col-umns (Table 1).
Different methods for Cy-cDNA purification generate dif-ferent cDNA populations and this discrepancy might be related to variables other than the purification method employed. For example, columns C and D both use silica-based matrices to isolate Cy-cDNA. In this case, cDNA binds to a matrix of silica in the presence of a high concen-tration of a chaotropic salt while other molecules are not retained. Even though columns C and D employ the same mechanism for cDNA isolation, they differ in the Cy-cDNA pattern obtained after purification, the Cy-cDNA median size, and on their effectiveness to eliminate rRNA (Table 1 and Figure 2).
On the other hand, columns A and B use particle size as the principle for isolation. Column A separates Cy-cDNA by a gel pore exclusion which retains the unincorporated Cy dye in the gel matrix and allows the larger Cy-cDNA fragments to flow through the column. In column B, how-ever, the cDNA molecules are retained on a cellulose membrane with pore size as the separating mechanism; the unincorporated dye-labeled nucleotides flow through the membrane while the larger Cy-labeled cDNA is retained. These two columns give different Cy-cDNA pro-files, indicating that the method employed for separation, even when they use the same principle, results in Cy-cDNA populations of different composition (i.e. fragment length and abundance) as observed in the electrophero-gram and gel images.
In light of these results, column performance does not seem to depend entirely on the principle of separation they use. Moreover, we can find some similarities between columns A and D in the cDNA profile, even though both
Chromatograms of micro-capillary electrophoresis from Cy5-cDNA samples
Figure 2
Chromatograms of micro-capillary electrophoresis from Cy5-cDNA samples. Chromatograms show different pro-file after using different purification methods (as indicated in the method section) in an indirect labelling protocol. rRNA con-tamination is marked by arrows. Above each graph nucleotide size is indicated (nt). Profiles of one representative experiment are shown. Experiments were replicated a minimum of three times.
0 1 2 3 4 5 6 7 8 9 10
15 25 35 45 55 65 75 85
Time (seconds) Fl uo re sc e n t uni ts
D
25 200 1000 4000 nt
0 1 2 3 4 5 6 7 8 9 10
15 25 35 45 55 65 75 85
Time (seconds) Fl uor e sc e n t un it s
A
rRNA
25 200 1000 4000 nt
0 1 2 3 4 5 6 7 8 9 10
15 25 35 45 55 65 75 85
Time (seconds) F lu o resce n cet u n its
C
rRNA
25 200 1000 4000 nt
0 1 2 3 4 5 6 7 8 9 10
15 25 35 45 55 65 75 85
F lu o resce n t u n it s
B
rRNA
25 200 1000 4000 nt
columns are based on different principles of separation. Hence, aspects other than the methods of purification itself are affecting the final results in each case. Variables related to the optimization of the column should be con-sidered in order to identify the best performing column in each particular procedure.
Microarray analysis performed with columns B and D showed that both devices were able to produce adequate cDNA sample to perform hybridization and an acceptable number of genes [15,16] were detected as up- and down-regulated more than 2-fold. However, a comparison of the genes detected as regulated more than 2-fold in both of the columns tested, overlap on average of 22 % (Figure 5). These results clearly show that the column used for cDNA purification in the labelling process ultimately affect the results in microarray experiments.
Detection of rRNA in cDNA sample
Three of four column methods evaluated in this study showed considerable amount of rRNA (Figure 2, Table 1). rRNA will contribute to absorbance readings at 260 nm
(A260) used to calculate mRNA and/or cDNA quantity. Consequently, when using A260 values to calculate mRNA and/or cDNA quantity, the presence of rRNA in the sample may provide inaccurate results.
In this study, we used oligo dT primers to synthesize cDNA from total RNA during reverse transcription, and for this reason we did not expect to have cDNA made from rRNA. However, many protocols for both indirect and direct labelling use random primers. When random prim-ers are used, at least some rRNA may be transcribed, pro-ducing Cy-labeled cDNA, and this cDNA from rRNA may hybridize to complementary sequences in the array. If this were the case, erroneous differential expression data would potentially be obtained, leading to incorrect inter-pretation of the microarray results.
rRNA and low molecular weight RNA frequently contam-inates mRNA preparations [11]. During the process of purification, small rRNA is non-specifically bound to the column matrix and, additionally, some rRNA's are bound to and co-purify with the mRNA [17]. Considering that rRNA constitutes more than 80% of the total RNA, it is dif-ficult to obtain its complete degradation. Alkaline hydrol-ysis, the method used in this protocol to degrade rRNA, incorporates a molecule of water into the phosphodiester bonds constituting both RNA and DNA primary structure. These ester bonds are hydrolyzed; this process rapidly destroys RNA and more slowly destroys DNA. In the par-ticular case of this study, a "compromise situation" is tak-ing place in that rRNA has to be broken down to small fragments, but the cDNA present in the sample has to be preserved from hydrolysis. This delicate balance is con-trolled by the time of exposure to high pH at elevated tem-perature. It is plausible then, that we may have an incomplete digestion of the rRNA. This would render large fragments of rRNA instead of small size fragments (ideally a few nucleotides length) thus making it more dif-ficult to separate from cDNA fragments.
While information about rRNA contamination can be obtained from the Agilent Bioanalyzer electrophero-grams, no data addressing rRNA contamination can be obtained by gel electrophoresis. Since rRNA and cDNA overlap in length and migrate in the same region of the Table 1: cDNA yield (ng), presence of rRNA (%) and cDNa median size (nt) of labeled cDNA using four different columns for cDNA purification
Yield (total ng) rRNA (%) cDNA median size (nt)
Column A 399 ± 19.9 42.2 ± 11.5 2075 ± 37.4
Column B 696 ± 93 61 ± 1.04 1483 ± 132.1
Column C 292.8 ± 43 60.6 ± 1.71 1241 ± 394.9
Column D 184 ± 9.2 2.9 ± 1.19 3017 ± 74.5
Comparison of Cy5-cDNA profile by regions using four chromatographic methods for Cy5-cDNA purification
Figure 3
Comparison of Cy5-cDNA profile by regions using four chromatographic methods for Cy5-cDNA purifi-cation. Each region is quantified as area under the curve and expressed as a percentage. rRNA is not included in this anal-ysis. Each value represents the mean and SE of three biologi-cal replicates.
0 10 20 30 40 50 60 70 80
45-850 850-1200 1200-4000 4000-8500
Fragment size (bp)
Per
c
en
t
Column A
gel, rRNA would be masked by the Cy-cDNA labeled frag-ments. This fact makes agarose gels of limited use in terms of detection of such contamination.
Conclusion
This study shows that different methods for Cy-cDNA purification generate different cDNA populations for hybridization of microarray platforms. Discrepancies in column performance may be related to variables other than the purification method itself. Results from microar-ray experiments confirm that the use of different columns for purification in an indirect labelling protocol may pro-duce different gene expression data. Hence, the purifica-tion method of choice used in cDNA labelling procedures prior to microarray hybridization is an important param-eter to consider.
Methods
RNA preparationTotal RNA was extracted from leaves of light grown 10 day old plants of Arabidopsis thaliana (ecotype Landsberg erecta) using the RNeasy® Mini Kit (Qiagen, Valencia, CA,
USA). Residual DNA was removed by performing an on-column digestion using a DNA-free TM kit (Ambion, Aus-tin, TX, USA) according to manufacturer's instructions. RNA concentration and purity were estimated with the NanoDrop ND-1000 spectrophotometer (NanoDrop, Wilmington, DE, USA) and quality further assessed with the Agilent 2100 Bioanalyzer (Agilent, Santa Clara, CA, USA). One single total RNA extraction per biological
rep-licate was performed and subsequent used for labelling reaction. A single pool of total RNA was reverse tran-scribed and divided into four aliquots for purification and labelling. Three independent biological replicates were performed using leaves from 10-day-old plants.
Indirect Cy5 incorporation
Total RNA from one single extraction was reverse tran-scribed and separated in four equal aliquots. Each aliquot (containing 10 μg of total RNA) was labelled according to the TIGR protocol [18] with modifications (schematic protocol in Figure 1). Briefly, we used SuperScript II reverse transcriptase (Invitrogen, Carlsbad, CA, USA) and
Number of genes defined as responding to 1 h of red light in 7 day old Arabidopsis seedlings using two column purification devices
Figure 5
Number of genes defined as responding to 1 h of red light in 7 day old Arabidopsis seedlings using two col-umn purification devices. Venn diagrams show the number of genes up- and down-regulated > 2-fold by red light of as detected by column B (left) and column D (right). Number of genes detected per column and overlapping between columns is expressed as percentage (%) of the com-bined gene list of up- and down-regulated respectively. Results form one independent slide is shown.
Column B Column D Induced
2415 genes
32.4 %1569
genes
21 %
3465 genes
46.5 %Repressed
2904 genes 36.8 %
2085 genes
23.2%
3963 genes 45 %
Column B Column D
Conventional analysis of Cy5-cDNA separated based on size using a 1 % (w/w) TEA agarose gel
Figure 4
oligo dT primer to synthesize the first-strand cDNA. A chemically reactive nucleotide analog (amino allyl-dUTP) was incorporated into cDNA. After reverse transcription, the mRNA template was hydrolyzed by alkaline hydroly-sis and the cDNA purified to remove free nucleotides and oligomers. In this first purification step we employed four different chromatographic methods: A) CyScribe GFX™ PCR DNA (Amersham, Piscataway, NJ, USA), B) Qiaquick PCR purification kit (Qiagen, Valencia, CA, USA), C) Microcon YM-30 centrifugal filter (Millipore, Billerica, MA), and D) DNA Clean & Concentrator-5 (Zymo Research, Ontario, Canada). The purified cDNA was then post labeled with the reactive form of Cy5-NHS ester, which bonded to the modified nucleotide amino allyl-dUTP. The reaction was quenched with 4.5 μl of 4 M hydroxylamine for 15 min at room temperature. A final step of purification was then performed resulting in puri-fied CyDye-labeled cDNA, which was ready for hybridiza-tion. The same columns for purification were used in the first and second purification steps (see Figure 1). Purifica-tions were performed in parallel for the four columns. cDNA from the first purification was dried and stored at -20 C to the next day, when the second purification was performed.
Cy5 detection by the Agilent 2100 Bioanalyzer
One μl of each Cy5 labeled cDNA sample was loaded onto an Agilent RNA 6000 Nano LabChip (RNA LabChip, Agi-lent Technology, Santa Clara, CA) and assessed with mRNA Nano Assay. cDNA fragment size, rRNA contami-nation, and overall amount of fluorescence were evalu-ated. The detected fluorescence is the addition of the intercalating dye (provided in the Agilent RNA Nano Assay) and Cyanine 5 incorporated into the labeled cDNA. The Smear Analysis tool of the Agilent Bioanalyzer software was used to quantify the percentage of cDNA transcripts present in each region.
For the rRNA samples, the Cy3 was prepared for the hybridizations. We observed a lack of significant contribu-tion to the overall fluorescence on the Bioanalyzer by Cy3-labeled samples (data not shown). Cy3 does not flu-oresce in the range of the Bioanalyzer laser, and any con-tribution to the outcome of the test would be minimal and consistent across all samples.
Gel electrophoresis
Five μl of each Cy5 labeled cDNA and 5 μl 30 % (v/v) glyc-erol was loaded onto a 1% (w/v) TAE agarose gel. Loading dye was run in an independent lane to prevent interfer-ence when Cy5 labeled cDNA is measured. The electro-phoretic runs were performed at 90 V for 45 min. Red fluorescence (650 nm) of Cy5 was detected using the Axon GenePix 4000b scanner with Gene Pix Pro 6.0 soft-ware (Molecular Devices, Sunnyvale, CA, USA)
Microarray analyses
60 μg of total RNA from 7 day old dark-grown seedlings exposed to one our red light (i.e. control dark vs. 1 h. red light experimental) were reverse transcribed and labeled as indicated in previous section. Column B and D were used for cDNA purification in two separate experiments conducted in parallel (i.e. total RNA extraction, cDNA labelling, and hybridization of samples were performed at the same time using the same conditions). In the figure 5, microarray hybridization of one biological replicate was performed.
Fluorescently labeled cDNAs were mixed with hybridiza-tion soluhybridiza-tion (SliderHyb Survey, Ambion) and hybridized to the microarray slide overnight in a 55°C water bath. Samples were hybridized in separate long oligonucleotide microarray slides (University of Arizona) containing 29,000 oligonucleotide array elements. A complete listing of the genes on this chip is available on reference 19. cDNA microarray slides were prepared according to the manufacturer's instructions [20].
The cDNA microarray slides were scanned with a GenePix 4000b scanner using laser excitation at 635 and 532 nm at 100% PMT sensitivity. Spot intensities were quantified using Axon GenePix Pro 6.0 image analysis software. The net intensities for each channel and channel ratios were measured using this software with the ratio method (median intensity). Then, normalization based on median of intensities was performed in the two experi-ments.
Abbreviations
amino-allyl dUTP (aa-dUTP)
cyanine 5 or 3 (Cy5 and Cy3)
complementary DNA (cDNA)
ribosomal RNA (rRNA).
Competing interests
The author(s) declare that they have no competing inter-ests.
Authors' contributions
MLM performed the experiments and drafted the manu-script. JZK supervised the study and participated in writing the manuscript. Both authors read and approved the final manuscript.
Acknowledgements
Publish with BioMed Central and every scientist can read your work free of charge
"BioMed Central will be the most significant development for disseminating the results of biomedical researc h in our lifetime."
Sir Paul Nurse, Cancer Research UK
Your research papers will be:
available free of charge to the entire biomedical community
peer reviewed and published immediately upon acceptance
cited in PubMed and archived on PubMed Central
yours — you keep the copyright
Submit your manuscript here:
http://www.biomedcentral.com/info/publishing_adv.asp
BioMedcentral
References
1. Sherlock G: Of fish and chips. Nature Methods 2005, 2:39-330. 2. Yauk CL, Berndt ML, Williams A, Douglas GR: Comprehensive
comparison of six microarray technologies. Nucleic Acids Research 2004, 32:1-7.
3. Bammler T, Beyer RP, Bhattacharya S, Boorman GA, Boyles A, Brad-ford BU, Bumgarner RE, Bushel PR, Chaturvedi K, Choi D, Cunning-ham ML, Dengs S, Dressman HK, Fannin RD, Farun FM, Freedman JH, Fry RC, Harper A, Humble MC, Hurban P, Kavanagh TJ, Kaufmann WK, Kerr KF, Jing L, Lapidus JA, Lasarev MR, Li J, Li YJ, Lobenhofer EK, Lu X, et al.: Standardizing global gene expression analysis between laboratories and across platforms. Nature Methods
2005, 2:351-356.
4. Larkin JE, Frank BC, Gavras H, Sultana R, Quackenbush J: Independ-ence and reproducibility across microarray platforms. Nature Methods 2005, 2:337-343.
5. Irizarry RA, Warren D, Spencer F, Kim IF, Biswal S, Frank BC, Gabri-elson E, Garcia JGN, Geoghegan J, Germino G, Griffin C, Hilmer SC, Hoffman E, Jedlicka AE, Kawasaki E, Martinez-Murillo F, Morsberger L, Lee H, Petersen D, Quackenbush J, Scott A, Wilson M, Yang YQ, Ye SQ, Yu W: Multiple-laboratory comparison of microarray platforms. Nature Methods 2005, 2:345-349.
6. Ma CQ, Lyons-Weiler M, Liang W, LaFramboise W, Gilberstson JR, Beich MJ, Monzon F: In vitro transcription amplification and labeling methods contribute to the variability of genes expression profiling with DNA microarrays. Journal of Moleclar Diagnostics 2006, 8(2):183-192.
7. Shi LM, Reid LH, Jones WD, Shippy R, Warrington JA, Baker SC, Col-lins PJ, de Longueville F, Kawasaki ES, Lee KY, Luo YL, Sun YMA, Wil-ley JC, Setterquist RA, Fischer GM, Tong WD, Dragan YP, Dix DJ, Frueh FW, Goodsaid FM, Herman D, Jensen RV, Johnson CD, Loben-hofer EK, Puri RK, Scherf U, Thierry-Mieg J, Wang C, Wilson M, Wol-ber PK, et al.: The microarray quality control (MAQC) project shows inter- and intraplatform reproducibility of gene expression measurements. Nature Biotechnology 2006,
24:1151-1160.
8. Canales RD, Luo YL, Willey JC, Austermiller B, Barbacioru CC, Boysen C, Hunkapiller K, Jensen RV, Knight CR, Lee KY, Ma YQ, Maqsodi B, Papallo A, Peters EH, Poulter K, Ruppel PL, Samaha RR, Shi LM, Yang W, Zhang L, Goodsaid FM: Evaluation of DNA microarray results with quantitative gene expression plat-forms. Nature Biotechnology 2006, 24:1115-1122.
9. Zakharkin SO, Kim K, Metha T, Chen L, Barnes S, Scheirer KE, Parrish R, Allison DB, Page GP: Sources of variation in Affymetrix microarray experiments. BMC Bioinformatics 2005, 6:214-225. 10. Coombes KR, Highsmith WE, Krogman TA, Bagglery KA, Stivers DN,
Abruzzo LV: Identifying and quantifying sources of variation in microarray data using high-density cDNA membrane arrays.
Journal of Computational Biology 2002, 9:655-69.
11. Botwell D, Sambrook J: DNA microarrays: a molecular cloning manual.Ed. Cold Spring Harbor, NY; 2003:178-193.
12. Randolph JB, Waggoner AS: Stability, specificity and fluores-cence brightness of multiply-labeled fluorescent DNA probes. Nucleic Acids Research 1997, 25:2923-2929.
13. Auer H, Lyianarachchi , Newsom D, Klisovic MI, Marcucci U, Kor-nacker K: Chipping away at the chip bias: RNA degradation in microarray analysis. Nature Genetics 2003, 35:292-293. 14. Dumur C, Nasim S, Best AM, Archer KJ, Ladd AC, Mas VR, Wilkinson
DS, Garret CT, Ferreira-Gonzalez A: Evaluation of quality-con-trol criteria for microarray gene expression analysis. Clinical Chemistry 2004, 50:1994-2002.
15. Ma LG, Li JM, Qu LJ, Hager J, Chen ZL, Zhao HY, Deng XW: Light control of Arabidopsis development entails coordinated reg-ulation of genome expression and cellular pathways. Plant Cell
2001, 13:2589-2607.
16. Ma LG, Sun N, Liu XG, Jiao YL, Zhao HY, Deng XW: Organ-specific expression of Arabidopsis genome during development.
Plant Physiology 2005, 138:80-91.
17. Ambion: mRNA Isolation: Isolate more mRNA, less rRNA.
Ambion Technical Notes9:2.
18. The Institute for Genomics Research: Aminoallyl labelling of RNA for microarrays [http://pga.tigr.org/sop/M004_1a.pdf] 19. Arabidopsis Oligonucleotide Microarrays, Version 3.0 [http:/
/ag.arizona.edu/microarray/deconvolutionver3.0.html]