Available Online at www.ijpret.com 193
INTERNATIONAL JOURNAL OF PURE AND
APPLIED RESEARCH IN ENGINEERING AND
TECHNOLOGY
A PATH FOR HORIZING YOUR INNOVATIVE WORK
IMAGE SEGMENTATION TECHNIQUES
MISS. K. M. PIMPLE
Assistant professor, Department of Electronics & Telecommunication Engg. Dr. Rajendra Gode Institute of Technology & Research, Amravati.
Accepted Date: 15/03/2016; Published Date: 01/05/2016
\
Abstract: In the present day world computer vision has become an interdisciplinary field and its applications can be found in any area be it medical , remote sensing ,electronics and so on .Term segmentation is splitting the whole image into segments. Segmentation process helps to find region of interest in a particular image. This paper study and evaluate the different methods for segmentation techniques.
Keywords: Thresholding, Histogram, Clustering, Matching
Corresponding Author: MISS. K. M. PIMPLE
Access Online On:
www.ijpret.com
How to Cite This Article:
Available Online at www.ijpret.com 194 INTRODUCTION
A great variety of segmentation methods has been proposed.
• Threshold based segmentation.
• Edge based segmentation..
• Region based segmentation.
• Clustering techniques.
• Matching.
I. Threshold based segmentation
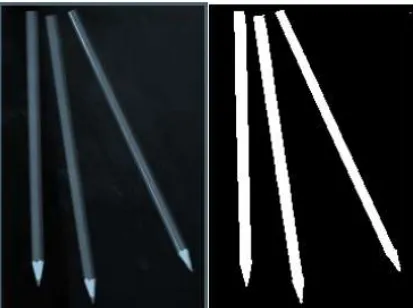
Thresholding is probably the most frequently used technique to segment an image. The thresholding operation is a grey value remapping operation g defined by:
g(v) =0 if v < t
=1 if v ≥ t,
where v represents a grey value, and t is the threshold value. Thresholding maps a grey-valued image to a binary image. After the thresholding operation, the image has been segmented into two segments, identified by the pixel values 0 and 1 respectively.
Available Online at www.ijpret.com 195 Many methods exist to find a suitable threshold for segmentation
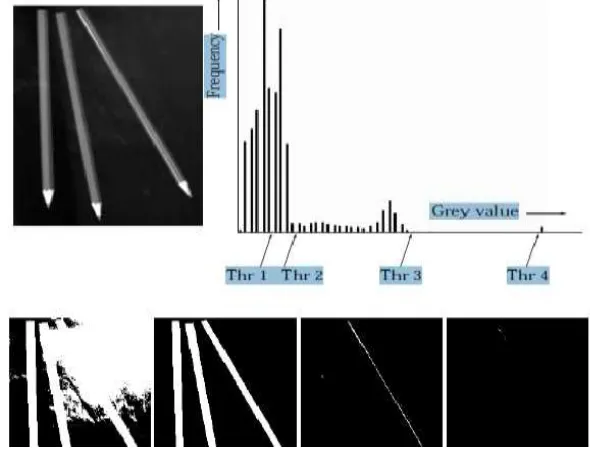
Histogram thresholding: The histogram is often a valuable tool in establishing a suitable threshold T
In figure 2 we show the image from the previous figure together with its histogram, and the thresholding results using four different threshold values obtained from the histogram
Fig 2 threshold selection from the histogram.
Multispectral thresholding
A color image will usually have three values (e.g., RGB values) attached to each pixel. In multispectral thresholding separate thresholding applied to each channel, and the results are combined using a boolean combination. A color image has three channels associated with it.
Fig.3 is a grey valued representation of a color image of a baboon, and the red, green and blue channel of the same color image:
Available Online at www.ijpret.com 196 II. Edge based segmentation:
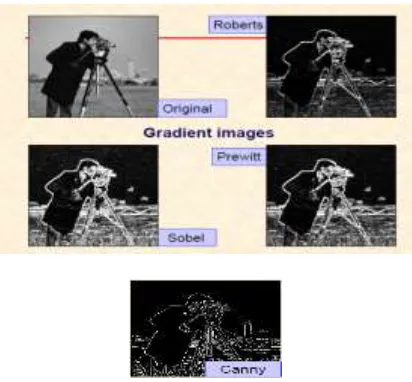
Edge detection detects outlines of an object and boundaries between objects and the background in the image
The gradient of an image f(x,y) at location (x,y) is the Vector
The gradient vector points in the direction of maximum rate of change of f at (x,y). In edge detection, an important quantity is the magnitude of this vector:
The gradient takes it’s maximum rate of increase of f(x,y) per unit distance in the direction of
.The gradient magnitude is commonly approximated by
This is simpler to implement. The direction of the gradient vector is also important and is given by:
Edge Detection Techniques:
A.Sobel Operators- Sobel Operators represented by the mask:
Available Online at www.ijpret.com 197 C. Prewitt Operator- Prewitt Operators represented by the mask:
D. Canny edge detector technique :
The algorithmic steps of Canny edge detector technique are
1. Convolve image f(r, c) with a Gaussian function to get smooth image f^ (r, c). f^ (r, c)=f(r,c)*G(r,c,6)
2. Apply first difference gradient operator to compute edge strength then edge magnitude and direction are obtain as before.
3. Apply non-maximal or critical suppression to the gradient magnitude.
4. Apply threshold to the non-maximal suppression image.
This is simpler to implement. The direction of the gradient vector is also important and is given by:
Available Online at www.ijpret.com 198 III. Region based segmentation: Region based segmentation is simple as compare to other methods and also noise resilient. It divides an image into different regions based on pre-defined criteria, i.e., color, intensity, or object. In this technique pixels that are related to an object are grouped for segmentation .The thresholding technique is bound with region based segmentation. The area that is detected for segmentation should be closed. Region based segmentation is also termed as “Similarity Based Segmentation”. In each and every step at least one pixel is related to the region and is taken into consideration. After identifying the change in the color and texture, the edge flow is converted into a vector. From this the edges are detected for further segmentation
IV. Clustering:
Segmentation is also done through Clustering. A basic clustering algorithm i.e., K-means is used for segmentation in textured images. It clusters the related pixels to segment the image Segmentation is done through feature clustering and there it will be changed according to the color components. Segmentation is also purely depending on the characteristics of the image. Features are taken into account for segmentation. Difference in the intensity and color values are used for segmentation .Segmentation approach for region growing is K-Means Clustering.
Algorithm: K-Means Clustering-This algorithm minimizes the total distance of data points to the cluster center of the cluster they are assigned to. Note that it does not require the actual computation of distances.
1. Select the number of desired clusters k. Arbitrarily (or better: intelligently) place the k cluster centers at different initial locations in the image.
2. Assign each data point to the cluster whose center is closest.
3. Recompute the cluster centers; the cluster center should be at the average coordinates (center of gravity) of the data points that make up the cluster.
4. Go to step 2 until no more changes occur or a maximum number of iterations is reached.
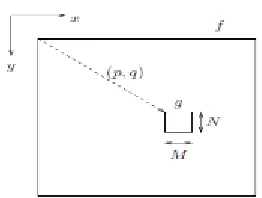
Available Online at www.ijpret.com 199 quantitative measure of fit such aswhere f is the image, g the M × N template, and the variables p and q determine the location of the template in the image, see figure
Fig 5 Definition of image matching
Figure 6 Image matching.
This is achieved by matching of the template to various locations in the right image.
CONCLUSION
Available Online at www.ijpret.com 200 REFERENCES:
1. G. Seerha, “Review on recent image segmentation techniques,” International Journal on Computer Science and Engineering, 2009.
2. J. Acharya, S. Gadhiya, and K. Raviya, “Segmentation techniques for image analysis: A review,” International Journal of Computer Science and Management Research, vol. 2, pp. 2278-733, 2013
3. S. S. Varshney, N. Rajpal, and R. Purwar, “Comparative study of image segmentation techniques and object matching using segmentation,” in Proc. International Conference on Methods and Models in Computer Science, 2009, pp. 1-6.
4. N. Senthilkumaran, R. Rajesh, "Edge Detection Techniques for Image Segmentation and A Survey of Soft Computing Approaches", International Journal of Recent Trends in Engineering, Vol. 1, No. 2, PP.250-254, May 2009.
5. N. Senthilkumaran, R. Rajesh, “Edge Detection Techniques for Image Segmentation - A Survey”, Proceedings of the International Conference on Managing Next Generation Software Applications (MNGSA-08), 2008,