-
Available Online at www.ijpret.com
500
INTERNATIONAL JOURNAL OF PURE AND
APPLIED RESEARCH IN ENGINEERING AND
TECHNOLOGY
A PATH FOR HORIZING YOUR INNOVATIVE WORKREVIEW ON ENERGY EFFICIANT SYSYEM USING IMAGE PROCESSING.
PROF. PRATIK G TALEY1, Dr GAJANAN P.DHOK2
1. M. E. Student, Electronics & Telecommunication Dept., Sipna COET, Amravati, MH, India. 2. Professor and Head Instrumentation Engineering Dept., Sipna COET, Amravati, MH, India.
Accepted Date: 27/02/2014 ; Published Date: 01/05/2014
p
\
Abstract:Identifying moving objects from a video sequence is a fundamental and critical task
in many computer vision applications. After the images are captured they must be processed and then sent to the server. In this paper we characterize the energy consumption of a visual sensor network testbed. Each node in the testbed consists of a “single-board computer”, equipped with a network card and a webcam. We assess the energy consumption of activities representative of the target application (e.g., perimeter surveillance) using a benchmark that runs (individual and combinations of) “basic” tasks such as processing, image acquisition, and communication over the network. In our characterization, we consider the various hardware states that the system switches through as it executes these benchmarks, e.g., different radio modes (sleep, idle, transmission, reception), and webcam modes (off, on, and acquiring image) using Matlab Sensor Node and Lifetime simulator. We report the energy utilized by each frame during transmission at the server. Here we can analyze the energy consumed with processing and without processing of video frames.
Keywords: Surveillance, Motion Detection, Energy Consumption, Reconstruction
Corresponding Author: PROF. PRATIK G TALEY
Access Online On:
www.ijpret.com
How to Cite This Article:
-
Available Online at www.ijpret.com
501
INTRODUCTION
Visual sensor networks are networks of wireless camera-nodes, where the camera-node consists of the image circuitry, a processor, and a wireless transceiver. The network generally consists of the cameras themselves, which have some local image processing, communication and storage capabilities, and possibly one or more central computers, where image data from multiple cameras is further processed and fused (this processing may, [1],[2] however, simply take place in a distributed fashion across the cameras and their local controllers). Visual sensor networks also provide some high-level services to the user so that the large amount of data can be distilled into information of interest using specific queries. Visual sensor networks suitable for use in applications where temporary monitoring is needed and in applications that require fast deployment and removal of the camera network. Cameras are directional in their field of view and they capture a large amount of visual information which may be partially processed independently of data from other cameras in the network. There are different features of visual sensor network such as energy limitations, data processing, resistance to node failure, scalability, heterogeneity, Quality of Service (QoS), flexible architecture to support heterogeneous applications, multimedia coverage out of which, we consider only two issues in this paper i.e. data processing and energy consumption.
Data processing: Data collected by the sensor nodes that lie in proximity to each other may contain a high level of spatial and temporal redundancy [3]. Local data processing (through data aggregation or data fusion) reduces the amount of data that need to be transmitted back to the data sink, thereby providing the application with high-level data representations that qualitatively satisfy the application's requirements. Using a background subtraction technique we can reduce the size of the image and the energy required to transmit each pixel.
Energy Consumption: In the absence of promising energy-scavenging technologies that would provide constant energy supplies for the sensor nodes, batteries are the most commonly used sources of energy [4]. Energy is thus a scarce resource, and it presents a basic limiting factor for the node's lifetime. Thus, intelligent polices for the efficient utilization of the energy resources are needed. In this paper, we have considered the energy consumed during subtraction, transmission and reconstruction.
-
Available Online at www.ijpret.com
502
Functional Block Diagram
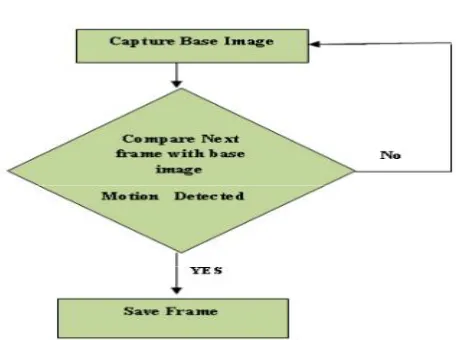
Figure.1 shows the functional block diagram for implementing the visual sensor network in surveillance system. We assumed that there is a visual camera which continuously monitors the area. When any object comes in the area of interest then it collects the visual data and forwards it to the server. The person sitting at the server will be in a position to monitor the remote place.
Consider a simple scenario where, camera C1 is captures images and sent to a server S for analysis. The paths are represented with an arrow in Figure 1. The motion is detected using background subtraction with some threshold value. If the subtraction is greater than threshold then motion is detected. The frames are subtracted and then sent to the server. The energy required during subtraction and transmission is calculated. The images are transmitted using TCP/IP protocol. The images are reconstructed at the server side and the energy consumed during reconstruction is also calculated.
3.2 Motion
-
Available Online at www.ijpret.com
503
The method of moving object detection is based on background subtraction for real time moving objects. The moving regions are detected by subtracting the current image pixel by pixel from a reference background image. If the pixel difference is above the threshold then it is classified a Foreground otherwise it is background. Suppose if there is a change in the image then the image is sent to the server. The most commonly used approach for foreground detection is to check whether the input pixel is significantly different from the corresponding [4] background estimation |It(x, y) - Bt(x,y)| > T threshold. The absolute differences between the foreground and background image are considered. To find the overlapping of image, we consider the difference between the foreground as well as the background image. There are two methods to find the overlapping of image - static and dynamic. In static, we compare the background with all the other frames. In dynamic we compare the consecutive frames. To calculate the overlapping of image, initially we have to consider that both images are of the same size. i.e.320*240, i.e. rows=320, columns=240. Then subtract the two images using absolute difference. If the difference is less then threshold then increment the sum. After calculating the sum the overlapped image is calculated using the formula: Overlapped image =sum/ (320*240)*100.
Reconstruction of Image
Optimal extraction of the underlying quantities from measured data requires the removal of measurement defects such as noise and limited instrumental resolution. When the underlying quantity is an image, this process is known as image reconstruction (sometimes called image restoration, if the data are also in the form of an image).
-
Available Online at www.ijpret.com
504
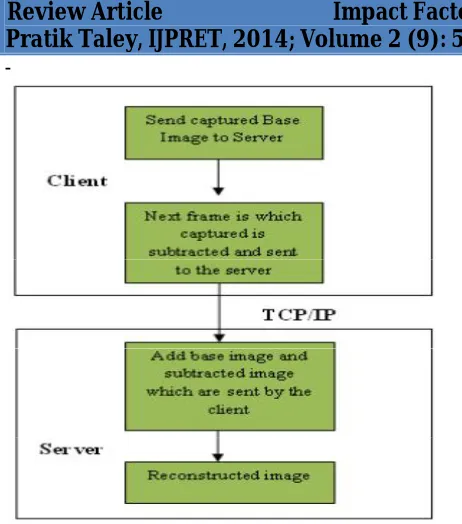
Figure 3: communication between client and server
During reconstruction of original image some noise can be seen. To reduce the noise the median filter is applied. This improves the quality of image.
Now again we have energy efficient techniques based on image processing as-
There are the two image transmission schemes driven by energy efficiency considerations in order to be suitable for wireless sensor networks. The first one is an open-loop image transmission scheme while the second one is closed-loop.
Both schemes are based on wavelet image transform and semi-reliable transmission to achieve energy conservation. Wavelet image transform provides data decomposition in multiple levels of resolution, so the image can be divided into packets with different priorities. Semi-reliable transmission enables priority-based packet discarding by inter-mediate nodes according to their battery’s state-of-charge. Such an image transmission approach provides a graceful trade-off between the image quality played out and the sensor nodes’ lifetime.
-
Available Online at www.ijpret.com
505
recent advances in microelectronics and wireless communications, it is predicted that wireless sensor net-works (WSN) will become ubiquitous in our daily life and they have already been a hot research area for the last couple of years. A wide range of emerging WSN applications, like object detection, surveillance, recognition, localization, and tracking, require vision capabilities. Nowadays, such applications are possible since low-power sensors equipped with a vision component like “Cyclops” already exist. Although the hardware prerequisites are met, application-aware and energy-efficient algorithms for both the processing and communication of image have to be developed to make vision sensor applications feasible.
Most of the work in literature is devoted to image processing (data extraction, compression and analysis) while the case of image transmission over WSN is still in an earlier stage of investigation. In this method, we propose two image transmission schemes driven by energy efficiency considerations suitable for WSN. They provide a graceful trade-off between the energy consumption to transmit the image data and the quality of the played-out image at receiver side. Both are based on discrete wavelet transform (DWT) and semi reliable transmission to achieve energy conservation. DWT allows image decomposition into separable sub bands for multi-resolution representation purposes. As a result, image data can be divided into priority levels that correspond to those of the resolution. In this way, full-reliable data transmission is only required for the lowest level of resolution. Others can be handled with a semi-reliable transmission policy in order to save energy. So, intermediate nodes between the source and the sink can decide to drop packets if they lack energy to forward, in accordance with packet priority. Our first scheme is qualified as open-loop since a node decides whether or not to drop packets of a given priority with respect to the state-of-charge of its battery independently of the other nodes. The second scheme is qualified as closed-loop since the discarding decision also depends on the available energy in the next intermediate nodes to the sink. We have developed an energy consumption model in order to evaluate our proposals in terms of the amount of saved energy. Since image processing is computationally intensive and operates on a large data set, the cost of the wavelet image transform and the entropy coding is also considered in our model. Compared to a fully reliable image transmission scheme where no special care is given to the energy consumption, numerical results show an energy savings of about 70% and 90% in the open-loop and closed-loop schemes, respectively.
2. PRAPOSED WORK
-
Available Online at www.ijpret.com
506
Now we will try to track objects successfully in multiple cameras, one needs to establish correspondence between objects detected and tracked in each camera. Our system is able to discover spatial relationships between the camera FOVs and use this information to correspond between different perspective views of the same person. We employ a novel approach of finding the limits of FOV of a camera as visible in the other cameras that is very fast compared to conventional camera calibration based approaches. Using this information, when a person is seen in one camera, we are able to predict all the other cameras in which this person will be visible. Moreover, we apply the FOV constraint to disambiguate between possible candidates for correspondence. When tracking is initiated, there is no information provided about the FOV lines of the cameras. The system can, however, find this information by observing motion in the environment. Whenever there is an object entering or exiting one camera, it actually lies on the projection of the FOV line of this camera in all other ones in which it is visible. Suppose that there is only one target. Then, when it enters the FOV of a new camera, we find one constraint on the associated line. Two such constraints will define the line, and all constraints after that can be used in a least squares formulation. In an earlier paper, it was demonstrated that the initialization of FOV lines by one person walking in the environment for about 40 seconds was sufficient to initialize the lines. These lines were then used to resolve the correspondence problem between cameras. However it is not always possible to have only one target moving in the scene. When multiple targets are in the scene and if one crosses the edge of FOV, all targets in other cameras are picked as being candidates for the projection of FOV line. Since the false candidates are randomly spread on both sides of the line whereas the correct candidates are clustered on a single line, correct correspondences will yield a line in a single orientation, but the wrong correspondences will yield lines in scattered orientations. We can then use Hough transform to find the best line in this case. This method needs more points for a reliable estimate of the lines and therefore takes longer time to set up correctly. Additional constraints derived from categorization of objects and their motion may be used to reduce the number of false correspondences, thus reducing the time it requires to establish the lines.
So aim of the paper is suggest the idea so that different electrical systems should become energy efficient by successfully tracking the object and will operate only when the object is successfully tracked. Thus, in this way any electrical system can be launched which will operate only for prior situation and thus we can avoid the wastage of energy.
APPLICATIONS:
-
Available Online at www.ijpret.com
507
It can be used at banks, airports and other public places to reduce the crime.
It can be used at auditoriums and conference hall to save electric power.
REFERENCES
1. G. Wallace,“The JPEG still picture compression standard,” Commun. ACM, vol. 34, no. 4, pp. 30–44, Apr. 1991.
2. K. Barr and K. Asanovic´, “Energy-aware lossless data compression,” ACM Trans. Comput.
Syst., vol. 24, no. 4, pp. 250–291, Aug. 2006.
3. D. Estrin, D. Culler, K. Pister, and G. Sukatme, “Connecting the Physical World with pervasive Networks,” IEEE Pervasive Computing
4. S. Nath, P. B. Gibbons, S. Seshan, and Z. R. Anderson, “Synopsis Diffusion for Robus Aggregation in Sensor Networks,” ACM Sensys, 2004.
5. Sen-Ching, S. Cheung and Chandrika Kamath “Robust Techniques for Background
Subtractionin Urban Traffic Vedio” center for applied scientific computing lawrence livermore national laboratory 7000 East Avenue, Livermore, ca 94550.
6. Ypussef Charfi, Bell Canada Naoki Wakamiya and Masayuki Murata, “Challenging Issues In Visual Sensor Networks”, Osaka University, 2009.
7. G. J. Pottie and W. J. Kaiser, “Wireless Integrated Network Sensors,” Communications of the ACM,vol. 43, no. 5, pp. 51- 58, 2000.
8. B. Krishnamachari, D. Estrin, and S .Wicker, “The Impact of Data Aggregation in Wireless Sensor Networks,” International Workshop of Distributed Event Based Systems, pp. 575-578, 2002.