ISSN: 1942-9703 / © 2016 IIJ
Sales Force Application Effectiveness Evaluation
for Improvement
Abstract— Sales Force Automation (SFA) is an application developed by a bank to record activities, keep in touch with customers, measured productivity and effectiveness of the Sales Force (SF). Consolidated reports of productivity of SFs after implementing SFA during the period of November 2013 through November 2014 shows that there are 42% non-productive SF or as many as 281 out of 671 SF. This shows the low use of SFA by the SF. This paper is aimed to evaluate SFA implementation by using Unified Theory of Acceptance and Use Technology (UTAUT) model approach. The results have obtained that effort expectancy variables have positive significant influence on behavioral intention and facilitating conditions have positive significant influence on the use behavior. The recommendations to improve the use of SFA that will eventually improve SF productivity and performance are also provided in the paper.
Keywords— Sales Force Effectiveness, Model UTAUT, Improve Performance, Productivity.
I. INTRODUCTION
Sales Force (SF) is the forefront for companies including the banking industry to get new customers and to build a relationship with customers for a long time. The success SF in marketing products or services must be supported with the knowledge and skills. In addition, companies should be able to provide power SF with a tool to ease proses of an application that can be used to monitor activities of SF. One of such tool is Sales Force Automation (SFA). The advancement in information technology have encourage the use of SFA with the hope to be able to improve the performance of the SF and customer service development [1][2]. This technology of SFA converts SF process monitoring activities from manually to electronic, through combination of hardware and software [3][4]. SFA help the SF to store, taking and analyzing customer data, and set up important information in the sales cycle activities [5][6] [7] [8][9].
Manuscript received August 5, 2015.
Bachtiar. H. Simamora is with the Performance Excellence Research Group, Bina Nusantara University, Jakarta, Indonesia (email: [email protected]; [email protected]).
Idris G. So is with Bina Nusantara University, Indonesia (email: [email protected]).
Natalia Bina Nusantara University, Indonesia (email: [email protected]).
A key functionality in any distributed computer systems is the communication between the different components. One of the characteristics of internet of things (IoT) systems is often the heterogeneity of communication technologies employed, which often is a direct reflection of the complex needs such systems have to be met. The performance of the communication protocol in the network may affect the operation of the systems [10]. The IoT has has received considerable attention for implementation in many fields, such as [11][12][13].
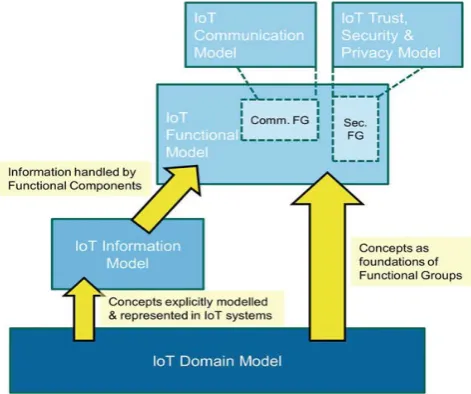
The IoT Communication Model introduces concepts for handling the complexity of communication in heterogeneous IoT environments. Communication also constitutes one Functionality Group (FG) in the IoT Functional Model. Finally, Trust, Security and Privacy (TSP) are important in typical IoT use-case scenarios. Therefore, the relevant functionalities and their interdependencies and interactions are introduced in the IoT TSP Model. As in the case of communication, security constitutes one FG in the Functional Model. Fig. 1 illustrates IoT reference Model for SFA (as a function) in the model.
Fig. 1. Interaction of all sub-models in the IoT Reference Model.
applications. The first application is to monitor SF performance named Sales Performance Tracking (SPT). The second application is to perform planning sales and monitor activities SF cycle, called a Sales Force Effectiveness (SFE).
With the SFE implementation, it is expected to build the mindset and work culture of SFs in line with the vision and mission of the company. Regular evaluation of SF with the use of SFA results shows that the expectation of overall improvement of SF performance has not been met (Figure 2).
Fig. 2. Percentage SF monthly productivity November 2013 - November 2014
From the observation report, the use and the productivity SFE during period of November 2013 through November 2014 (Figure 2), non-productive SFs are still 42% or as many as 281 out of 671 SF. This indicates the low use of SFE by the SF. It is necessary to know what the root causes are and how to eliminate or to reduce the causes of such problems. The low use of SFA possibly is because of low acceptance of SFE. This is happened as using SFE did not have any influences on performance evaluation, difficulties in use, lack of support from colleagues manager, the influence not to use SFA, less technical training, and lack of support. In order to achieve the Bank management expectation that the use of SFA will improve SF productivity and overall performance, it is necessary to evaluate the effectiveness of SFA implementation. One of the model to measure the level of user acceptance ininformation system is a Unified Theory of Acceptance and Use Technology ( UTAUT) that is developed by Vekantesh, et al. According to [14] , with the model UTAUT, it has been shown that the behavioral intention is influenced by the perception of expectancy performance, effort expectancy and social influence. On information technology, user behavior is influenced by behavioral intention and facilitating conditions.
II. RESEARCH METHODOLOGY
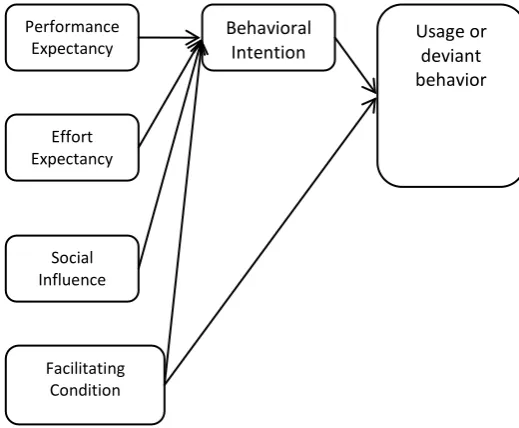
This research will use The Unified Theory of Acceptance and Use of Technology (UTAUT) to determine factors that are significantly affect interest to use and the use of SFA. Management hopes that applications of SFA will be fully utilized by the SFs that means they have to login and must input data from planning to settlement of sales with SFA. Because of this compulsory nature, the intervene variables of age, gender and experience are not included in this research model (Fig. 3.).
Fig. 3. Theoretical Framework Model
Indicators used on this UTAUT Model to evaluate SFA effectiveness are based on [14][15][16][17]. The indicators have been identified successfully through an interview with the team support of the SFA operation. The population of samples consits of salesperson and Manager of non-productive, which monitor the application of low usage and low selling activities recorded. The number of population as of November 2014 is 260. The population sample size is determined by the formula of Slovin with a target level of 90%-95%. Primary data are obtained directly from the sources, namely through a questionnaire that must be filled by the SFs and their managers. Secondary data include productivity use of SFA, earnings reports account per SF from the system. The measurement in questionnaire uses Likert scale with 5 (five) points namely strongly disagree, disagree, neutral, agree and strongly agree [18].
The hypothesis that can be drawn based on theoretical approach to test the performance expectancy, effort expectancy, social influence and facilitating conditions to behavioral intention and use behaviorare as follow:
1. Performance expectancy, effort expectancy, social influence and facilitating conditions at the same time have significant effect on behavioral intention in SFA system.
2. Facilitating conditions and behavioral intention to jointly affect on to use behavior in SFA system.
3. Performance expectancy, effort expectancy, social influence and facilitating conditions partially have significant effect on behavioral intention in SFA system.
4. Facilitating conditions and behavioral
intention partially have significant effect on to use behavior in SFA system.
Based on the hypothesis above, the relationship between Y and X is rendered as follows:
Performance Expectancy
Effort Expectancy
Social Influence
Facilitating Condition
Behavioral
Intention Usage or deviant
ISSN: 1942-9703 / © 2016 IIJ
1 4 4 3 3 2 2 1 1 1
1
a
b
x
b
x
b
x
b
x
e
Y
=
+
+
+
+
+
(1)2 4 5 1 4 2
2
a
b
y
b
x
e
Y
=
+
+
+
(2)where:
Y1: behavioral intention Y2: use behavior
a: Constant (price Y, if X=0) b: Coefficient regression analysis
X1: Performance Expectancy X2: Effort Expectancy X3: Social Influence X4: Facilitating conditions e: Error
III.RESULTS AND DISCUSSIONS
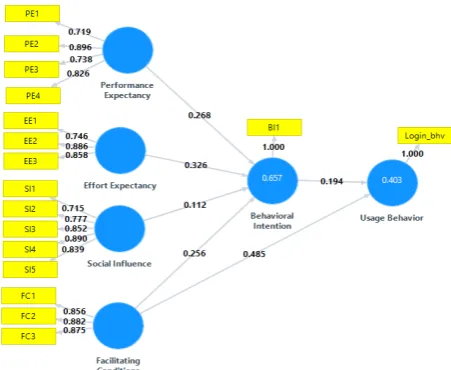
There were 20 questionnaire statements adopted from the previous UTAUT studies. Questionnaires were sent to all of the sample population of as many as 260 people scattered in 15 areas of business of Bank XYZ in Indonesia. Questionnaire filled and returned as many as 117 but only 111 valid for further processing and analysis. The valid questionnaires (111) met the sample size targets based on Slovin method with expected sample size for 90%-95% significance level is between 72-158 samples. The results of the path analysis are as follow (Figure 4).
Fig.4. Output path diagram
Outer model with indicators of reflection is evaluated with convergent and discriminant validity. According to [19][20], SmartPLS does not assume any particular distributions for parameter estimation, so the technique to test the significance of parameter is not required. Convergent validity is assessed based on the correlation between indicators with latent variables values. All the indicators have a loading factor > 0.6 so all acceptable charge indicators will represent a latent variable. Calculation of the value of the AVE > 0.5 already met the reabilitas with Cronbach's Alpha and Composite Reability
result >0.6, this showed that the laten variables are reliable [21], (Table 1).
TABLE 1. AVERAGE AND RELIABILITY TESTS
Variabel Laten AVE Composite Reability Cronbach's Alpha
Performance Expectancy 0.637 0.874 0.806 Effort Expectancy 0.693 0.871 0.777 Social Influence 0.667 0.909 0.874 Facilitating Conditions 0.759 0.904 0.842 Behavioral Intention 1.000 1.000 1.000 Usage Behavior 1.000 1.000 1.000
TABLE2
TABLETRIALF-STATISTICS(ANOVA)THEPE,EE,SIANDFC VARIABLETOBI
Models Sum of Manezh Squares
Df Mean Square
F Sig.
1
Regression 25,842 17 1,520 15,27 3 .000b Residual 9,257 93 .100
Total 35,099 110
a. Dependent variable: BI1
b. Predictors: (Constant), FC4, SI2, PE1, PE5, FC1, SI3, EE4, EE2, PE6, EE1, EE3, FC2, FC3, SI5, PE2, SI1, SI4
From result of f-statistic calculation in Table 2, the conclusion obtained that the independent variables performance expectancy (PE), effort expectancy (EE), social influence and facilitating condition (FC) have an impact on the interplay between Behavior Intention (BI) (Table 3).
TABLE 3. TABLE TRIAL F-STATISTICS (ANOVA) THE VARIABLE FC AND BI TO VARIABLE USAGE BEHAVIOR
Models Sum of Manezh Squares
Df Mean Square
F Sig.
1
Regressio
n 20,077 5 4,015 19,311 .000b Residual 21,833 105 .208
Total 41,910 110
a. Dependent variable: Usage Behavior b. Predictors: (Constant), BI1, FC1, FC4, FC2, FC3
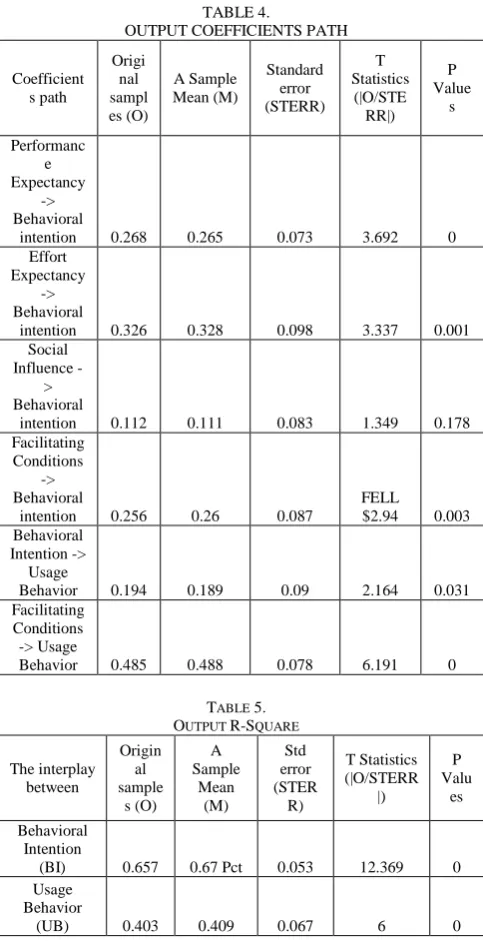
TABLE 4.
OUTPUT COEFFICIENTS PATH Coefficient s path Origi nal sampl es (O) A Sample Mean (M) Standard error (STERR) T Statistics (|O/STE RR|) P Value s Performanc e Expectancy -> Behavioral
intention 0.268 0.265 0.073 3.692 0 Effort
Expectancy -> Behavioral
intention 0.326 0.328 0.098 3.337 0.001 Social
Influence -> Behavioral
intention 0.112 0.111 0.083 1.349 0.178 Facilitating
Conditions -> Behavioral
intention 0.256 0.26 0.087
FELL
$2.94 0.003 Behavioral
Intention -> Usage
Behavior 0.194 0.189 0.09 2.164 0.031 Facilitating
Conditions -> Usage
Behavior 0.485 0.488 0.078 6.191 0 TABLE 5.
OUTPUT R-SQUARE
The interplay between Origin al sample s (O) A Sample Mean (M) Std error (STER R) T Statistics (|O/STERR |) P Valu es Behavioral Intention
(BI) 0.657 0.67 Pct 0.053 12.369 0 Usage
Behavior
(UB) 0.403 0.409 0.067 6 0
Looking at the t-statistics for the coefficient social influence to behavioral intention, it did not satisfy the cut-off of the 1.96. This indicated that the social influence do not have significant influence on the behavioral intention. While the performance expectancy, effort expectancy and facilitation conditions had the t-statistics > 1.96, this indicated that the significant influence of the behavior intention existed. The R-Square of the behavior intention is 0.657, this showed 65.7 percent can be explained by the performance expectancy, the effort expectancy and the facilitating conditions while 34.3 percent was explained by other variables that need to explore in a more detail study. The behavioral intention and the facilitating conditions had no effect on the usage behavior because the t-statistics was > 1.96. The R-Square of variables usage behavior was 0.403, this meant 40.3 percent can be explained by the behavior intention and the facilitating conditions. The multiple regression equation from the data analysis was obtained as follows:
4 3
2 1
1
0
.
268
x
0
.
326
x
0
.
112
x
0
.
256
x
Y
=
+
+
+
(3)4 1
2
0
.
194
y
0
.
485
x
Y
=
+
(4)1. Effect of performance expectancy on behavioral intention
SmartPLS calculation for the performance expectancy has the value of t-statistics 3.692 and the path coefficient value is 0.268. These indicate that the variable performance expectancy has a positive influence on the behavioral intention, as a result, the first hypothesis is accepted. This should be a concern for the SFA support team where this variable can predict an increase in the use of the SFA. From the tabulated results of questionnaires, if there are many leads present by SFA, then the salesperson will increase the use of the SFA because there are more opportunities to increase sales achievement. However, based on interviews of the SF, it is obtained that SFA leads related to data of customers are not current. This resulted in little opportunity for increasing sales. The leads data presented must be updated and this can be done using the data from the teller, customer service, ATM machine, a confirmation page after login internet banking or mobile banking. Furthermore, the presented leads aligned with the achievement must be rewarded in order to avoid counterproductive. To that end, the support teams and SF SFA support team achievement reporting system should collaborate in the presentation of the leads. Leads were followed up through the SFA should be rewarded in the form of money or other prizes as a bonus.
A.Effort Expectancy Influence on Behavioral Intention
ISSN: 1942-9703 / © 2016 IIJ
B. The Influence of Social Influence on Behavioral Intention
SmartPLS calculation results of the value of t-statistic for social influence coefficient is 1.349 and the path coefficient value is 0.112. These indicate that the variable effort expectancy does not have a significant effect on the behavioral intention, then the third hypothesis should be rejected. It also shows that the SF increasing use of SFA does not due to the influence of peers or supervisors.
2. The influence of facilitating conditions to behavioral intention
SmartPLS calculation results of the value of t-statistic for facilitating conditions coefficient is 2.94 and the path coefficient value is 0.256. These indicate that the variable facilitating conditions has a positive influence on behavioral intention, then the fourth hypothesis is accepted. Effect of support facility access can increase interest in the use of SFA, but these support facilities have greater influence on the increase in usage.
3. The influence of facilitating conditions on usage behavior
SmartPLS calculation results of the value of t-statistic for facilitating conditions coefficient is 6.191 and the path coefficient value is 0.485. These indicate that the variable conditions facilitating have a positive and significant effect on the usage behavior. It also means that the use of support facilities SFA can predict an increase in the use of the SFA. Therefore, it is necessary for the management attention to improve SFA infrastructure to support easy access, the availability of computer networks and computer devices adequacy. In addition, it should be noted that the support services to the SF when experiencing problems in accessing the SFA need to be provided fast and in a timely manner.
4. Influence behavioral intention to usage behavior
SmartPLS calculation results of the value of t-statistic for the behavior intention is 2.164 and the path coefficient value is 0.194. These indicate that the variable conditions facilitating have a positive effect on the usage behavior. It is also similar to the results of research by Vekantesh et al. [14], that the factor can predict an increase in interest in the use of the SFA usage behavior.
IV.CONCLUSIONS AND RECOMMENDATIONS
Conclusions
Evaluation results on SFA with the use of UTAUT model approach in this case study can be concluded as follow:
1) Social influence had no effect in a significant way, this showed that the SF use of the SFA was not due to the influence of his comrades or his/her supervisor. 2) Effort expectancy had a significantly positive effect on
behavioral intention, they will improve their use if the SFA quick and easily accessible in the sense was not limited to just login hyperlink and access, but access
between menus and execute functions (functions save, upload, download, etc.) in the quick menu.
3) Facilitating conditions had a significantly positive influence on use behavior. The computer used must be adequate and the availability of the network computer needs to be taken care of because it can affect the increased use of SFA.
Recommendations
The results of this research provided input for the management of SFA system so that its use was on the rise. It was based on multiple regression coefficients of equations can be composed of scale steps for improvement priorities as follow:
1) Effort Expectancy. Things that need to be
improved related effort expectancy is remodeling of the menu so that process faster access, increase the bandwidth of the network computers to access the SFA and updating manual book use of the SFA to more easily learned and practiced.
2) Performance Expectancy. Things that need to be improved related performance expectancy, namely the number of Leads increased personal data, especially updated their phone number, Leads presented inline with the sales performance assessment scheme.
3)
Facilitating Conditions. Things you need to be a concern related to facilitating conditions i.e. replacement of computer or upgrade specs for computers that are not sufficient to access the SFA, increased accuracy and speed support team.For researchers who want to use the UTAUT model in this case, it is recommended to explore the untapped enough indicators to represent the formation of latent variables. The study also needs to be continued in more detail with respect to the receipt and use of menus and functions that exist within the SFA.
REFERENCES
[1] Cascio, R., B.J. Mariadoss, and N. Mouri, “The Impact of Management Commitment Alignment on Salespersons' Adoption of Sales Force Automation Technologies,” An Empirical Investigation. Industrial Marketing Management, vol. 39, pp. 1088–1096, 2010. [2] Ahearne, M., R. Jelinek, and A. Rapp, “Moving Beyond the Direct
Effect of SFA Adoption on Salesperson Performance: Training and Support as Key Moderating Factors,” Industrial Marketing Management, vol. 34, no. 4, pp. 379-388, 2005.
[3] Rivers, M.L. and Jack Dart, “The Acquisition and Use of Sales Force Automation by Mid-Sized Manufacturers,” Journal of Personal Selling & Sales Management, vol. 19 , no. 2, pp. 59-73, 1999.
[4] Ahearne, M., D.E. Hughes, and N. Schillewaert, “Why Sales Reps Should Welcome Information Technology: Measuring the Impact of CRM-Based IT on Sales Effectiveness,” International Journal of Research in Marketing, vol. 24, no. 4, pp. 336-349, 2007.
[5] Morgan, A. and S.A. Inks, “Technology and the Sales Force: Increasing Acceptance of Sales Force Automation,” Industrial Marketing Management, vol. 30, no. 5, pp. 463-472, 2001. [6] Brown, S.P. and E. Jones, “Introduction to the Special Issue:
Advancing the Field of Selling and Sales Management,” Journal of Personal Selling and Sales Management, vol. 25, no. 2, pp. 103-104, 2005.
[8] Jayachandran, S., S. Sharma, P. Kaufman, and P. Raman, “The Role of Relational Information Processes and Technology Use in Customer Relationship Management,” Journal of Marketing, vol. 69, no. 4, pp. 177-192, 2005.
[9] Keillor, B.D., R.E. Bashaw, C.E. Pettijohn, “Sales Force Automation Issues prior to Implementation: The Relationship between Attitudes toward Technology, Experience and Productivity,” Journal of Business & Industrial Marketing, vol. 12, no. 3/4, pp. 209-219, 1997.
[10] Joelianto, E. and Hosana, “Loop-Back Action Latency Performance of an Industrial Data Communication Protocol on a PLC Ethernet Network,” Internetworking Indonesia Journal, vol. 1, pp. 11-18, 2009.
[11] Djajadi, A., and M. Wijanarko, “Ambient Environmental Quality Monitoring Using IoT Sensor Network,” Internetworking Indonesia Journal, vol. 8, no. 1, pp. 41-47, 2016.
[12] Botta, A., W. de Donato, V. Persico and A. Pescapé, “Integration of cloud computing and internet of things: a survey,” Future Generation Computer Systems, vol. 56, pp. 684-700, 2016. [13] Yang, J., S. He, Y. Lin, and Z. Lv, “Multimedia cloud transmission
and storage system based on internet of things,” Multimedia Tools and Applications, pp. 1-16., 2015.
[14] Vekantesh, V., M.G. Morris, G.B Davis, F.D. Davis, “User Acceptance of Information Technology: Toward A Unified View,”
MIS Quarterly, vol.27, no.3 pp. 425-478, 2013.
[15] Davis, F. D., “Perceived usefulness, perceived ease of use, and user acceptance of information technology,” MIS Quarterly, vol. 13, no. 3, pp. 318–340, 1989.
[16] Speier, C. and V. Venkatesh, “The Hidden Minefields in the Automation of Sales Force Automation Technologies,” Journal of Marketing, vol. 66 (July), pp. 98-111, 2002.
[17] Sedana, I Gusti Nyoman and Wijaya, St. Wisnu, “UTAUT Model for Understanding Learning Management System,” Internetworking Indonesia Journal, vol.2, no.2, pp.27-3, 2010.
[18] Likert, R., “A Technique for the Measurement of Attitudes.,”Archives of Psychology, vol. 140, pp. 1-55, 1932.
Bachtiar H. Simamora got a Master in Operations Research from The George Washington University and received his PhD in Industrial Engineering from Oklahoma State University. His main scientific and practical interest on optimization and business process improvement with specific emphasis on organizational performance excellence. He has published several international paper in that area and lead many consulting work both in private and public organization in Indonesia. He is currently associate professor at School of Business and Management and leads a research group of Performance Excellence at Bina Nusantara University in Jakarta, Indonesia.
Idris Gautama So got a Master in Business Administration from Philippines School of Business Administration and received his PhD in Marketing Management from Universiti Sains Malaysia. His main scientific and practical interest are on Marketing Strategy and International business. He has published several international papers in that area and conduct professional services both in private and public organization in Indonesia. He is currently associate professor at School of Business and Management and Dean of the school at Bina Nusantara University in Jakarta, Indonesia.