Current Multidisciplinary Studies
Available Online athttp://www.journalijcms.com Vol. 1, Issue, 1, pp.24-34, June, 2015
RESEARCH ARTICLE
INPUT – OUTPUT DYNAMICS OF COUNTERPART FUNDS PAYMENTS (CFP) AND SUB PROJECT IMPLEMENTATION (SPI) – ACQUISITION OF ASSETS (AA) OF FADAMA III
IN RIVERS STATE, NIGERIA; 2009 – 2012
Somiari, Fubara Richard1*and Uzomba, Peter Chika2
1Department of Agricultural and Applied Economics/Extension, Faculty of Agriculture, Rivers State
University of Science and Technology, Port Harcourt, Rivers State, Nigeria
2Department of Economics, Faculty of Social Sciences, University of Port Harcourt, P. M. B. 5323,
Choba, Port Harcourt, Rivers State, Nigeria Keywords:
Input, Output, Dynamics,
Counterpart Funds Payments (CFP), Sub Project, Assets.
Article history :
Received on May 18, 2015
Received in revised form, May 20, 2015 Accepted, June 20, 2015
Published June 28, 2015
ABSTRACT:
INTRODUCTION: General Overview and
Problem Statement:Generally, the implementation of agricultural activities depends on a number of factors of which Counterpart fund payments occupy
QUICK RESPONSE CODE Corresponding author: Somiari, Fubara Richard
Department of Agricultural and Applied Economics/Extension, Faculty of Agriculture, Rivers State University of Science and Technology, Port Harcourt, Rivers State, Nigeria
Article can be accessed online on:
www.journalijcms.com
a central place in the context of FADAMA III project.
This is because counterpart payment by stakeholders in the International Donor project has been identified as a key to effective implementation of programmes and projects. Essentially, such programmes form the necessary capital and cumulates in total project cost requirements that would serve as an important tool for the procurement of assets, provision of
IJCMS
This study analyzed the effects of beneficiary contributions, local and state government counterpart fund payments on the implementation of FADAMA III project in Rivers State
from 2009 –2012. Monthly and annual time series secondary data of counterpart fund
payments within the period under review were used for the analysis. The study made use of descriptive statistics, the short run Ordinary Least Square test, Unit-Root Test Analysis, Co-integration procedure, as well as Parsimonious Error Correction Models. Results established a long run relationship between the dependent and independent variables. The parsimonious result for the Total Project Implemented (TPI) equation
showed that for every₦1 million paid as beneficiary contributions by FADAMA Groups,
the value of Total Project Implementation increases by N2.91 million. The result of Asset Acquisition for Groups (AAG) equation shows that with every N1 million paid as beneficiary contributions by FADAMA Groups, the value of Asset Acquired increases by N1.12 million monthly. It was conclude that input-output dynamics of counterpart fund
payment (CFP) and sub project implementation – acquisition assets of FADAMA III
implementation of the programme.
Specifically, assets acquisition and capacity building play more central role in the implementation of the project. This is because total project implementation is a function of the ability of FADAMA beneficiaries to perform appropriate functions, effectively, efficiently and sustainably. Also, being able to access, control, and own productive assets such as, land, labour, finance, and social capital, would enable the beneficiaries to participate positively towards the sustainability of the project.In view of the foregoing, the stakeholders (beneficiaries, local and state governments) are expected to participate fully by contributing their quotas towards the full implementation of the project. Government in this direction has recognized that agricultural growth is the key to ensuring poverty alleviation, food security and the attainment of Millennium Development Goals(MDGs); hence the prompt payment of their quota at the federal level.
According toOnuchuku (2013) and Ohale (2011 and 2013) as at Mid-term in the FADAMA project life, the number of subprojects fully implemented greatly fell short of the target in Rivers State. This retarded and stultified the achievement ofFADAMA project development objectives stipulated in the Project Appraisal Document. Since counterpart fund payments are expected to stipulate asset acquisition which will in the long run lead to effective and
efficient implementation of sub projects in FADAMA III projects in Rivers state. Based on this pitfall and quasi achievement of the development objectives of FADAMA III projects it becomes necessary to investigate into the dynamics of counterpart funds payments (CFP) as inputs and Sub Project Implementation – Acquisition of Assets of FADAMA III as outputs in Rivers State, Nigeria; 2009–2012.
Consequently, the study intends to ask the question of what is the impact of counterpart fund payments on total sub project implementation and acquisition of assets by FADAMA group members in Rivers state. Providing empirical answer to this question stands this piece of work out from the previous studies. In line with this, the study sought to assess the effects of Counterpart fund payments on the total sub projects implemented in the state and determine the effect of Counterpart fund payments on the total value of assets acquired for use in the production of output by group members in FADAMA III projects in Rivers state from 2009 –2012. Further, the study was guided by these hypotheses: there is no significant relationship between counterpart fund Payments and the total number of Subprojects implemented in the State and there is no significant relationship between counterpart fund payments and the total quantity of assets acquired by the individual groups for the production of output.
This work was divided into five sections: section one
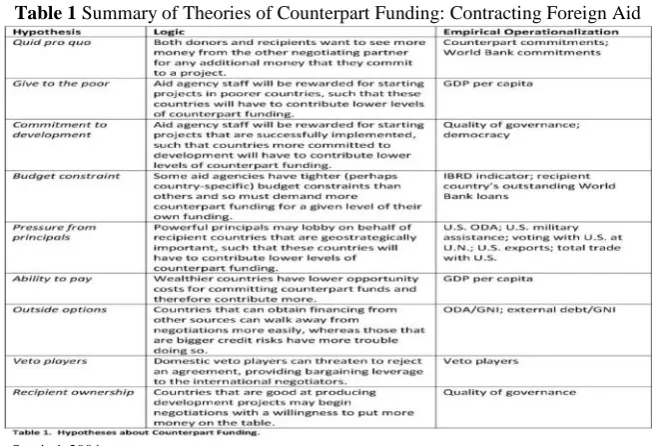
Table 1 Summary of Theories of Counterpart Funding: Contracting Foreign Aid
considers the introduction. Section two examines some relevant literature with a view to providing the background for the theoretical and conceptual framework. Section three outlines the methodological issues together with model Specification, evaluation and sources of data required. Section four presents and analyzes the empirical data. Finally section five considers the summary, policy recommend actions and conclusion.
Literature Review: Theories of Counterpart Fund Payments.
The Concept of Counterpart Funds: Richard and Dimitar (2006) simply defined counterpart funds as “funds linked to inflows of donor aid (including in-kind) and managed under specific procedures, taking into account the requirements of the donors concerned”. Counterpart fund payment is the contributory fund to the total cost of project implementation for a project or programme. Such payment by major stakeholders in the International Donor project is a key to effective implementation of programmes and projects (Ezeokeke, Anyanwu, and Okoro, 2012). This is because such payments could form the necessary capital that cumulates in total project cost requirements that would serve as important tool for the procurement of assets, provision of infrastructures, vehicles, etc, which could serve as preparatory framework for project takeoff.
It will also enable the acquisition of necessary capacity building and training to be carried out on the project staff as well as the target beneficiaries before the implementation of the project. Important equipment and assets, as well as necessary inputs would also be acquired for the implementation of their subprojects. In the case of FADAMA Development Project, the State and Local Government Councils as well as the beneficiary groups were expected to comply in the payment of counterpart funds. It is pertinent at this to define FADAMA III Project.
The Concept of Fadama: According to the Project Appraisal Document of the World Bank (2008), “FADAMA” is a Hausa name for irrigable land,
usually low-lying plains underlay by Shallow aquifers found along Nigeria's major river systems. The terminology varies from place to place in Nigeria: South West-”Akuro”, South- East-”Efam, Ani-Nmri, Ani-Uro” etc. Such lands are especially suitable for irrigated production and fishing, and traditionally provide feed and water for livestock. The enormous potential of this land is only very partially developed. The way the word is now used in the context of World Bank assisted project (i.e. FADAMA I, II and III) is more like an Agricultural Diversification programme. The FADAMA project is therefore a Federal/State/Local Government and World Bank assisted Agricultural project, aimed at sustainably increasing the income of Fadama users and other economic interest groups. It is a poverty alleviation programme. There had been Fadama I (1999 -2002); Fadama II (2003 – 2008), and now Fadama III (2009 -2013).
Empirical Literature on the Importance of Counterpart funds Payment in Projects Success: Matthew and Jaclyn (2013) counterpart fund payments by major stakeholders in the International Donor projects are key to effective implementation of programmes and projects. They are usually in the categories of State and Local Government Counterpart Fund Payments (SLGCFP) in a State and World Bank Fund (WBF) disbursement to the groups. Such payments could form the necessary capital that cumulates in total project cost requirements that would serve as important tool for the procurement of assets, provision of infrastructures, vehicles, etc, which could serve as preparatory framework for project takeoff. It will also enable the acquisition of necessary capacity building and training to be carried out on the project staff as well as the target beneficiaries before the implementation of the project. Important equipment and assets, as well as necessary inputs would also be acquired for the implementation of their subprojects.
generation, progression and Sustainability for FADAMA User Households to regression analysis discovered that one of the requirements for the participation in FADAMA III project was the payment of counterpart funds by the participating states and Local Governments.
Nyienakuna (2010) observed that about 33.3% of the FADAMA III local Government Areas have not commenced their target projects as a result of lack of counterpart fund payments. He therefore recommended that the FADAMA co-coordinating office should ensure prompt payment of counterpart funds by ensuring that such funds from participating Local Governments be deducted at source. Such payments will go a long way and was part of contributory funds for capacity building of the beneficiaries. It is important to state that capacity building is necessary to enable the participating members acquire the necessary skills to correctly implement their project (World Bank, 2008 and 2012).
For asset acquisition and diversification Ghosh (2010) points out that at the core of asset acquisition, revision, and rebalancing of asset holdings is the principle of diversification. The acquisition of assets and infrastructure was designed to allow groups and communities to identify and act on their most urgent needs for improved infrastructures and assets. Grant resources were allocated to each participating FCAs/FUGs for implementing priority demand driven community owned projects. Kuhnle (2006) maintained that if planned and implemented properly, with the full participation of the target population from the planning stage, rural infrastructure and assets development can make a significant and sustainable contribution to poverty reduction. Ekine (2010), in her study revealed that groups acquired different productive assets ranging from machetes/cutlass/Hoes – 43%, Oil processing machines (11%), cassava processing machines and wheelbarrows (9%), fish smoking kilns (8%), mainly financed by FADAMA III implying a positive impact as a result of the project.
Method of Study: The research design adopted in this study was evaluation research design. This was adopted for the purpose of making judgment about
the value, worth or effectiveness of the variables in the study. Even though there are various models in evaluation studies. The prominent and adaptable evaluation model which dwells on providing data that enable decision makers to take decision about a particular programme, is that developed by Stfflebeam (1971) in Somiari (2004). That is the CIPP model, an acronym which stands for four types of evaluation, namely, Context evaluation, Input evaluation, Process evaluation, and Product evaluation. In an attempt to justify the choice of research design in this study, content evaluation was in the aspect of the overall FADAMA III project in Rivers State, the input evaluation was in the area of counterpart fund payments by the beneficiaries, state and local governments, while the process evaluation covered the implementation of the FADAMA 111 Project while the product evaluation centered on the effects the counterpart fund payment have on the outcome (product) of the project.
This study also made use of secondary data that were disaggregated on monthly basis on beneficiary contributions from FADAMA User groups, counterpart funds payments in the state from 2009-2012, total number of implemented sub projects and acquisition of assets in 2009 -2012. These data were collected from: monthly, reports of the World Bank for FADAMA Projects implementation in Rivers State.
testing of the null hypotheses and conduction of other econometric second order tests in order to detect and correct the problem of multicollinearnity, heteroscdasticity and auto-correlation.
The specification of the functional relationship adopted for this investigation is implicitly stated below.
TPI = f (BCF, LGF, SGF) (1) AAG = f (BCF, LGF, SGF) (2)
Where:
TPI = Values of Total Sub Project
Implementation in the Rivers state. AAG = Values of Asset Acquired for Fadama
Groups in the Rivers state.
BCF = Values of Beneficiary Contributions by Fadama Groups in the State LGF = Values of Local Government
Counterpart fund payment in the State SGF = Values of State Government Counterpart
fund payment
From the functional relationships, the econometric models are specified in order to capture the influence of the statistic or random terms: hence the equations are explicitly transformed thus:
TPI = a0+ a1BCF + a2LGF +a3SGF + Ut (3)
AAG = a0+ a1BCF + a2LGF +a3SGF + Ut (4)
As other variables in equation 4 retained as earlier defined, a0stands for constant of the equation, a1, a2,
and a3, are coefficients of: BCF, LGF, and SGF,
while Ut is the stochastic or random or error
term.From equation (3) to (4), the mathematics forms of the models are specified thus:
TPI = + BCF+ LGF+ SGF (5) AAG= + BCF + LGF + SGF (6)
Arising from the forgoing and in line with the theoretical (aprori expectation), economic postulations suggest that payment of beneficiary contributions by the individual groups and counterpart funding will bring about increase in total number of subproject implementation and asset acquisition by individual groups for the production
of outputs. Based on the foregoing the expected signs of regression coefficients in all the equations are: a1,
a2, a3, > 0.
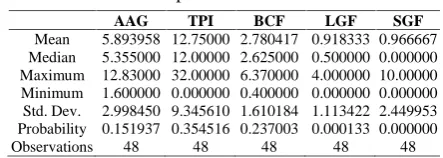
Empirical Analysis: This section presents a descriptive statistics of the variable, results of unit root (stationarity) tests, cointegration tests and error correction models.The descriptive statistics of the variables used in estimations in this study are presented in table 2
The counterpart fund from the Rivers State Government (SGF) and value of total number sub-projects implemented (TPI) had a mean of 0.97 and 12.75 respectively. The time series variables (SGF and TPI) had a minimum of 0.00 and 0.35 respectively. The highest values for SGF and TPI is 10.00 and 32.00; with a standard deviations of 2.45 and 9.35 respectively. The figures for State Government Counterpart Fund Payments were low meaning poor compliance for the period under review, while there was adequate number subproject implementation for those who received World Bank disbursements. The value for asset acquired by FADAMA Groups (AAG) averages 5.89. It (AAG) ranges from 1.60 to 12.83 with a standard deviation of approximately 3.00. The descriptive statistics on the AAG variable implies that a minimum asset on the worst off scenario needs to be acquired for a sub project takeoff, while an adequate and complete asset acquired will boost production. This means that a good number of the groups acquired adequate assets, while the probability of groups that did not acquire asset is zero.
Beneficiaries’ contribution by FADAMA groups (BCF) has a mean of 2.78 with 0.40 and 6.37 as its minimum and maximum values respectively. The standard deviation of BCF is 1.61. The implication of
Table 2 Descriptive Statistics of Variables
AAG TPI BCF LGF SGF
Mean 5.893958 12.75000 2.780417 0.918333 0.966667 Median 5.355000 12.00000 2.625000 0.500000 0.000000 Maximum 12.83000 32.00000 6.370000 4.000000 10.00000 Minimum 1.600000 0.000000 0.400000 0.000000 0.000000 Std. Dev. 2.998450 9.345610 1.610184 1.113422 2.449953 Probability 0.151937 0.354516 0.237003 0.000133 0.000000
Observations 48 48 48 48 48
these on beneficiary contribution is that there must be an atom of contribution to attract World Bank fund. The mean contribution is low implying that beneficiary contribution by the groups is a problem. Local government council counterpart fund payments (LGF) average 0.92 ranging from 0.00 to 4.00 with a standard deviation of 1.11. The figures for Local Government Counterparts are low implying low payments. The mean for the value of output by Fadama groups (OPT) was 13.47 with a minimum of 1.30 and a maximum of 58.70.
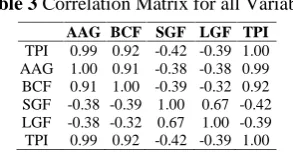
Correlation Matrix:
Positive correlation as well of negative correlation exists among all the variables; with high correlation and some with low correlation (see table 4.3 above). For example, there is high positive and strong correlation between TPI and BCF at 0.99 and 0.92 respectively, while a negative and weak relationship exists between TPI and SGF and LGF at the values of -0.42 and -0.39 respectively. Also, the same
revealed that AAG and maintained a positive and strong relationship with BCF but had a negative but weak relationship with SGF and LGF at 0.91, -0.38 and -0.38 respectively.
The time series behavior of each of the series normalize with using the ADF and PP tests at both level and first difference of the series. The results presented in tables 4.4 and 4.5 below depicts that all the variables are homogenous of order one. Therefore, they are made stationary by first difference prior to subsequent estimations to forestall spurious regressions.
tTstands for the most general model with an intercept
and trend; tµis with an intercept but without trend;
t is the one without intercept and without trend.
Unit root tests were performed from the most general to the most restricted model as also suggested by Enders (1995). *, ** and *** represent the rejection of the null hypothesis at alpha 1 percent, 5 percent and 10 percent respectively (Dickey and Fuller, 1981; Phillips and Perron, 1988). Tests were carried out in E-VIEWS 7.1.
Co integration Tests: The results of the cointegration tests for the four (4) models are extracted in to tables 4.6, 4.7, 4.8 and 4.9.
Table 3 Correlation Matrix for all Variables
AAG BCF SGF LGF TPI
TPI 0.99 0.92 -0.42 -0.39 1.00 AAG 1.00 0.91 -0.38 -0.38 0.99 BCF 0.91 1.00 -0.39 -0.32 0.92 SGF -0.38 -0.39 1.00 0.67 -0.42 LGF -0.38 -0.32 0.67 1.00 -0.39 TPI 0.99 0.92 -0.42 -0.39 1.00
Source: Author’s Computation. Note: Variables are as defined in Table 2
Table 4 Unit Root Test at level
ADF PP
Variable tµ tT t tµ tT t Decision
TPI -2.646553 -2.888342 -1.422335 -2.153683 -2.211414 -1.069042 Non-Stationary
AAG -2.728539 -3.056574 -1.469151 -2.241956 -2.399531 -1.134978 Non-Stationary
BCF -2.845381 -3.227899 -0.939203 -2.790058 -3.322057 -1.319382 Non-Stationary
LGF -2.363227 -2.702757 -2.183383 -2.940473 -3.266677 -2.183383 Non-Stationary
SGF -6.084383* -4.286443* -6.821987* -3.017643 -3.599984 -2.708714 Non-Stationary
Critical Value Critical Value Crit Value Critical Value Critical Value Critical Value 1%= -3.581152 1%= -4.1705 1%= -2.616 1%= -3.577723 1%= -4.165756 1%= -2.615093 5%= -2.926622 5%= -3.51074 5%= -1.948 5%= -2.925169 5%= -3.508508 5%= -1.947975 10%= -2.6014 10%= -3.1855 10%= -1.61 10%= -2.600 10%= -3.18423 10%= -1.6124
Table 5 Unit Root Test at First Difference
ADF PP
Variable tµ tT t tµ tT t Decision
TPI -4.275652* -4.312145* -4.341868* -4.230306* -4.257595* -4.299189* I (1) AAG -4.239516* -4.273000* -4.304970* -3.965116* -4.873794** -4.043431* I (1) BCF -9.207581* -9.175282* -9.297391* -9.259064* -9.209273* -9.340249* I (1) LGF -5.332239* -5.160966* -5.338406* -8.038153* -8.007156* -8.137095* I (1) SGF -4.024710 -6.927256 -6.842180 -11.81451 -11.04826 -12.04467 I (1)
Crit Value Crit Value CritValue CritValue Crit Value Crit Value 1%= -3.5811 1%= -4.1705 1%= -2.616 1%= -3.577 1%= -4.165 1%= -2.615
The test statistics indicate that the hypothesis of no cointegration, Ho, among the variables can be
rejected (Engle and Grange, 1987). The results reveal four cointegrating vectors exist among the variables of interest in the TPI model. Since the variables are cointegrated, there is, therefore, a long run relationship among the variables. It also means
that the study can proceed to estimating the Error Correction Model for the TPI model.
The test statistics, as shown in table 4.7, indicate that the hypothesis of no cointegration (i.e Ho) among the
variables can be rejected. The results reveal four cointegrating vectors exist among the variables of Table 6 Cointegration Result for the Total Project Implementation (TPI) Model
Trace Test k=2 Maximum Eigenvalue Test k=2
HO HA (λ trace) Crit Values (5 %) HO HA (λ Max) Crit Values (5%)
r≤ 0 r > 0 70.80864* 47.85613 r≤ 0 r > 0 30.37617* 27.58434 r≤ 1 r > 1 40.43247* 29.79707 r≤ 1 r > 1 20.15882 21.13162 r≤ 2 r > 2 20.27366* 15.49471 r≤ 2 r > 2 15.54650* 14.26460 r≤ 3 r > 3 4.727157** 3.841466 r≤ 3 r > 3 4.727157* 3.841466
Note: r represents number of cointegrating vectors and k represents the number of lags in the unrestricted VAR model. * denotes rejection of the null hypothesis at the 5% level.
Table 7 Co integration Result for the Asset Acquired for Fadama Groups (AAG) Model
Trace Test k=2 Maximum Eigenvalue Test k=2
HO HA (λ trace) Crit Values (5 %) HO HA (λ Max) Crit Values (5%)
r≤ 0 r > 0 69.06445* 47.85613 r≤ 0 r > 0 30.19156* 27.58434 r≤ 1 r > 1 38.87289* 29.79707 r≤ 1 r > 1 18.67412 21.13162 r≤ 2 r > 2 20.19877* 15.49471 r≤ 2 r > 2 15.48202* 14.26460 r≤ 3 r > 3 4.716744* 3.841466 r≤ 3 r > 3 4.716744* 3.841466
Note: r represents number of cointegrating vectors and k represents the number of lags in the model. * denotes rejection of the null hypothesis at the 5% level.
Table 8 Parsimonious TPI Model
Dependent Variable: D(TPI)
Included observations: 45 after adjustments
Variable Coefficient Std. Error t-Statistic Prob.
C 0.090753 0.395693 0.229354 0.8199
D(TPI(-1)) 0.587952 0.165246 3.558051 0.0011
D(BCF) 2.908024 0.350406 8.299018 0.0000
D(BCF(-1)) -1.150405 0.636815 -1.806497 0.0792
D(BCF(-2)) -0.382454 0.359104 -1.065022 0.2940
D(LGF) -0.968751 0.481717 -2.011038 0.0519
D(LGF(-1)) -0.494697 0.448655 -1.102621 0.2775
D(SGF(-1)) 0.368287 0.202670 1.817174 0.0775
ECM(-1) -0.845067 0.175882 -4.804739 0.0000
R-squared 0.749948 Mean dependent var 0.177778
Adjusted R-squared 0.694381 S.D. dependent var 4.730409
S.E. of regression 2.615101 Akaike info criterion 4.937339
Sum squared resid 246.1952 Schwarz criterion 5.298672
Log likelihood -102.0901 F-statistic 13.49629
Durbin-Watson stat 2.090093 Prob(F-statistic) 0.000000
Table 9 Parsimonious AAG Model
Dependent Variable: D(AAG)
Included observations: 45 after adjustments
Variable Coefficient Std. Error t-Statistic Prob.
C 0.037294 0.179180 0.208138 0.8363
D(AAG(-1)) 0.573150 0.165897 3.454860 0.0014
D(BCF) 1.115940 0.160357 6.959105 0.0000
D(BCF(-1)) -0.410079 0.261566 -1.567781 0.1254
D(BCF(-2)) -0.161711 0.162733 -0.993720 0.3268
D(LGF) -0.452211 0.206561 -2.189238 0.0350
D(SGF) 0.128983 0.090248 1.429203 0.1613
ECM(-1) -0.840151 0.178405 -4.709236 0.0000
R-squared 0.685024 Mean dependent var 0.071333
Adjusted R-squared 0.625434 S.D. dependent var 1.935330 S.E. of regression 1.184456 Akaike info criterion 3.336256 Sum squared resid 51.90865 Schwarz criterion 3.657440
Log likelihood -67.06575 F-statistic 11.49563
interest in the AAG model. Since the variables are cointegrated, there is, therefore, a long run relationship among the variables. It also means that the study can proceed to estimating the Error Correction Model for the AAG model.
Error Correction Model:Every variable was set at 2 lag. ECM was derived from the cointegrating relationship in tables 4.6, 4.7, 4.8 and 4.9. The parsimonious interaction involves dropping insignificant variables (Johnsen, 1988; and Gujarati and Sangeetha 2007). Therefore, the size of the model was reduced by imposing zero coefficients on those lags where‘t’ statistic is low. Through simplification, a more parsimonious and interpretable model was produced as shown in the equations and tables that follows.
Error Correction Model for Total Project:
Implementation (TPI) Model: The parsimonious result for the TPI equation is shown in the table 4.8 above. According to the result, R2 value of 0.75 shows that all the variables can explain about 75% of the value of Total Project Implementation. 25% of the variation in the model is accounted for by other variables not included in the model. They may, though not limited to, loans gotten from commercial banks, loans from microfinance institutions and loans from co-operative societies. The unexplained variation in the model also influences the behaviour of the model. F-statistic of 13.496 (P<0.05) shows that they are jointly significant and the Durbin Watson value of 2.09 implies that the model does not suffer from autocorrelation problem.
In terms of the significance of the individual variables, it is observed that the explanatory variables (i.e SGF, LGF and BCF) were significant determinants, at various conventional levels of statistical significance (i.e 1%, 5% and 10%), of the value of Total Project Implementation under Fadama for the period of analysis. Specifically, beneficiary contributions by Fadama Groups in Rivers State {measured by D(BCF)} raises the value of Total Project Implementation by N2.91 million. This implies that with every N1 million paid as beneficiary contributions by Fadama Groups, the value of Total Project Implementation increases by N2.91 million. Again, though significant, Local
Government Counterpart fund payment in the State {measured by D(LGF)} was not correctly signed. Local Government Counterpart fund payment in the State reduces the value of Total Project Implementation by N969,000. Past State Government Counterpart fund payment {measured by D(SGF(-1))} was correctly signed and raises the value of Total Project Implementation by N368,000. The ECM has the correct sign (i.e –ve) and significant meaning that about 84.5% of the errors are corrected monthly.
Error Correction Model for Asset Acquired for Fadama Groups (AAG) Model: The parsimonious result for the AAG equation is shown in the table 4.13 above. The R2value of 0.69 implies that all the variables can explain about 69% of the value of Asset Acquired for FADAMA Groups (AAG). 31% of the variation in the model is accounted for by other variables not included in the model. They may, though not limited to, include loans gotten from commercial banks, loans from microfinance institutions and loans from co-operative societies.F-statistic of 11.496 (P<0.05) shows that they are jointly significant and the Durbin Watson value of 2.10 implies that the model does not suffer from autocorrelation problem.
Acquired for FADAMA Groups (AAG) increases by N1.12 million monthly. Though correctly signed ( i.e +ve), State Government Counterpart fund payment {measured by D(SGF)} was insignificant and thus not a reliable statistics. The ECM has the expected sign (i.e –ve) and also significant meaning that about 84% of the errors are corrected monthly.
Empirical Results and Discussions: The study considered input – output dynamics of counterpart funds payments (CFP) and sub project implementation–acquisition of assets of FADAMA III in Rivers State, Nigeria from 2009–2012, using descriptive statistics, multiple regression analysis, unit root and co integration tests as well as Parsimonious error correction model to arrive at the following results:The parsimonious result for the TPI equation shows that all the variables can explain about 75% of the value of Total Project Implementation (TPI). F-statistic of 13.496 (P<0.05) shows that they are jointly significant and the Durbin Watson value of 2.0 implies that the model does not suffer from autocorrelation problem. This agrees with Winter, 2011 and Marsh and Panell, 2013.
In terms of the significance of the individual variables, for every N1 million paid as beneficiary contributions by FADAMA Groups, the value of Total Project Implementation increases by N2.91 million. Local Government Counterpart fund payment in the State reduces the value of Total Project Implementation by N969,000, while State Government Counterpart fund payment raises the value of Total Project Implementation by N368,000. The error correction model maintained the expected sign at the value -0.845067, meaning that it will take TPI about 8 months five days to yield the expected result. The adjusted R2is a confirmation to this fact. This is because its value of 0.69 suggests that about 69% changes in nTPI are attributed to BCF, SGF and LCF, though SGF and LCF asserts negative influence on TPI as at the time of filling in this report. This result is in conformity with Alesina and Dollars (2000) and Echeme and Nwachukwu (2000).
For the parsimonious result of AAG equation, R2 value of 0.69 implies that all the variables can explain about 69% of the value of Asset Acquired
for FADAMA Groups (AAG). F-statistic of 11.496 (P<0.05) shows that they are jointly significant and the Durbin Watson value of 2.10 implies that the model does not suffer from autocorrelation problem. In terms of the significance of the individual variables, it is observed that beneficiary contributions by FADAMA Groups (BCF) and Local Government Counterpart fund payment (LGF) were significant determinants of the value of Asset Acquired for FADAMA Groups (AAG) for the period of analysis. Specifically, beneficiary contributions by FADAMA Groups in Rivers State {measured by D(BCF)} raises the value of Total Project Implementation by N1.12 million.
This implies that with every N1 million paid as beneficiary contributions by FADAMA Groups, the value of Asset Acquired for FADAMA Groups (AAG) increases by N1.12 million monthly. Secondly, Local Government Counterpart fund payment in the State reduced the value of Total Project Implementation by N452, 000 monthly. This implies that with every N1 million paid as Local Government Counterpart fund, the value of Asset Acquired for Fadama Groups (AAG) increases by N1.12 million monthly. Further, table 4.9 documents the parsimonious error correction model result with ECM being properly signed as it retains its expected sign at the value of -0.840151. This means that within the period under investigation, AAG needed about 8 months 4 days for the group to be able to be efficient and effective in terms of implementation of FADAMA III projects in Rivers State. The adjusted R2 of 0.625434 is an indicative of the fact that BCF, SGF and LCF are responsible for about 63% changes in AAG and as such those variables also assert somewhat influence on AAG
CONCLUDING REMARKS AND
correction model to estimate and interpret the relationship using the monthly time series data of 48 observations. From the findings, there exist a long run positive relationship between the dependent and the Independent. Conclusively, the input-output dynamics of counterpart fund payment (CFP) and sub project implementation – acquisition assets of FADAMA III project in Rivers state revealed that inputs in terms of BCF was able to stimulate TPI and AAG by maintaining a positive relationship of about 92% and 91% respectively, while both state and local governments funds were found to be poor and as such failed to spur TPI and AAG within the period of study.
Based on the findings of the study, the following recommendations are hereby proposed: there should be legislative approval by the National Assembly to deduct such participating State and Local Government Council counterpart fund payments at source to avoid the problem of nonpayment after project takeoff as this will contribute effectively to full implementation of FADAMA III project. Both Federal and State Ministry of Agriculture should ensure that the FADAMA State Project Implementation Unit record every bit of FADAMA activity in the area of project implementation as this will enable them meet the eligibility criteria at the state level. The FADAMA group members should undergo a value re-orientation programme that will enable them realize that co-operate spirit among them will contribute to effective implementation of FADAMA III project in the state. The Federal Government of Nigeria, through the Federal Ministry of Agriculture should mandate the beneficiaries, local and state governments to make full payments of their counterpart funds, as this will increase the number of projects that could be implemented as demonstrated by the result of Parsimonious Error Correction Model.
References:
Alesina, A. & Dollar, D. (2000). Who gives foreign aid to whom and why. Journal of economic growth, 5(1), 33-63.
Chukuigwe, E. C. (2010).The Fadama III baseline report, Port Harcourt, Rivers State. P.9
Chukuigwe, E. C. (2011). Household income generation, progression
and Sustainability in FadamaIII implementation project in Rivers State, Port Harcourt, Nigeria. Pp.5-7
Dickey, D.A. & Fuller, W.A. (1981) Likelihood ratio statistics for autoregressive time series with a unit root. Econometrica,
49(4), 1057-1072.
Dimitar, C. ( 2000). Aid, Policies, and Growth.American Economic
Review 90.4: 847-68.
Echeme, I. I. &Nwachukwu, C.C. (2010). An investigation on the impact of Fadama II project Implementation in
Imo State, American Journal Of Scientific and Industrial Research ©
2010, Science Huβ, http://www.scihub.org/AJSIR ISSN: 2153-649X doi:10.5251/ ajsir.2010.1.3.532.538.
Ekine, D. (2011). The contribution of small scale community owned
infrastructure (SSCI) and asset acquisition to the attainment of Fadama III Project Development Objective in Rivers State. Port
Harcourt, Nigeria.
Engle, R. F. & Granger, C. W. I. (1987). Co-integration and error correction: representation,estimation and testing.
Econometric.3(55):251-76.
Ezeokeke, C.T.,Anyanwu, N.J. &Okoro, V.M.O. (2012). Impact of Fadama II project on feed, food, and poverty in Imo State, Nigeria.
International Journal of Applied Sociology 2(3):22-24 DOI: 5923/j.ijas 20120203 .03.
Fadama Project Coordinating Unit (2013).Implementation Status Report, Abuja, F. C.T. July.
Fischer, D. E. & Jordan, R. J. (2009).Security analysis and portfolio
management, Edition.Patparganj Delhi, Dorling Kindersley
Publishers Ltd.
Ghosh, D. (2010). Asset acquisition, diversification, and revision-Theoretic exercises in portfolio theory.Academic Journal Article
FromQuarterly Journal of Finance and Accounting, Vol. 49, No. 1
Gujarati, D. N. &Sangeetha, P. (2007).Basic Econometrics.Tata McGraw-Hill Publishing Company Limited. Pp. 92
Johnsen, S. (1988).Statistical analysis of co-integration vectors.Journal
of Economic Dynamics and Control 12:231-254
Kuhnle, R. (2006). Rural infrastructure development and poverty
reduction: Example of Bangladesh, Asian Development Bank Institute. Retrieved from
www.adbi.org/conf.seminar-Marsh, S.P. & Pannell, D. J.(2000). Agricultural extension policy in Australia: the good, the bad and the misguided. Australian Journal
of Agricultural and Resource Economics 44(4): 605-627.
Matthew S. W. &Jaclyn, D. S. (2013). Splitting the check: bargaining over counterpart commitments in World Bank projects.Journal of
Development Studies 42.5: 772-94
Nyienakuna, M. G. (2011). Contribution of advisory services and input
support, support to ADPs and adaptive research to the attainment of the Fadama III project development objective in Rivers State.
Port Harcourt, Nigeria.
Ohale, L. (2011). Social capital formation and implications for the
achievement of Fadama III project development objectives in Rivers State. Port Harcourt, Nigeria.
Ohale, L. (2013). A study to assess the adoption rate of technologies in
Fadama III implementation in Rivers State. Port Harcourt, Nigeria.
Onuchuku, O. (2013). Medium-term impact of fadama(fadama III)
project in Rivers State. Port Harcourt, Nigeria.
Phillips, P.C.B. and Perron, P. (1988).Testing for a unit root in time series regression.Biometrika, 75(2), 335-346.
Richard, A. &Dimitar, R. (2006). Managing and Controlling Extrabudgetary Funds. OECD Journal on Budgeting, 6(9), 48-90. Somiari, F. R. (2004). Export supply of cassava products from Nigeria
(Unpublished M.Sc. dissertation). University of Science & Technology, Port Harcourt, Rivers State.
Svensson, J. (2000). When is foreign aid policy credible? aid dependence and conditionality.Journal of Development Economics
61: 61-84.
The World Bank, (2008). Project appraisal document: third national
FADAMA development Project. Abuja, Nigeria. Report No: 39489
–NG.
project lenders Midterm review report. Port Harcourt, Rivers
State Coordination Office; Pp. 1-12.
Winters, M. S. (2011). The world bank and the global financial crisis: the reemergence of lending to middle-Income Countries,”
Whitehead Journal of Diplomacy and International Relations 12.2: 57-72.
How to cite this article:
Somiari, Fubara Richard et al.,: Input–Output Dynamics of Counterpart Funds Payments (CFP) and Sub Project Implementation (SPI)–
Acquisition of Assets (AA) of FADAMA III in Rivers State, Nigeria; 2009–2012, International Journal of Current Multidisciplinary Studies 2015; 1(1): 24-34.