www.biogeosciences.net/11/5539/2014/ doi:10.5194/bg-11-5539-2014
© Author(s) 2014. CC Attribution 3.0 License.
Provenance of tetraether membrane lipids in a large temperate lake
(Loch Lomond, UK): implications for glycerol dialkyl glycerol
tetraether (GDGT)-based palaeothermometry
L. K. Buckles1, J. W. H. Weijers1,*, X.-M. Tran1, S. Waldron2, and J. S. Sinninghe Damsté1,3
1Department of Earth Sciences, Utrecht University, Utrecht, the Netherlands
2Department of Geographical and Earth Sciences, University of Glasgow, Glasgow, UK
3NIOZ Royal Netherlands Institute for Sea Research, Department of Marine Organic Biogeochemistry,
Den Burg, the Netherlands
*now at: Shell Global Solutions International B.V., Rijswijk, the Netherlands Correspondence to: J. S. Sinninghe Damsté ([email protected])
Received: 16 January 2014 – Published in Biogeosciences Discuss.: 17 March 2014 Revised: 18 August 2014 – Accepted: 1 September 2014 – Published: 9 October 2014
Abstract. The application of glycerol dialkyl glycerol tetraether (GDGT)-based palaeoenvironmental proxies, such as the branched vs. isoprenoidal tetratether (BIT) index, TEX86 and the MBT–CBT palaeothermometer, has lately
been expanded to lacustrine sediments. Given recent research identifying the production of branched, bacterial GDGTs (brGDGTs) within lakes, it is necessary to ascertain the effect of this lacustrine production on GDGT-based proxies. This study profiles a temperate, monomictic lake (Loch Lomond, UK), analysing labile intact polar GDGT lipids (IPLs) and resilient core GDGT lipids (CLs) in catchment soils, small tributary rivers, lake water and lake sediments.
Loch Lomond consists of two basins bisected by the High-land Boundary Fault, resulting in a mesotrophic to olig-otrophic gradient from south to north. The north basin is fjord-like, while the south basin is shallow with a lowland catchment. Besides abundant influxes of allochthonous soil-and peat-derived (CL) brGDGTs, brGDGTs are produced in a variety of settings in Loch Lomond. Rather than integrat-ing a scattered soil signal, there is some evidence that small rivers may contribute to the brGDGT pool through addition of brGDGTs produced in situ in these streams. Three hun-dred days of settling particles and water column profiles of suspended particulate matter (SPM; March and September 2011) reveal brGDGT production throughout the water col-umn, with (IPL and CL) brGDGT distributions varying by basin. In lake sediments, in situ brGDGT production affects
the distributions of sedimentary brGDGTs despite high soil-and peat-derived organic matter influxes from the catchment. MBT–CBT-derived mean annual air temperature (MAAT) estimates from soil, river and lake sediments vary widely. A strong bias towards higher MAATs in the south and lower MAATs in the north basin further complicates the application of the proxy. These results emphasise that caution must be exercised when applying the MBT–CBT palaeothermome-ter to individual lakes in which the use of the proxy has not been validated and therefore the factors affecting its ap-plication are not well understood. Despite elevated BIT in-dices, (partly) due to in situ brGDGT production, reliable TEX86 lake surface temperature (LST) estimates were
ob-tained from SPM with BIT indices up to 0.9. Lower north basin sediments yielded accurate LST estimates but require further evaluation to properly constrain the application of the TEX86proxy.
1 Introduction
also due to a lack of quantitative proxies for continental air temperature. A relatively new quantitative temperature proxy is based on the proportions of bacterially derived branched glycerol dialkyl glycerol tetraether (brGDGT) membrane lipids in soils. The relative amount of cyclopentane moi-eties and methyl branches contained in these membrane lipids, expressed in the cyclisation and methylation indices of branched tetraethers (CBT and MBT, respectively), are related to soil pH and mean annual air temperature (MAAT) (Weijers et al., 2007a; Peterse et al., 2012). Upon soil erosion these compounds are transported to the marine realm, and the MBT–CBT proxy has therefore been successfully applied to near-coastal marine sediments containing considerable ter-restrial organic matter to reconstruct river basin integrated continental MAAT (e.g. Weijers et al., 2007b, c; Schouten et al., 2008). In order to extend the continental coverage of tem-perature reconstructions, application of the MBT–CBT proxy to potentially high-resolution lacustrine sediment records is a logical step.
However, distributions of brGDGTs in lake surface sedi-ments showed a general mismatch with those in surrounding soils, and reconstructed MAATs from lake surface sediments were found to generally underestimate instrumental temper-atures, when applying the soil-based MBT–CBT calibration. This suggests that additional production of these compounds within the lake system must occur (e.g. Sinninghe Damsté et al., 2009; Tierney and Russell, 2009; Bechtel et al., 2010; Blaga et al., 2010; Tierney et al., 2010; Tyler et al., 2010; Zink et al., 2010; Sun et al., 2011; Sinninghe Damsté et al., 2012). Although several local and regional MBT–CBT cal-ibrations based on lake surface sediments have been pro-duced in an effort to eliminate this offset (e.g. Tierney et al., 2010; Zink et al., 2010; Pearson et al., 2011; Sun et al., 2011; Loomis et al., 2012), an improved understanding of the source(s) of the brGDGTs produced in the lake system is nec-essary to better constrain the applicability of the MBT–CBT palaeothermometer to lake sedimentary archives.
As there are no known producers for all but one of the brGDGTs used in the MBT–CBT palaeothermometer (Sin-ninghe Damsté et al., 2011), it is not possible to trace brGDGT producers through the application of molecular ecological techniques. However, through the introduction of a method by Pitcher et al. (2009a) to separate intact polar GDGT lipids (IPL GDGTs) from core GDGT lipids (CL GDGTs), it has become possible to use IPLs to trace liv-ing, GDGT-producing bacteria and archaea in the environ-ment (e.g. Pitcher et al., 2009b, 2011b; Lengger et al., 2012; Schouten et al., 2012; Gibson et al., 2013; Buckles et al., 2013). Although there is some discussion as to how quickly IPLs degrade in sediments, especially concerning the less la-bile glycosidic head groups (e.g. Lipp and Hinrichs, 2009; Bauersachs et al., 2010; Schouten et al., 2010; Lennger et al., 2012; Xie et al., 2013), their application in an extant en-vironment to describe current biomass should not be affected (e.g. Pitcher et al., 2011a; Buckles et al., 2013).
A study of Lake Towuti, Indonesia, previously suggested the presence of in situ production within the lake based on differences in brGDGT distribution between soils and sed-iments (Tierney and Russell, 2009). Similarly, a study of brGDGT distributions and concentrations in isolated soil and sediment sampled from a range of Ugandan lakes came to the same conclusion (Loomis et al., 2011). More recently, a detailed modern study of GDGT distributions in the per-manently stratified, partially anoxic Lake Challa (eastern Africa) found that brGDGTs were produced within both the oxic and anoxic water column and found some evi-dence suggestive of their production in sediments (Buck-les et al., 2014). In the case of the small, shallow Sand Pond (RI, USA), it was considered that more highly methy-lated brGDGTs may be produced within the predominantly suboxic sediments (Tierney et al., 2012). However, in the high Alpine Lake Cadagno (Switzerland), no evidence of brGDGT in situ production was found (Niemann et al., 2012).
With few exceptions, the individual lakes that have been studied for their brGDGT content are characterised by one or more of the following properties: located at low latitudes; a relatively restricted catchment area to minimise the influence of soil-derived brGDGTs; and suboxic to anoxic bottom wa-ters (e.g. Tierney and Russell, 2009; Loomis et al., 2011; Nie-mann et al., 2012; Tierney et al., 2012; Buckles et al., 2014). In order to further investigate the apparently widespread pro-duction of brGDGTs in lacustrine environments and its po-tential impact on GDGT-based proxies, it is also necessary to examine temperate lakes with larger catchment areas, rel-atively high soil organic matter inputs and oxygenated wa-ter columns. Loch Lomond is a temperate, monomictic lake, with a large and peat-rich catchment, located near Glasgow (Scotland, UK; Fig. 1). Here, we examined Loch Lomond in detail by analysing the distributions of core and intact GDGT lipids in soils and small tributary streams around the lake, in suspended and sinking particulate matter within the lake and in lake surface sediments. The obtained results fur-ther constrain the sites of brGDGT production in lake sys-tems and provide insight into the abundance of lake-derived brGDGTs relative to soil-derived brGDGTs. With that infor-mation, the potential and limits for application of the MBT– CBT palaeothermometer as well as other GDGT-based prox-ies to lacustrine sediment archives can be better constrained.
2 Methods
2.1 Site characterisation
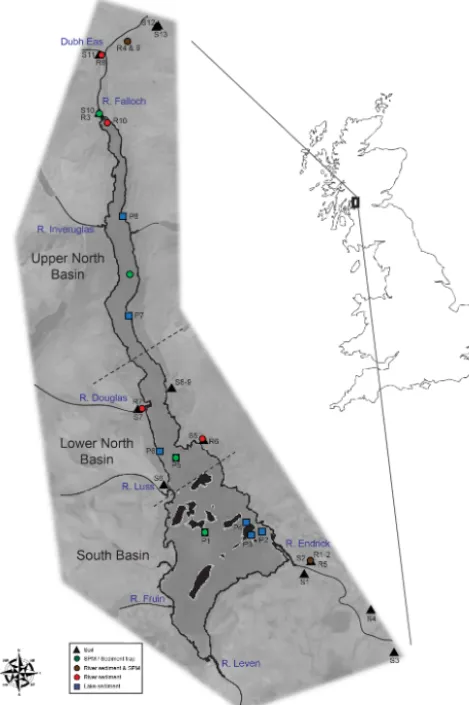
Figure 1. Map of Loch Lomond and coded sample locations (see
Tables 1–5). Black patches in the south basin represent islands; black boxes and their associated labels at the sediment trap and SPM locations (green circles) refer to the sediment collected from the same location. The extent of catchment rivers is represented by smoothed lines.
catchment area of 780 km2(Maitland, 1981). Since the High-land Boundary Fault passes through south Loch Lomond, the lake is split into two distinct basins (e.g. Pierce, 1999). The north and south basins contain different geology, land uses and soil within their catchment areas (Maitland, 1981). The north basin is oligotrophic and fjord-like; it is long (20 km), narrow (max 1.5 km), deep (max 190 m) and has a mountain-ous catchment area (Smith et al., 1981b). Inveruglas Water and the River Falloch are the main rivers draining into the north basin, with a combined catchment of 271 km2; multiple smaller rivers/streams also flow into the north basins, includ-ing Douglas Water. The River Falloch enters Loch Lomond at its northern point and flows from higher-altitude terrain into the lake (Fig. 1). The generally base-poor soils of this catch-ment area include alpine soils and rankers on high ground, peat and peaty gleys at intermediate elevations and
humus-iron podzols can be found on lower ground (Bayfield and Conroy, 1995). In terms of land use, this northern catchment area is dominated by sheep grazing (Eurolakes, 2001), with a far smaller proportion used in forestry. The south basin is mesotrophic, broader (max 8.8 km) and shallow (max 20 m) and contains multiple small islands (Smith et al., 1981a). En-drick Water is the main inflow to the south basin and drains 264 km2of generally base-rich lowlands with large areas of brown forest soils, as well as peaty gleys and podzols found on higher ground (Bayfield and Conroy, 1995). Endrick Wa-ter is a meandering river that flows through relatively low-lying land, carrying silt and other material into the south-east of Loch Lomond, while the River Fruin flows into the south-west of the lake with a smaller catchment of 161 km2. The full south lake catchment is more densely populated (Mait-land, 1981) than the northern catchment and contains more urban development. Around a quarter of this catchment is used as arable farmland and roughly half as rough grazing; a small proportion is also used as forestry (Eurolakes, 2001). The main outflow of Loch Lomond, the River Leven, is also located at the south basin. A barrage is operated on the River Leven outflow; the river is ca. 10 km long and discharges into the River Clyde, south of Loch Lomond (Eurolakes, 2001). As a consequence, the hydrology of the south basin of Loch Lomond is dominated by the throughflow of Endrick Water (Fig. 1). Despite land use differences and the greater influx of nutrients into the south compared to the north basin, the water in the south and north basins are similarly pH neutral (7.0 and 6.9, respectively; Best and Traill, 1994).
The climate at Loch Lomond is cool, windy and wet; the nearby Paisley weather station (ca. 40 km south from Loch Lomond (32 m a.s.l.) measures a mean annual air tempera-ture (MAAT) of 9.5◦C (1980–2010, Fig. 2a) and mean
an-nual precipitation of 1240 mm yr−1 (1980–2010, Fig. 2a). Maximum temperatures generally occur in July (15.9◦C) and minimum temperatures in December and January (4.3◦C). Precipitation is highest in January (146 mm month−1) and lowest in April (62 mm month−1). However, it is important to understand that these climates can vary widely within the Loch Lomond catchment area, due to varying eleva-tions and subclimates (Birse, 1971; Bayfield and Conroy, 1995). For example, annual rainfall varies from a minimum of 1372 mm yr−1 in the south, at Ballindaloch, to a maxi-mum of 3008 mm yr−1 at Inveruglas in the north (Curran and Poodle, 1992). The annual average water temperatures (integrated throughout the water column) are 7.8◦C in the
north basin and 10.3◦C in the south (Mohamad Hamzah,
0 2 4 6 8 10 12 14 16 18
0 20 40 60 80 100 120 140
160 Climate
0 2 4 6 8 10 12 14 16 18
0 50 100 150 200 250
Jan Feb Mar Apr May Jun Jul Aug Sep Oct Nov Dec Weather 2011
Monthly precipitation (mm)
Monthly precipitation (mm)
Average temperature (
o
C)
Average temperature (
o
C)
[image:4.612.47.289.64.360.2]Precipitation Temperature
Figure 2
a
b
Figure 2. (a) Average monthly temperatures and precipitation for
the years 1980–2010 and (b) mean monthly temperatures and pre-cipitation for the year of SPM sampling, 2011, all recorded at the Paisley weather station, ca. 40 km from Loch Lomond and at a 32 m elevation. All data are courtesy of the UK Met Office (http: //www.metoffice.gov.uk/climate/uk/stationdata/paisleydata.txt).
2.2 Sampling
Two sample campaigns were undertaken in March and September 2011 to collect catchment soils, catchment river and stream sediments and lake sediments. Nearly 2 years of settling particles (2005–2006) from the north and south basins were collected from the middle and bottom of the wa-ter columns. Suspended particulate matwa-ter (SPM) from rivers and streams, lake SPM and physicochemical depth profiles of the south, lower north and upper north basins were also analysed. Filtration of SPM took place in the onshore lab-oratories of SCENE within ca. 6 h of sampling; ca. 20 L of river water was filtered per sample through ashed glass fibre filters (Whatmann GF/F; pore size 0.7 µm). All samples were stored frozen until analysis.
2.2.1 Soils
Soils were sampled from within the catchment area of Loch Lomond, from a wide range of elevations ranging from lake level (ca. 8 m) to ca. 180 m elevation to the north of the lake. The 13 soil samples were selected to cover a range of
vege-tation and land use types occurring in the catchment around Loch Lomond. This includes peaty soils, grasslands, forests, fern-covered soils and two waterlogged soils. Grassland was often used to graze cattle. Wherever possible the soils were collected next to rivers/streams, in peaty soils on steep slopes and in areas of localised run-off, as those soils were consid-ered most likely to contribute to GDGTs found in lake sed-iments. The large amount of water percolating through the soil may well carry clay particles with associated GDGTs to these streams. For sampling, any surface vegetation was re-moved and a ca. 10 cm depth interval of soil taken.
2.2.2 Rivers
Four riverine surface sediments and one overbank deposit were sampled (March and September 2011) from five differ-ent rivers and streams, all of which flow into Loch Lomond. With the exception of Endrick Water, all sediments con-sisted of medium to coarse sand, and the samples (ca. 0–5 cm depth) were taken with a trowel from the edge of an unnamed stream in Glen Luss (R6; Fig. 1), Douglas Water, Dubh Eas (a tributary of the River Falloch to the north-west) and below the Falls of Falloch (River Falloch), where the river water was less than 30 cm deep (see Fig. 1 for exact locations). The clay-silt overbank deposit (ca. 0–1 cm depth) was taken from Endrick Water.
SPM was sampled in surface water from Endrick Water in both March and September 2011. In September 2011, surface water SPM was also sampled from the River Falloch: once below the Falls of Falloch and once at the inflow to Loch Lomond in the north basin. River sediment was also collected at these locations.
2.2.3 Lake
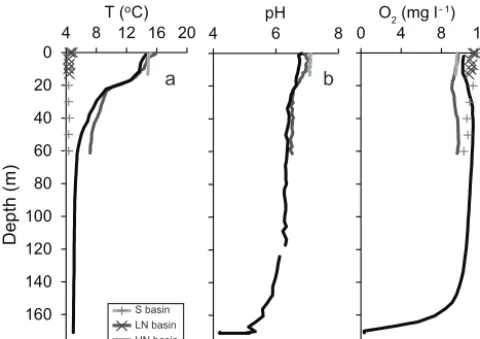
In March, due to rough weather conditions, tempera-ture and dissolved oxygen were measured ex situ with a Hanna HI 991300 portable pH/conductivity/dissolved-oxygen/temperature meter on water collected with a Van Dorn sampler in the south and lower north basin. In the south basin, these measurements were made on water sampled from 0, 4, 7, 10 and 14 m depth and in the lower north basin from 0 to 60 m depth at 10 m intervals. Water was taken in 20 L jerry cans and shipped to shore. In September, weather conditions allowed measurement of temperature, dissolved oxygen and pH of the full water column in the south, lower and upper north basins (Fig. 3b) using a TROLL 9522 wa-ter quality instrument. All measurements were taken at or as near as possible to the sediment traps in each basin (Fig. 1).
4 pH6 8 0 O24 (mg l8 12
- 1)
0 20 40 60 80 100 120 140 160 180
4 8 12 16 20
D
ep
th
(m
)
T (oC)
[image:5.612.47.287.66.235.2]S basin LN basin UN basin
Figure 3
a b c
Figure 3. (a) Temperature, (b) pH and (c) dissolved-oxygen
pro-files measured in September 2011 from the south (S), lower north (LN) and upper north (UN) basins. Additional markers represent data from S and LN basins in March, measured ex situ.
filter apparatus; the filters were subsequently stored frozen. In March, bad weather conditions meant that SPM depth pro-files could be sampled in the lower north basin and south basin only; in September, the full transect was sampled from the upper north to the south basin. In the south basin in March, SPM was sampled in the centre of the basin (ca. 14 m water depth) at five relatively regular intervals: 0, 4, 7, 10 and 13 m depth. In September, SPM was sampled from five regular intervals at 0, 3, 9 and 12 m depth. SPM samples were taken from the centre of the lower north basin (water depth ca. 67 m) from 0 to 60 m depth, at 10 m intervals, in both March and September. In September, water was sam-pled from the upper north basin between 0 and 80 m depth at 20 m intervals. The water depth was estimated at 180 m based on bathymetry; however, equipment did not allow samples to be taken from that depth.
Sediment traps were deployed in the south and middle basins from 13 May 2005 and collected on average every 45 days (between 25 and 63 days) until 8 March 2006, cov-ering 267 days of settling particles. The locations of the two sediment traps are indicated in Fig. 1, at the locations of sedi-ments P1 and P5. Upon collection, the material was stored in a cool box post-collection and refrigerated immediately upon return to shore (<6 h). Excess water was removed by cen-trifugation, and the resulting material was freeze-dried and stored frozen until analysis.
Lake surface sediments were collected in a north–south transect of Loch Lomond, covering a water depth range of 3–70 m (Fig. 1). Samples were collected using an Eckman grab, with an approximate depth range of 0–10 cm. Sedi-ments were stored frozen until analysis.
2.3 GDGT analysis
All soils, sediments, settling particles and GF/F filters were freeze-dried. Large stones and plant matter were removed from soil samples, and between 3 and 12 g were extracted by means of a modified Bligh–Dyer procedure (cf. Pitcher et al., 2011b). Between 11 and 34 g of each river sediment and between 3 and 9 g of each lake sediment were also ex-tracted, as well as ca. 0.1 g of each sample of settling parti-cles. In addition, half of each GF/F filter of lake or river SPM was cut up into small pieces and extracted. Each sample was ultrasonically extracted three times with a solvent mixture of methanol (MeOH) : dichloromethane (DCM) : phosphate buffer at pH 7.4 in the ratio 10:5:4 (v:v:v). Following each extraction, the supernatant was removed and collected; subsequently, through the addition of phosphate buffer and DCM, phase separation was initiated by altering the sol-vent mixture of MeOH : DCM : phosphate buffer to a ratio of 10:10:9 (v:v:v). The aqueous phase that resulted was ex-tracted with DCM three times, and the extract from this pro-cedure was collected. This was rotary-evaporated until nearly dry and filtered through extracted cotton wool into a pre-weighed vial. Half or 25 % of each of these Bligh–Dyer ex-tracts (dependent on the mass of the extract) was separated over a silica gel stationary phase through column chromatog-raphy. The Bligh–Dyer extract was loaded onto the column using hexane : ethyl acetate (1:1,v:v), and the first fraction (CL) was eluted with 5 mL of this solvent. After the collec-tion of the first fraccollec-tion and prior to the elucollec-tion of the sec-ond fraction (IPL), the Bligh–Dyer extract was washed with the second eluent and loaded onto the column. The second fraction was then eluted with 5 mL MeOH. Internal standard (C46glycerol trialkyl glycerol tetraether; GTGT) was added
to each fraction to allow quantification (Huguet et al., 2006), and the fractions were dried under a flow of nitrogen gas. Of each IPL fraction, 10 % was removed and analysed as CL fractions to determine the efficacy of the column separation. The remaining 90 % was refluxed in 1.5 N HCl / MeOH solu-tion for 2 h at 80◦C, followed by an aqueous workup where the pH of the mixture was increased to pH 4–5 and extracted three times with DCM. This extract was then passed through anhydrous Na2SO4columns to remove any remaining water
and dried under nitrogen. This resulted in the acid hydrolysis of the IPL fraction, cleaving the polar head groups from the IPLs to form their CL derivatives and allowing analysis as CLs.
selected ion monitoring (SIM) detection of their [M+H]+
ions and through the use of HP Chemstation software. Dif-ferences in ionisation efficiencies were compensated for by the regular running of a standard mixture of crenarchaeol and the C46GTGT (Huguet et al., 2006).
GDGT distributions were quantified using the following indices (see Fig. A1 for GDGT structures and nomenclature): – The branched vs. isoprenoidal tetratether (BIT) index as
defined by Hopmans et al. (2004): BIT index= [VI]+[VII]+[VIII]
[VI]+[VII]+[VIII]+ [V]; (1) – The MBT’ as defined by Peterse et al. (2012), a slightly modified form of the original MBT index by Weijers et al. (2007) in which brGDGTs VIIIb and VIIIc are omitted:
MBT0= [VI]+[VIb]+ [VIc]
[VI]+[VIb]+[VIc]+[VII]+[VIIb]+[VIIc]+[VIII]; (2)
– The degree of cyclisation (DC) as defined by Sinninghe Damsté et al. (2009):
DC= [VIb]+ [VIIb]
[VI]+ [VIb] +[VII]+ [VIIb]; (3) – The cyclisation ratio of branched tetraethers (CBT) as
defined by Weijers et al. (2007a):
CBT= −log10
[VIb]+ [VIIb]
[VI]+[VII]
; (4)
– and the TEX86as defined by Schouten et al. (2002):
TEX86=
[III]+[IV]+ [V0]
[II]+[III]+[IV]+ [V0]. (5)
The fractional abundance of each individual brGDGT is expressed as
f[GDGTi]= [brGDGTi]
[6brGDGTs], (6)
where f[brGDGTi] represents fractional abundance of an individual brGDGT, [brGDGTi] represents concentration of the individual brGDGT and [6brGDGTs] represents the summed concentration of GDGTs VI(b, c)–VIII(b, c).
The proportion of IPL compared to CL GDGTs is ex-pressed using %IPL, defined as
%IPL=
[IPL]
[IPL]+ [CL]
×100, (7)
where [IPL] represents intact polar lipid concentration and [CL] represents core lipid concentration.
pH estimates were calculated using the soil calibration by Peterse et al. (2012) (Peterse12):
pH=7.90−1.97CBT. (8)
MAAT estimates were also calculated using the Peterse et al. (2012) soil calibration:
MAAT=0.81−5.67CBT+31.0MBT0. (9) Mean summer air temperature (MSAT) estimates were calcu-lated using the lacustrine calibration by Pearson et al. (2011): MSAT=20.9+(98.1×f[VIb])−(12×f[VII]) (10)
−(20.5×f[VIII]).
TEX86lake surface temperature (LST) estimates were
calcu-lated using the lacustrine calibration by Powers et al. (2010):
LST= −14.0+(55.2×TEX86). (11)
TEX86and MBT calibrations subsequently described in the
text are denoted by the first author and year of the publication in which they were first proposed; for example, the MBT– CBT lacustrine calibration described by Pearson et al. (2011) is referred to as Pearson11.
2.4 Statistical analyses
A MANOVA (multivariate analysis of variance) statistical analysis was performed using the R statistical computing programme, available from www.r-project.org, on brGDGT distributions from each sample group, i.e. on the fractional abundances of each brGDGT. Outliers were not removed since they were scrutinised and considered to represent the accurate data of unusual samples rather than errors in com-putation or analysis; however, CL and IPL GDGT VIIIb and VIIIc were excluded from the analysis due to their low abun-dance and zero-inflated values. For individual comparison, the MANOVA analysis was followed by Tukey’s HSD (hon-estly significant difference) procedure for each univariate set of data for which the null hypothesis was rejected, in order to generate multiple comparisons for each GDGT between sample groups. A 90 % confidence level was selected due to the relatively high analytical error in lower abundance sam-ples, particularly for IPL GDGTs.
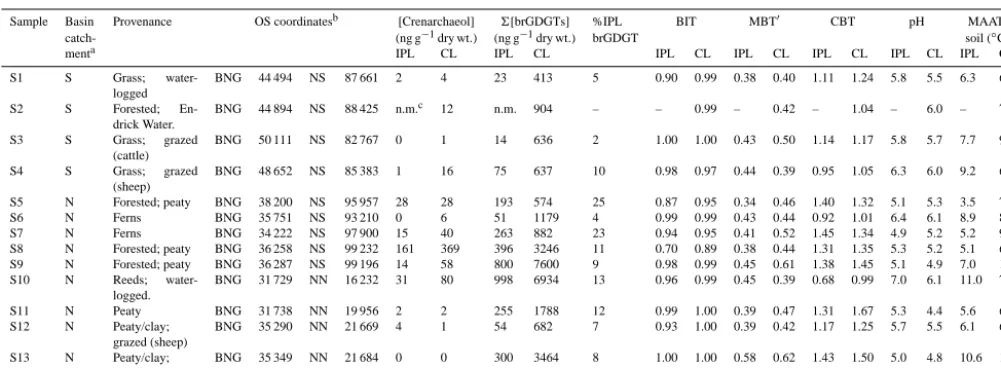
Table 1. Locations and provenance of soils, in conjunction with crenarchaeol concentrations and summed brGDGT concentrations, BIT
indices, MBT0indices, CBT ratios, inferred pH and inferred mean annual air temperatures (MAATs).
Sample Basin Provenance OS coordinatesb [Crenarchaeol] 6[brGDGTs] %IPL BIT MBT0 CBT pH MAAT –
catch- (ng g−1dry wt.) (ng g−1dry wt.) brGDGT soil (◦C)d
menta IPL CL IPL CL IPL CL IPL CL IPL CL IPL CL IPL CL
S1 S Grass; water-logged
BNG 44 494 NS 87 661 2 4 23 413 5 0.90 0.99 0.38 0.40 1.11 1.24 5.8 5.5 6.3 6.2
S2 S Forested; En-drick Water.
BNG 44 894 NS 88 425 n.m.c 12 n.m. 904 – – 0.99 – 0.42 – 1.04 – 6.0 – 7.9
S3 S Grass; grazed (cattle)
BNG 50 111 NS 82 767 0 1 14 636 2 1.00 1.00 0.43 0.50 1.14 1.17 5.8 5.7 7.7 9.8
S4 S Grass; grazed (sheep)
BNG 48 652 NS 85 383 1 16 75 637 10 0.98 0.97 0.44 0.39 0.95 1.05 6.3 6.0 9.2 6.8
S5 N Forested; peaty BNG 38 200 NS 95 957 28 28 193 574 25 0.87 0.95 0.34 0.46 1.40 1.32 5.1 5.3 3.5 7.5 S6 N Ferns BNG 35 751 NS 93 210 0 6 51 1179 4 0.99 0.99 0.43 0.44 0.92 1.01 6.4 6.1 8.9 8.7 S7 N Ferns BNG 34 222 NS 97 900 15 40 263 882 23 0.94 0.95 0.41 0.52 1.45 1.34 4.9 5.2 5.2 9.4 S8 N Forested; peaty BNG 36 258 NS 99 232 161 369 396 3246 11 0.70 0.89 0.38 0.44 1.31 1.35 5.3 5.2 5.1 6.8 S9 N Forested; peaty BNG 36 287 NS 99 196 14 58 800 7600 9 0.98 0.99 0.45 0.61 1.38 1.45 5.1 4.9 7.0 11.4 S10 N Reeds;
water-logged.
BNG 31 729 NN 16 232 31 80 998 6934 13 0.96 0.99 0.45 0.39 0.68 0.99 7.0 6.1 11.0 7.3
S11 N Peaty BNG 31 738 NN 19 956 2 2 255 1788 12 0.99 1.00 0.39 0.47 1.31 1.67 5.3 4.4 5.6 6.0 S12 N Peaty/clay;
grazed (sheep)
BNG 35 290 NN 21 669 4 1 54 682 7 0.93 1.00 0.39 0.42 1.17 1.25 5.7 5.5 6.1 6.9
S13 N Peaty/clay; grazed (sheep)
BNG 35 349 NN 21 684 0 0 300 3464 8 1.00 1.00 0.58 0.62 1.43 1.50 5.0 4.8 10.6 11.7
aS – south catchment, N – north catchment,bOrdnance Survey coordinates,cn.m. – not measured,dPeterse12 calibration (Eq. 9).
3 Results 3.1 Soils
The soils are heterogeneous in nature, showing consider-able variation in GDGT concentrations and distributions (Ta-ble 1). CL concentrations of brGDGTs range over an order of magnitude from 0.4 to 7.6 µg g−1dry weight soil, and IPL brGDGTs concentrations are lower, ranging by 2 orders of magnitude from 0.01 to 1.0 µg g−1dry weight soil. The %IPL
of the brGDGTs, representing the proportion of IPL “liv-ing” vs. CL ‘fossil’ GDGTs, ranges from 2 to 25 % but does not appear to be related to the type of soil. Generally, peaty soils contain the highest concentrations of brGDGTs. Cre-narchaeol concentrations are universally low, ranging from
<0.05 µg g−1dry weight soil (CL and IPL) to maxima of 0.2 and 0.4 µg g−1dry weight soil (IPL and CL, respectively).
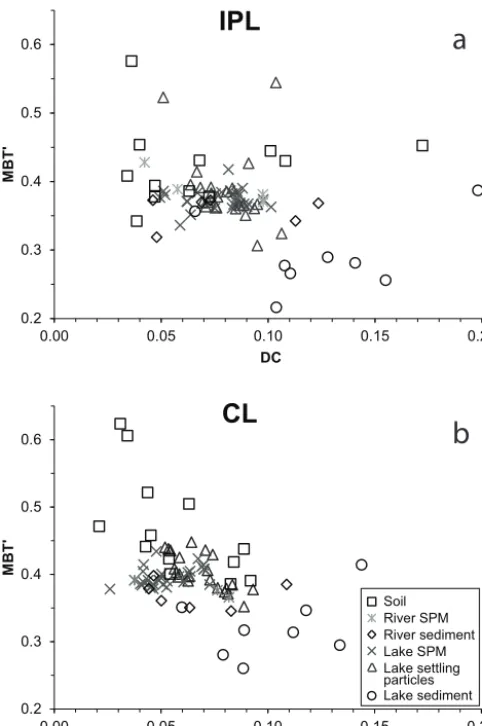
BIT indices are universally high (Table 1). CL BIT in-dices do not reach below 0.95, and IPL BIT inin-dices gener-ally not reach below 0.90, with one notable exception: S8 shows BIT indices of 0.89 and 0.70 for CL and IPL, respec-tively. BrGDGT distributions show some scatter, as is evi-dent from a provenance plot of MBT’ vs. DC (Fig. 4a, b). In this plot DC values (linearly related to the number of cy-clopentane moieties of brGDGTs) are plotted in lieu of (log-arithmic) CBT because the parameter for degree of methy-lation, MBT’, is also linearly related. BrGDGT distributions are similar in IPL and CL brGDGTs (Fig. 5a, b). Both IPL and CL MBT’ and DC/CBT indices range substantially. The lowest MBT’ indices are 0.34 and 0.39 (IPL and CL, respec-tively), and the highest are 0.58 and 0.62 (IPL and CL). CBT indices vary from 0.68 to 1.45 (IPL) and from 0.99 to 1.67 (CL). IPL and CL MBT’ values in soils are relatively weakly
correlated (r2=0.34), although IPL and CL CBT values are more highly correlated (r2=0.69). The soil with low-est CL and IPL CBT values originates from a waterlogged river bank.
3.2 River 3.2.1 SPM
Concentrations of IPL and CL brGDGTs in SPM filtered from the surface waters of the River Falloch in the north catchment of Loch Lomond are constant at the Falls of Fal-loch and the mouth of the river at ca. 6 ng L−1 (IPL) and ca. 65 ng L−1(CL) (Table 2). Concentrations of IPL and CL brGDGTs in Endrick Water in the south catchment were in September (IPL: 11; CL: 117 ng L−1) higher than dou-ble those in March (IPL: 4; CL: 51 ng L−1). The %IPL of brGDGTs ranges between 7 and 9 % for all river SPM. Cre-narchaeol concentrations are generally low; IPL creCre-narchaeol is<1 ng L−1, and CL crenarchaeol is<2 ng L−1(Table 2).
Table 2. Suspended particulate matter (SPM) from river and lake water: crenarchaeol and summed brGDGT concentrations, MBT0indices, CBT ratios, BIT indices, TEX86indices, inferred mean annual air temperatures (MAATs), inferred mean summer air temperatures (MSATs) and inferred lake surface temperatures (LSTs).
Sample SPM Basina OS coordinatesb Water Month Depth [Crenarchaeol] 6[brGDGTs] %IPL BIT MBT0 CBT MAAT – MSAT – TEX
86f LST (◦C)e
name type depth (ng L−1) (ng L−1) brGDGT soil (◦C)c lake (◦C)d
(m) (m) IPL CL IPL CL IPL CL IPL CL IPL CL IPL CL IPL CL IPL CL IPL CL R1 River S BNG 44 894 NS 88 425 2 Mar 0 0.2 1.1 3.8 50.7 0.94 0.98 0.37 0.37 0.97 1.05 6.8 6.2 17.1 16.0 n.c.f n.c. n.c. n.c.
R2 River S BNG 44 894 NS 88 425 2 Sep 0 0.7 1.9 11.4 117 9 0.94 0.98 0.38 0.38 0.97 1.08 7.1 6.3 17.4 16.0 n.c. n.c. n.c. n.c. R3 River UN BNG 31 729 NN 16 232 1 Sep 0 0.1 0.6 6.4 69.3 8 0.99 0.99 0.43 0.39 1.36 1.41 6.4 5.0 15.4 14.5 n.c. n.c. n.c. n.c. R4 River UN BNG 33 495 NN 20 762 <0.5 Sep 0 0.2 0.6 5.7 62.7 8 0.97 0.99 0.39 0.39 1.21 1.41 6.0 5.0 15.4 14.3 n.c. n.c. n.c. n.c. LL2f Lake S BNG 38 315 NS 90 165 15.4 Mar 0 0.1 1.0 1.1 9.0 11 0.87 0.90 0.39 0.39 1.03 1.19 6.9 6.1 16.6 15.4 0.58 0.51 17.9 14.3 LL3f Lake S BNG 38 315 NS 90 165 15.4 Mar 4 0.3 1.1 2.2 11.1 17 0.87 0.91 0.37 0.40 1.00 1.21 6.5 6.3 16.5 15.3 0.58 0.52 17.8 14.4 LL4f Lake S BNG 38 315 NS 90 165 15.4 Mar 7 0.1 0.9 0.8 11.3 6 0.87 0.92 0.42 0.40 1.05 1.17 7.8 6.7 16.9 15.7 0.56 0.52 17.0 14.5 LL5f Lake S BNG 38 315 NS 90 165 15.4 Mar 10 0.1 1.1 1.4 11.6 11 0.89 0.91 0.38 0.40 1.03 1.18 6.6 6.6 16.5 15.7 0.58 0.51 18.3 13.9 LL6f Lake S BNG 38 315 NS 90 165 15.4 Mar 13 0.2 1.0 1.1 10.4 10 0.87 0.91 0.37 0.40 1.02 1.17 6.4 6.5 16.1 15.7 0.57 0.51 17.6 14.0 LW14 Lake S BNG 38 315 NS 90 165 12.4 Sep 0 0.0 0.2 0.8 6.6 11 0.94 0.96 0.36 0.42 1.00 1.14 6.4 7.5 16.1 16.1 0.55 0.53 16.5 15.3 LW15 Lake S BNG 38 315 NS 90 165 12.4 Sep 3 0.1 1.0 0.4 5.4 8 0.86 0.84 0.38 0.39 1.26 1.34 5.5 5.4 14.7 14.4 0.53 0.45 15.5 10.8 LW16 Lake S BNG 38 315 NS 90 165 12.4 Sep 6 0.0 0.2 0.5 4.6 10 0.94 0.96 0.37 0.41 1.01 1.13 6.5 7.2 15.8 15.9 0.56 0.52 17.0 14.6 LW17 Lake S BNG 38 315 NS 90 165 12.4 Sep 9 0.0 0.2 0.7 4.9 13 0.95 0.96 0.39 0.41 1.02 1.12 7.1 7.3 16.7 16.0 0.55 0.50 16.3 13.6 LW18 Lake S BNG 38 315 NS 90 165 12.4 Sep 12 0.0 0.2 0.6 5.9 9 0.93 0.96 0.37 0.41 0.96 1.12 6.9 7.1 17.0 16.0 0.55 0.52 16.2 14.8 LL7f Lake LN BNG 36 538 NS 94 789 67.5 Mar 0 0.2 1.9 0.8 8.2 9 0.79 0.80 0.37 0.39 1.04 1.29 6.3 5.6 16.0 14.8 0.58 0.45 18.0 10.7 LL8f Lake LN BNG 36 538 NS 94 789 67.5 Mar 10 0.6 3.6 1.2 14.0 8 0.67 0.78 0.38 0.39 1.04 1.25 6.8 5.8 16.7 14.9 0.54 0.44 15.8 10.1 LL9f Lake LN BNG 36 538 NS 94 789 67.5 Mar 20 0.3 1.9 0.9 7.8 10 0.74 0.80 0.37 0.39 1.03 1.29 6.5 5.6 16.4 14.8 0.55 0.45 16.5 10.6 LL10f Lake LN BNG 36 538 NS 94 789 67.5 Mar 30 0.3 2.5 0.8 10.7 7 0.75 0.80 0.37 0.38 1.02 1.27 6.4 5.5 16.6 14.8 0.55 0.47 16.2 11.9 LL11f Lake LN BNG 36 538 NS 94 789 67.5 Mar 40 0.3 2.9 1.0 10.2 9 0.76 0.77 0.38 0.38 1.09 1.25 6.5 5.5 15.4 14.8 0.55 0.46 16.1 11.4 LL12f Lake LN BNG 36 538 NS 94 789 67.5 Mar 50 0.4 2.4 1.1 10.0 10 0.71 0.80 0.38 0.40 1.02 1.28 6.8 6.0 16.6 15.0 0.54 0.44 15.7 10.5 LL13f Lake LN BNG 36 538 NS 94 789 67.5 Mar 60 0.4 2.4 1.1 10.2 10 0.72 0.80 0.38 0.40 1.03 1.28 6.8 5.8 16.6 14.9 0.55 0.43 16.2 9.9 LW19 Lake LN BNG 36 538 NS 94 789 66.4 Sep 0 0.1 0.3 0.7 5.8 11 0.88 0.94 0.38 0.43 1.14 1.30 6.2 6.9 15.7 15.5 0.56 0.52 17.0 14.6 LW20 Lake LN BNG 36 538 NS 94 789 66.4 Sep 10 0.0 0.8 0.1 9.3 1 0.89 0.92 0.35 0.41 1.17 1.36 5.1 6.0 15.0 14.8 0.59 0.50 18.7 13.8 LW21 Lake LN BNG 36 538 NS 94 789 66.4 Sep 20 0.0 1.5 0.0 6.1 1 0.74 0.79 0.38 0.40 1.28 1.36 5.2 5.6 15.5 14.7 0.51 0.42 14.2 9.3 LW22 Lake LN BNG 36 538 NS 94 789 66.4 Sep 30 0.1 4.7 0.1 7.3 1 0.52 0.60 0.36 0.39 1.09 1.31 5.8 5.3 15.2 14.3 0.44 0.38 10.3 7.1 LW23 Lake LN BNG 36 538 NS 94 789 66.4 Sep 40 0.4 3.7 0.6 5.2 11 0.57 0.57 0.37 0.38 1.12 1.33 6.0 5.1 15.2 14.1 0.46 0.37 11.5 6.2 LW24 Lake LN BNG 36 538 NS 94 789 66.4 Sep 50 0.6 6.0 1.1 8.5 12 0.63 0.57 0.38 0.38 1.07 1.32 6.6 5.2 15.8 14.3 0.45 0.38 11.1 7.0 LW25 Lake LN BNG 36 538 NS 94 789 66.4 Sep 60 0.0 6.3 0.1 8.9 1 0.66 0.57 0.39 0.38 1.05 1.31 6.9 5.1 16.1 14.2 0.49 0.39 12.9 7.5 LL33 Lake UN BNG 33 618 NN 06 243 180 Sep 0 0.0 0.4 0.6 7.6 8 0.94 0.95 0.39 0.38 1.27 1.57 5.6 3.6 15.0 14.1 0.53 0.50 15.4 13.6 LL34 Lake UN BNG 33 618 NN 06 243 180 Sep 20 0.0 0.3 0.8 7.1 10 0.95 0.96 0.36 0.41 1.04 1.12 6.1 7.1 15.7 16.0 0.54 0.55 15.9 16.2 LL35 Lake UN BNG 33 618 NN 06 243 180 Sep 40 0.1 2.1 0.7 7.3 9 0.82 0.77 0.34 0.39 1.20 1.36 4.4 5.1 14.5 14.4 0.55 0.40 16.5 8.1 LL36 Lake UN BNG 33 618 NN 06 243 180 Sep 60 0.1 1.9 0.5 6.4 7 0.80 0.76 0.37 0.38 1.18 1.37 5.6 5.0 15.1 14.2 0.49 0.41 13.1 8.4 LL37 Lake UN BNG 33 618 NN 06 243 180 Sep 80 0.2 1.8 0.9 6.6 12 0.84 0.78 0.37 0.39 1.18 1.38 5.6 5.0 15.1 14.3 0.53 0.40 15.2 8.4
aS – south, LN – ,lower north, UN – upper north,bOrdnance Survey coordinates,cPeterse12 calibration (Eq. 9),dPearson11 calibration (Eq. 10),ePowers11 calibration (Eq. 11),fn.c. – not calculated; TEX86values and lake surface temperature (LST) estimates are included where the CL BIT index≤0.6.
Table 3. River sediment data: crenarchaeol and summed brGDGT concentrations, BIT indices, MBT0indices, CBT ratios, inferred mean annual air temperatures (MAATs) and inferred mean summer air temperatures (MSATs).
Sample Sample Basina River OS coordinatesb [Crenarch- 6[brGDGTs] %IPL BIT MBT0 CBT MAAT – MSAT –
name type aeol] (ng g−1) (ng g−1) brGDGT soil (◦C)c lake (◦C)d IPL CL IPL CL IPL CL IPL CL IPL CL IPL CL IPL CL
R5 Overbank S Endrick BNG 44 894 NS 88 425 6 8 77 443 15 0.92 0.98 0.37 0.38 0.85 0.91 7.4 7.6 18.4 17.8 deposit Water
R6 Sediment LN Luss BNG 38 199 NS 95 959 1 2 8 108 7 0.87 0.98 0.34 0.35 0.90 1.04 6.4 5.6 17.4 15.7 Water
R7 Sediment LN Douglas BNG 34 454 NS 97 931 1 1 8 30 20 0.84 0.97 0.37 0.35 1.10 1.17 6.1 5.1 15.8 14.8 Water
R8 Sediment UN Dubh Eas BNG 31 892 NN 19 879 1 2 22 116 16 0.94 0.98 0.37 0.38 1.13 1.33 5.9 5.0 16.3 14.8 R9 Sediment UN Falls BNG 33 495 NN 20 762 1 2 22 95 19 0.94 0.98 0.32 0.36 1.30 1.28 3.3 4.8 14.1 14.2
of Falloch
R10 Sediment UN LL inflow BNG 32 296 NN 15 654 0 3 93 791 11 1.00 1.00 0.37 0.40 1.32 1.31 4.9 5.7 14.9 15.3
aS – south, LN – lower north, UN – upper north,bOrdnance Survey
coordinates,cPeterse12 calibration (Eq. 9),dPearson11 calibration (Eq. 10).
3.2.2 Sediment
River sediments contain 8 to 93 ng g−1dry weight sediment IPL brGDGTs and 30 to 790 ng g−1dry weight sediment CL
brGDGTs (Table 3). The %IPL of brGDGTs ranges between 7 and 19 %. Crenarchaeol concentrations are low for both IPLs (0 to 6 ng g−1)and CLs (1 to 8 ng g−1). BIT indices are generally higher in CL than IPL GDGTs, ranging from 0.84 to 1.00 (IPL) and 0.97 to 1.00 (CL). IPL and CL brGDGT distributions are similar (Fig. 5e, f), resulting in only small variations in MBT’ and CBT/DC (Fig. 4a, b). MBT’ values are similar between IPL and CL brGDGTs and between dif-ferent river sediments, ranging from 0.32 to 0.37 (IPL) and
0.35 to 0.40 (CL) (Table 3). On the other hand, CBT ratios are lowest in River Endrick sediment in the south basin (IPL: 0.85; CL: 0.91), higher in rivers and streams flowing into the lower north basin (mean values of IPL: 1.00; CL: 1.11) and highest in rivers and streams flowing into the upper north basin (mean values of IPL: 1.25; CL: 1.31).
3.3 Lake
3.3.1 Water column
[image:8.612.49.546.412.517.2]Figure 4
0.2 0.3 0.4 0.5 0.6
0.00 0.05 0.10 0.15 0.20
M
B
T'
DC
CL
0.20.3 0.4 0.5 0.6
0.00 0.05 0.10 0.15 0.20
M
B
T'
DC
IPL
a
b
Lake SPM River SPM River sediment Soil
Lake sediment Lake settling particles
Figure 4. Cross-plots of MBT’ vs. DC of (a) IPL and (b) CL
brGDGT lipids showing the differences in distribution between the sample groups.
in March show a fully mixed water column (Fig. 3a). In the south basin, the full water column is at a temperature of ca. 4.5◦C. Dissolved-oxygen concentrations were found to be ca. 10.5 mg L−1(Fig. 3c), meaning that the water column is fully oxygenated. The lower north basin shows slightly higher temperatures at the surface (5.2◦C) compared with average temperatures of 4.3◦C at and below 20 m depth. However, this small difference does not represent a strong, seasonal thermocline. The water column is fully oxygenated with dissolved-oxygen concentrations of ca. 10.8 mg L−1.
The year 2011 was reasonably average in terms of weather (Fig. 2b), so these conditions are likely representative of con-ditions in the water column during these months.
In September, the south basin is again fully mixed at a temperature of ca. 15◦C (Fig. 3a). Dissolved-oxygen con-centrations are also relatively constant, with an average of 9.5 mg L−1 (Fig. 3b), and the pH is relatively constant (7.0 to 7.1) throughout the water column (Fig. 3c). The lower north basin is thermally stratified in September with the
ther-mocline at around 15 m depth; above the therther-mocline, wa-ter temperatures are around 14◦C, and below the
thermo-cline the water is at ca. 8◦C (Fig. 3a). Dissolved oxygen is,
however, relatively constant (ca. 9.5 mg L−1; Fig. 3b), mean-ing that the water column remains fully oxygenated. The pH gradient follows the thermocline (Fig. 3c); the pH is ca. 7.0 above and ca. 6.5 below the thermocline. The upper north basin has a thermocline at ca. 20 m depth (Fig. 3a), where temperatures above the thermocline are ca. 14◦C and drop to ca. 5◦C in bottom waters. Dissolved-oxygen concentra-tions range from 9.4 to 10.7 mg L−1 down to 130 m depth (Fig. 3b), at which point concentrations begin to drop pre-cipitously to reach near-zero values at the sediment (171 m depth). The measured pH is ca. 6.7 at the surface and drops slowly to 6.3 (Fig. 3c). At around 115 m depth, the pH be-gins to further decrease to ca. 5.2 at around 170 m depth just above the sediment.
3.3.2 SPM
In the south basin, March brGDGT concentrations in lake SPM are relatively constant throughout the water column, varying from 0.8 to 2.2 ng L−1(IPL) and 9.0 to 11.6 ng L−1 (CL; Table 2). In September, south basin brGDGT concen-trations are similarly constant but are slightly lower, rang-ing from 0 to 1 ng L−1 (IPL) and 5 to 7 ng L−1 (CL). The %IPL of brGDGTs ranges between 6 and 17 %. Crenarchaeol concentrations are low in both March and September, at ca. 0.05 ng L−1 (IPL) and ranging from 0.2 to 1 ng L−1 (CL). IPL TEX86indices are relatively constant, ranging from 0.56
to 0.58 and 0.53 to 0.55 in March and September, respec-tively. CL TEX86 indices are slightly lower but still
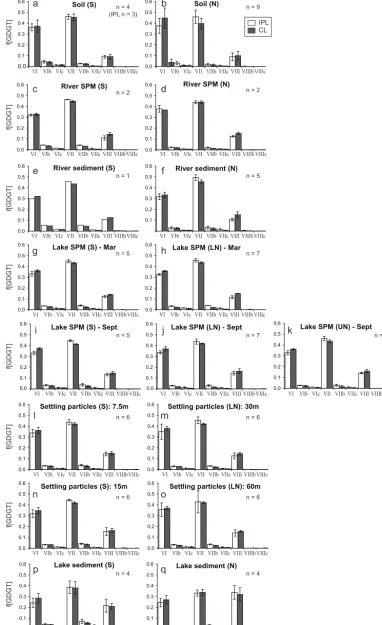
rela-tively invariable with depth in March, ranging from 0.51 to 0.52, but vary slightly more in September, from 0.45 to 0.53. CL BIT indices are marginally lower in March compared with September (0.91 vs. 0.94, respectively, for CL); IPL BIT indices show the same trend though with slightly lower values (0.88 vs. 0.92; March and September, respectively). BrGDGT distributions do not vary widely with depth or sea-son of sampling; MBT’ values are quite constant for both March and September and for both IPL and CL brGDGTs, ranging between 0.36 and 0.42 in IPL and 0.39 and 0.42 in CL brGDGTs. CBT values derived from IPL brGDGTs are generally lower than those from CL brGDGTs, and the March and September profiles yield similar values, i.e. ca. 1.04 (IPL) and 1.17 (CL).
0.0 0.1 0.2 0.3 0.4 0.5 0.6 0.0 0.1 0.2 0.3 0.4 0.5 0.6 0.0 0.1 0.2 0.3 0.4 0.5 0.6 0.0 0.1 0.2 0.3 0.4 0.5 0.6 0.0 0.1 0.2 0.3 0.4 0.5 0.6 0.1 0.2 0.3 0.4 0.5 0.6 0.0 0.1 0.2 0.3 0.4 0.5 0.6 0.0 0.1 0.2 0.3 0.4 0.5 0.6 0.1 0.2 0.3 0.4 0.5 0.6 0.1 0.2 0.3 0.4 0.5 0.6 0.0 0.1 0.2 0.3 0.4 0.5 0.6 0.0 0.1 0.2 0.3 0.4 0.5 0.6 0.0 0.1 0.2 0.3 0.4 0.5 0.6 0.0 0.1 0.2 0.3 0.4 0.5 0.6 0.0 0.1 0.2 0.3 0.4 0.5 0.6 0.0 0.1 0.2 0.3 0.4 0.5 0.6 0.1 0.2 0.3 0.4 0.5 0.6 0.0 0.0
Soil (S) n = 4 Soil (N)
(IPL n = 3) n = 9
River SPM (S) River SPM (N)
n = 2 n = 2
River sediment (S) River sediment (N)
n = 1 n = 5
Lake SPM (S) - Mar Lake SPM (LN) - Mar
n = 5 n = 7
Lake SPM (UN) - Sept Lake SPM (S) - Sept Lake SPM (LN) - Sept
n = 5 n = 7 n = 5
Settling particles (S): 7.5m Settling particles (LN): 30m
n = 6 n = 6
Settling particles (S): 15m Settling particles (LN): 60m
n = 6 n = 6
Lake sediment (S) Lake sediment (N)
n = 4 n = 4
[image:10.612.105.488.69.695.2]IPL CL
Figure 5
VI VIb VIc VII VIIb VIIc VIII VIIIbVIIIc
VI VIb VIc VII VIIb VIIc VIII VIIIbVIIIc
VI VIb VIc VII VIIb VIIc VIII VIIIbVIIIc
VI VIb VIc VII VIIb VIIc VIII VIIIbVIIIc
VI VIb VIc VII VIIb VIIc VIII VIIIbVIIIc VI VIb VIc VII VIIb VIIc VIII VIIIbVIIIc
VI VIb VIc VII VIIb VIIc VIII VIIIbVIIIc VI VIb VIc VII VIIb VIIc VIII VIIIbVIIIc
VI VIb VIc VII VIIb VIIc VIII VIIIbVIIIc VI VIb VIc VII VIIb VIIc VIII VIIIbVIIIc VI VIb VIc VII VIIb VIIc VIII VIIIbVIIIc
VI VIb VIc VII VIIb VIIc VIII VIIIbVIIIc VI VIb VIc VII VIIb VIIc VIII VIIIbVIIIc
VI VIb VIc VII VIIb VIIc VIII VIIIbVIIIc VI VIb VIc VII VIIb VIIc VIII VIIIbVIIIc
VI VIb VIc VII VIIb VIIc VIII VIIIbVIIIc VI VIb VIc VII VIIb VIIc VIII VIIIbVIIIc
a b
c d
e f
g h
i j k
l m n o p q f[GDGT] f[GDGT] f[GDGT] f[GDGT] f[GDGT] f[GDGT] f[GDGT] f[GDGT]
Figure 5. Bar plots (a–q) representing averaged IPL and CL brGDGT distributions in sample groups by basin and, in the case of settling
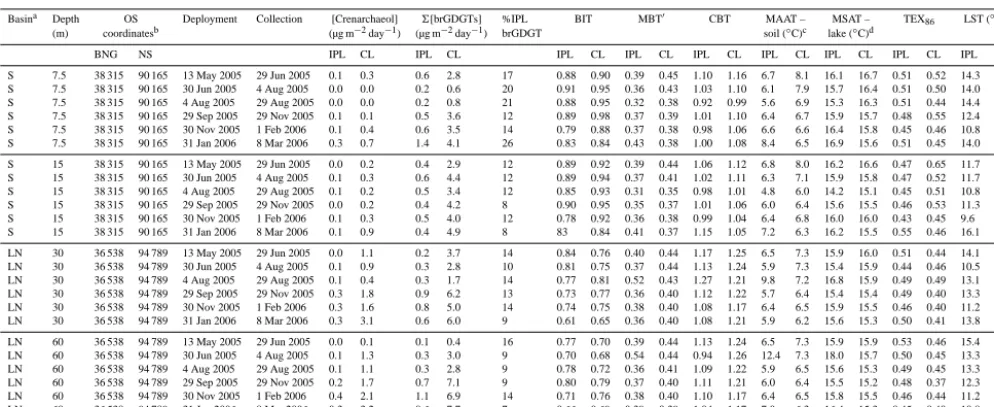
Table 4. Settling particles data from sediment trap deployments from 13 May 2005 to 8 March 2006 from the middle and bottom of the
water column: crenarchaeol fluxes and brGDGT fluxes and BIT indices, MBT0indices, CBT ratios, TEX86indices, inferred mean annual air temperatures (MAATs), inferred mean summer air temperatures (MSATs) and inferred lake surface temperatures (LSTs).
Basina Depth OS Deployment Collection [Crenarchaeol] 6[brGDGTs] %IPL BIT MBT0 CBT MAAT – MSAT – TEX
86 LST (◦C)e
(m) coordinatesb (µg m−2day−1) (µg m−2day−1) brGDGT soil (◦C)c lake (◦C)d
BNG NS IPL CL IPL CL IPL CL IPL CL IPL CL IPL CL IPL CL IPL CL IPL CL
S 7.5 38 315 90 165 13 May 2005 29 Jun 2005 0.1 0.3 0.6 2.8 17 0.88 0.90 0.39 0.45 1.10 1.16 6.7 8.1 16.1 16.7 0.51 0.52 14.3 14.9 S 7.5 38 315 90 165 30 Jun 2005 4 Aug 2005 0.0 0.0 0.2 0.6 20 0.91 0.95 0.36 0.43 1.03 1.10 6.1 7.9 15.7 16.4 0.51 0.50 14.0 13.5 S 7.5 38 315 90 165 4 Aug 2005 29 Aug 2005 0.0 0.0 0.2 0.8 21 0.88 0.95 0.32 0.38 0.92 0.99 5.6 6.9 15.3 16.3 0.51 0.44 14.4 10.6 S 7.5 38 315 90 165 29 Sep 2005 29 Nov 2005 0.1 0.1 0.5 3.6 12 0.89 0.98 0.37 0.39 1.01 1.10 6.4 6.7 15.9 15.7 0.48 0.55 12.4 16.6 S 7.5 38 315 90 165 30 Nov 2005 1 Feb 2006 0.1 0.4 0.6 3.5 14 0.79 0.88 0.37 0.38 0.98 1.06 6.6 6.6 16.4 15.8 0.45 0.46 10.8 11.3 S 7.5 38 315 90 165 31 Jan 2006 8 Mar 2006 0.3 0.7 1.4 4.1 26 0.83 0.84 0.43 0.38 1.00 1.08 8.4 6.5 16.9 15.6 0.51 0.45 14.0 11.0
S 15 38 315 90 165 13 May 2005 29 Jun 2005 0.0 0.2 0.4 2.9 12 0.89 0.92 0.39 0.44 1.06 1.12 6.8 8.0 16.2 16.6 0.47 0.65 11.7 22.1 S 15 38 315 90 165 30 Jun 2005 4 Aug 2005 0.1 0.3 0.6 4.4 12 0.89 0.94 0.37 0.41 1.02 1.11 6.3 7.1 15.9 15.8 0.47 0.52 11.7 14.7 S 15 38 315 90 165 4 Aug 2005 29 Aug 2005 0.1 0.2 0.5 3.4 12 0.85 0.93 0.31 0.35 0.98 1.01 4.8 6.0 14.2 15.1 0.45 0.51 10.8 14.2 S 15 38 315 90 165 29 Sep 2005 29 Nov 2005 0.0 0.2 0.4 4.2 8 0.90 0.95 0.35 0.37 1.01 1.06 6.0 6.4 15.6 15.5 0.46 0.53 11.3 15.3 S 15 38 315 90 165 30 Nov 2005 1 Feb 2006 0.1 0.3 0.5 4.0 12 0.78 0.92 0.36 0.38 0.99 1.04 6.4 6.8 16.0 16.0 0.43 0.45 9.6 11.1 S 15 38 315 90 165 31 Jan 2006 8 Mar 2006 0.1 0.9 0.4 4.9 8 83 0.84 0.41 0.37 1.15 1.05 7.2 6.3 16.2 15.5 0.55 0.46 16.1 11.1
LN 30 36 538 94 789 13 May 2005 29 Jun 2005 0.0 1.1 0.2 3.7 14 0.84 0.76 0.40 0.44 1.17 1.25 6.5 7.3 15.9 16.0 0.51 0.44 14.1 10.2 LN 30 36 538 94 789 30 Jun 2005 4 Aug 2005 0.1 0.9 0.3 2.8 10 0.81 0.75 0.37 0.44 1.13 1.24 5.9 7.3 15.4 15.9 0.44 0.46 10.5 11.2 LN 30 36 538 94 789 4 Aug 2005 29 Aug 2005 0.1 0.4 0.3 1.7 14 0.77 0.81 0.52 0.43 1.27 1.21 9.8 7.2 16.8 15.9 0.49 0.49 13.1 13.2 LN 30 36 538 94 789 29 Sep 2005 29 Nov 2005 0.3 1.8 0.9 6.2 13 0.73 0.77 0.36 0.40 1.12 1.22 5.7 6.4 15.4 15.4 0.49 0.40 13.3 8.3 LN 30 36 538 94 789 30 Nov 2005 1 Feb 2006 0.3 1.6 0.8 5.0 14 0.74 0.75 0.38 0.40 1.08 1.17 6.4 6.5 15.9 15.5 0.46 0.40 11.2 8.3 LN 30 36 538 94 789 31 Jan 2006 8 Mar 2006 0.3 3.1 0.6 6.0 9 0.61 0.65 0.36 0.40 1.08 1.21 5.9 6.2 15.6 15.3 0.50 0.41 13.8 8.7
LN 60 36 538 94 789 13 May 2005 29 Jun 2005 0.0 0.1 0.1 0.4 16 0.77 0.70 0.39 0.44 1.13 1.24 6.5 7.3 15.9 15.9 0.53 0.46 15.4 11.3 LN 60 36 538 94 789 30 Jun 2005 4 Aug 2005 0.1 1.3 0.3 3.0 9 0.70 0.68 0.54 0.44 0.94 1.26 12.4 7.3 18.0 15.7 0.50 0.45 13.3 10.8 LN 60 36 538 94 789 4 Aug 2005 29 Aug 2005 0.1 1.1 0.3 2.8 9 0.78 0.72 0.36 0.41 1.09 1.22 5.9 6.5 15.6 15.3 0.49 0.45 13.3 11.0 LN 60 36 538 94 789 29 Sep 2005 29 Nov 2005 0.2 1.7 0.7 7.1 9 0.80 0.79 0.37 0.40 1.11 1.21 6.0 6.4 15.5 15.2 0.48 0.37 12.3 6.4 LN 60 36 538 94 789 30 Nov 2005 1 Feb 2006 0.4 2.1 1.1 6.9 14 0.71 0.76 0.38 0.40 1.10 1.17 6.4 6.5 15.8 15.5 0.46 0.44 11.2 10.0 LN 60 36 538 94 789 31 Jan 2006 8 Mar 2006 0.3 3.2 0.6 7.7 7 0.66 0.69 0.39 0.39 1.04 1.17 7.0 6.3 16.4 15.3 0.45 0.40 10.8 8.2
aS – south, LN – lower north, UN – upper north,bOrdnance Survey coordinates,cPeterse12 calibration (Eq. 9),dPearson11 calibration (Eq. 10),ePowers11 calibration (Eq. 11).
(IPL) and 6 ng L−1(CL) near the bottom. IPL TEX86indices
range from 0.54 to 0.58 in March but vary more widely in September, from 0.44 to 0.59 (Fig. 8). CL TEX86indices are
generally lower (March: 0.43–0.47; September: 0.37–0.52). In September, both IPL and CL BIT indices decrease accord-ingly with depth. IPL BIT indices reach a minimum of 0.52 at 30 m depth, and CL BIT indices are at their lowest (0.57) from 40 to 60 m depth. BrGDGT distributions do not vary widely with depth or season of sampling, so there is little scatter in MBT’ and CBT/DC between March and Septem-ber and between basins (Fig. 4a, b). IPL and CL brGDGT dis-tributions are similar (Fig. 5g–k) and MBT’ indices are com-paratively constant throughout the profiles in both March and September, ranging between 0.35 and 0.39 in IPL brGDGTs and between 0.38 and 0.43 in CL brGDGTs. IPL and CL CBT indices are also relatively stable at ca. 1.1 (IPL) and 1.3 (CL).
In the upper north basin, SPM data are only available for September. BrGDGT concentrations show little variation with depth, at 1 ng L−1(IPL) and ranging from 6 to 8 ng L−1 (CL; Table 2). The %IPL of brGDGTs is also fairly con-stant, between 7 and 12 %. CL crenarchaeol concentrations increase with increasing depth, from less than 0.5 ng L−1up to ca. 2 ng L−1 from 40 to 80 m depth, while IPL crenar-chaeol rises slightly to just over 0 ng L−1below 20 m depth.
TEX86values range from 0.49 to 0.55 (IPL) and from 0.40
to 0.55 (CL). Both IPL and CL BIT indices decrease from ca. 0.95 in the top 20 m to 0.82 (IPL) and 0.77 (CL) at 40 m depth and remain low down to 80 m depth. BrGDGT distri-butions do not vary widely with season of sampling or basin (Fig. 5g–k); MBT’ indices are constant in both IPL and CL
brGDGTs at around 0.39, although IPL and CL CBT ratios are notably higher in surface waters (IPL: 1.27; CL: 1.57) compared with 20 m depth and below (IPL: 1.15; CL: 1.31). 3.3.3 Settling particles
Fluxes of IPL brGDGTs contained in settling particles at 7.5 m depth in the south basin vary between 0.2 and 0.6 µg m−2yr−1 over most of the year and show a slightly
higher value of 1.4 µg m−2yr−1in late winter. At 15 m depth, just above the sediment, these fluxes are generally constant and range from 0.4 to 0.6 µg m−2yr−1 (Table 4). Fluxes of CL brGDGTs are higher than IPL brGDGTs, ranging from 0.6 to 4.1 µg m−2yr−1 at 7.5 m depth and reaching max-imum values in late winter and minmax-imum values in sum-mer. At 15 m depth, fluxes range from 2.9 to 4.9 µg m−2yr−1 and show a dampened seasonal variation compared with those at 7.5 m depth. In the lower north basin, fluxes of IPL brGDGTs are between 0.2 and 0.9 µg m−2yr−1at 30 m depth and between 0.1 and 1.1 µg m−2yr−1 at 60 m depth, just above the sediment. Fluxes of CL brGDGTs are between 1.7 and 6.2 µg m−2yr−1at 30 m depth and between 0.4 and
7.7 µg m−2yr−1at 60 m depth. Highest fluxes of IPL and CL
Table 5. Surface sediment data: crenarchaeol and summed brGDGT concentrations, BIT indices, MBT0indices, CBT ratios, TEX86indices, inferred mean annual air temperatures (MAATs), inferred mean summer air temperatures (MSATs) and inferred lake surface temperatures (LSTs).
Sample Basina Water OS coordinatesb [Crenarchaeol] 6[brGDGTs] %IPL BIT MBT0
CBT MAAT – MSAT – TEX86 LST (◦C)e
name depth (ng g−1dry wt.) (ng g−1dry wt.) brGDGT soil (◦
C)c lake (◦ C)d
(m) IPL CL IPL CL IPL CL IPL CL IPL CL IPL CL IPL CL IPL CL IPL CL
P1 S 15.4 BNG 38 315 NS 90 165 35 11 23 220 9 0.33 0.94 0.39 0.41 0.61 0.77 9.4 9.3 19.3 17.5 0.66 0.50 22.2 13.6 P2 S 3.3 BNG 41 851 NS 90 279 7.0 20 210 1900 10 0.96 0.99 0.29 0.31 0.83 0.90 5.1 5.4 15.8 15.7 0.45 0.60 10.7 19.1 P3 S 7.3 BNG 41 193 NS 90 054 41 54 220 1400 14 0.82 0.96 0.28 0.35 0.79 0.87 5.1 6.6 15.2 16.1 0.47 0.45 12.2 10.7 P4 S 12 BNG 40 922 NS 90 867 5.1 87 230 4200 5 0.98 0.98 0.26 0.29 0.74 0.81 4.6 5.3 14.3 15.0 0.49 0.56 13.1 17.1
P5 LN 67.5 BNG 36 538 NS 94 789 24 290 270 4200 6 0.91 0.93 0.22 0.26 0.94 1.01 2.2 3.1 10.4 11.4 0.44 0.46 10.0 11.2 P6 LN 56.3 BNG 35 510 NS 95 222 100 280 480 3300 13 0.81 0.92 0.28 0.32 0.92 1.01 4.2 4.9 13.0 13.3 0.47 0.49 12.1 12.9
P7 UN 70.2 BNG 33 562 NN 03 731 47 530 660 7300 8 0.93 0.93 0.27 0.28 0.91 1.07 3.9 3.5 12.0 11.7 0.58 0.46 17.8 11.4 P8 UN 64 BNG 33 215 NN 09 853 1.8 130 60 2900 2 0.97 0.96 0.36 0.35 1.15 1.20 5.3 4.9 14.1 13.6 0.60 0.54 19.0 15.7
aS – south, LN – lower north, UN – upper north,bOrdnance Survey coordinates,cPeterse12 calibration (Eq. 9),dPearson11 calibration (Eq. 10),ePowers11 calibration (Eq. 11).
CL crenarchaeol fluxes are generally low throughout the year (Table 4), with maxima in the final period of sam-pling, which falls almost entirely within the month of Febru-ary, and minima during the summer months. In the south basin, CL fluxes range from 0.0 to 0.7 µg m−2yr−1at 7.5 m depth and between 0.2 and 0.9 µg m−2yr−1 at 15 m depth. CL fluxes are higher in the lower north basin and range from 0.4 to 3.1 µg m−2yr−1 at 30 m depth; at 60 m depth, fluxes range from 0.1 to 3.1 µg m−2yr−1. IPL crenarchaeol fluxes are an order of magnitude lower, ranging from 0.0 to 0.4 µg m−2yr−1. Flux-weighted average %IPL crenarchaeol is 10 and 11 % in the lower north basin (upper and lower water column, respectively), while in the south basin this is 28 and 20 % in the upper and lower water column, respec-tively. In the south basin, flux-weighted average IPL TEX86
indices are 0.48 and 0.47 (7.5 and 15 m depth, respectively), and CL TEX86indices yield flux-weighted averages of 0.42
at both depths. In the lower north basin, flux-weighted aver-age IPL TEX86indices are 0.48 and 0.46 (30 and 60 m depth,
respectively); flux-weighted average CL TEX86 indices are
0.49 and 0.51 (30 and 60 m depth, respectively).
IPL and CL BIT indices in the south basin are high, rang-ing from 0.84 to 0.98 (CL) and from 0.79 to 0.91 (IPL) over the time series at 7.5 m depth (Table 4). At 15 m depth, BIT indices are similarly high and range from 0.84 to 0.95 (CL) and from 0.78 to 0.90 (IPL). Lower BIT indices (<0.85 for IPL and<0.90 for CL GDGTs) generally occur in the south basin towards the end of the time series, encompassing De-cember to February, indicating that crenarchaeol fluxes at these times are higher relative to brGDGT fluxes. In the lower north basin BIT indices are lower, with values between 0.65 and 0.81 (CL) and between 0.61 and 0.84 (IPL) at 30 m. At 60 m depth, BIT indices range from 0.68 to 0.79 (CL) and from 0.66 to 0.80 (IPL). In February, towards the end of the time series, BIT indices are generally low. Although brGDGT distributions do not vary widely, they do show a shift by basin, with a lower proportion of cyclised brGDGTs found in the lower north basin in comparison to the south basin (Table 2). CL MBT’ values are relatively constant at ca. 0.40 throughout the time series in both basins; MBT’ values
in IPLs are generally similar to those in CLs. CL CBT values range from 0.99 to 1.16 (IPL: 0.92–1.15) in the south basin, while in the lower north basin CL CBT values are higher, ranging from 1.17 to 1.26 (IPL: 0.94–1.27).
3.3.4 Sediments
Concentrations of IPL brGDGTs in lake sediments range be-tween 0.02 µg g−1, from the south basin at 15.4 m depth, to 0.66 µg g−1dry weight sediment, from the upper north basin at 70.2 m depth. CL brGDGT concentrations are higher, ranging from 0.22 µg g−1(S basin) to 7.30 µg g−1dry weight sediment (upper north basin; Table 5). There are no clear trends in concentration with depth or between north and south along the eutrophic gradient. The %IPL of brGDGTs ranges from 5 to 14 %. IPL and CL crenarchaeol concentra-tions are generally low in the south basin, ranging from 0.01 to 0.04 µg g−1(IPL) and from 0.01 to 0.09 µg g−1(CL). IPL
crenarchaeol concentrations are similar in the north basin; however, CL crenarchaeol concentrations are an order of magnitude higher in the lower north (ca. 0.3 µg g−1)and up-per north (0.13–0.53 µg g−1)basins than in the south basin. IPL TEX86 indices range from 0.44 to 0.66; CL TEX86
in-dices are similar, ranging from 0.45 to 0.60.
4 Discussion
4.1 BrGDGTs from source to sink
The relatively large catchment area of Loch Lomond (catch-ment to surface area ratio of ca. 11) is almost entirely soil covered, of which a large portion is peaty soils. This means that soil-derived brGDGT influxes would be expected to con-tribute considerably to GDGTs found in lake sediments, so 13 soils were sampled around the lake and its catchment area (Fig. 1) to characterise the distributions of soil-derived brGDGTs. Although the results show a substantial variabil-ity in brGDGT composition between individual soils, over-all they are characterised by higher IPL and CL MBT’ and higher (although variable) DC values in comparison with other sample groups (Fig. 4). Generally lower CL DC, and thus higher CBT ratios, are found in soils from the north-ern catchment area of the lake, which lead to slightly lower reconstructed pH values (means of 5.3 compared with 5.8 in the south; Table 1). This fits with the bisection of Loch Lomond by the Highland Boundary Fault (e.g. Pierce, 1999), which results in the domination of the northern catchment by base-poor soils and the south by base-rich soils. MBT’ does not reflect this spatial difference between north and south, in line with its stronger documented relationship to temper-ature rather than pH (e.g. Weijers et al., 2007a; Peterse et al., 2012). Areas of different land use and vegetation cover do not appear to affect brGDGT distributions in a character-istic manner, with the exception of peaty soils due to their increased acidity.
As streams and rivers transport eroded soil material to the lake, river sediments are expected to provide a more inte-grated soil-derived brGDGT signal in comparison to the rela-tively heterogeneous soils. Contrary to this expectation, how-ever, river sediments and SPM show somewhat lower CL and IPL MBT’ indices than soils (Fig. 4a, b). This small change in distribution might point to some brGDGT produc-tion within the river water or in the river sediments them-selves. The %IPL of brGDGTs in river sediments, an in-dicator of the proportion of living brGDGT-producing bac-teria to the older CL brGDGTs, is somewhat higher than the %IPL found within soils (15 vs. 11 %, respectively). Al-though this difference is not statistically significant, (Stu-dent’s t test: p=0.22), it is unlikely that all of the soil-derived brGDGT-producing bacteria or their IPL brGDGTs are preserved when eroded from soils into the streams and rivers. For example, some of the more labile IPL GDGTs, such as the phosphoglycolipids that correlate well with liv-ing biomass (e.g. Pitcher et al., 2009b; Schubotz et al., 2009; Lengger et al., 2012; Buckles et al., 2013), would likely be degraded during transport, resulting in lower instead of higher %IPL values. The turnover time for attached and free-living bacteria in rivers has been previously reported at around two weeks (Edwards and Meyer, 1986), support-ing the assumption that IPL brGDGTs in rivers represent
the living brGDGT-producing community. Previous studies of brGDGTs in rivers also rely on this assumption (e.g. Kim et al., 2012; Zell et al., 2013a, b). There is no statistically significant difference in CL brGDGT distributions between river water SPM and river surface sediments (Appendix 2), suggesting they share a similar source of brGDGTs. The dif-ference between IPL and CL CBT values in riverine samples is statistically significant (95 % confidence interval; pairedt
test, p <0.01). As IPL brGDGTs are suggested to largely represent those produced in situ and CL brGDGTs will most likely also represent those GDGTs washed in from soils, this offset in CBT ratios between the two supports the idea that brGDGTs may be produced even within the small rivers and streams sampled in this study, in different distributions to those found in soils. Differences in brGDGT distributions between river SPM and soils are slightly smaller than be-tween river sediments and soils, notably demonstrated by the similar soil and river SPM CL CBT and DC ratios. This sug-gests that river SPM may contain a larger proportion of soil brGDGTs associated with soil-derived clay particles.
In situ riverine production has been observed previously in large rivers. For example, Kim et al. (2012) and Zell et al. (2013a, b) analysed SPM from the Amazon River and its Tapajós River and Negro River tributaries, finding differ-ences in brGDGT distributions between soil and river SPM. This was considered to indicate in situ riverine brGDGT pro-duction in the Amazon River and its Tapajós River tributary, although brGDGT distributions in the Negro River were still rather similar to those in surrounding soil. In situ produc-tion of brGDGTs in rivers is, therefore, not unique to Loch Lomond; however, the results presented in this study now suggest that in situ production occurs here and is noticeable even in small streams. Obviously this implies that, in ad-dition to soil-derived brGDGTs, riverine-derived brGDGTs may also end up in the lake sedimentary archive. Nonethe-less, this data set is rather small and more research is needed, including specifically looking at differences in preservation potential between the different sources.
Notably, a waterlogged soil originating from a marshy area along the bank of Falloch Water shows a distinctive brGDGT distribution (S10, Table 1), not seen in another wa-terlogged soil from a grassy field (S1). Although here we observe an “aquatic” bias solely in the river-adjacent water-logged soil, in a study of western Ugandan lakes and soils, Loomis et al. (2011) proposed that water saturation might play a role in this shift in brGDGT distributions. It is pos-sible that differences in distribution between waterlogged samples here may be related to the (unknown) duration of water saturation rather than the proximity of river water, since similar shifts in brGDGT distributions noted by Loomis et al. (2011) were only observable in perennially saturated Rwenzori soils. However, any effect of differences in vege-tation cannot yet be excluded.
0.0 0.1 0.2 0.3 0.4 0.5
Soils River
SPM RiverSed. LakeSPM LakeSettl. Part.
Lake
Sed. Soils RiverSPM RiverSed. LakeSPM LakeSettl. Part.
Lake Sed.
CL GDGT-VIII IPL
0.2 0.3 0.4 0.5 0.6
CL IPL
0.00 0.02 0.04 0.06 0.08 0.10
a
b
c
0.2 0.3 0.4 0.5 0.6
Soils River
SPM RiverSed. LakeSPM LakeSettl. Part.
Lake
Sed. Soils RiverSPM RiverSed. LakeSPM LakeSettl. Part.
Lake Sed. GDGT-VII
GDGT-VIIb GDGT-VI
CL IPL
d
CL IPLf[GDGT]
[image:14.612.70.523.64.365.2]f[GDGT]
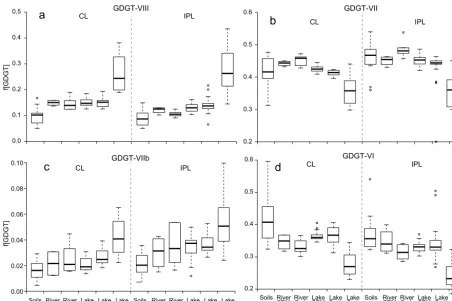
Figure 6. Boxplots of fractional abundances of (a) GDGT-VIII, (b) GDGT-VII, (c) GDGT-VIIb and (d) GDGT-VI in different sample groups
for both IPLs and CLs; Note the differences of scale on theyaxes. The box corresponds to the interquartile range (25–75 %), and the whiskers extend to 1.5 times the interquartile range (unless the full range of data is smaller than this); outliers are defined here as being outside the maximum extent of the whiskers. The black horizontal line inside the box represents the median.
mere presence of these IPL brGDGTs in Loch Lomond sed-iments, in similar proportions relative to those seen in soils, is suggestive of their in situ production within the lake itself. BrGDGT distributions in lake sediments are notably different when compared to soils (Fig. 5a, b, p, q). All major GDGTs differ significantly in their mean fractional abundances be-tween soils and lake sediments (Fig. 6a–d). Most notable is that lake sediments contain significantly higher proportions of IPL and CL GDGT VIII than soils (Figs. 5a, b, p, q, 6a), as reflected in generally lower mean IPL and CL MBT’ in-dices (Fig. 4). Mean IPL and CL DC ratios are generally higher in lake sediments compared with soils (Fig. 4), due to significantly higher proportions of GDGT VIIb in lake sed-iments (Fig. 6c; MANOVA analysis, Appendix 2). In fact, lake sediment brGDGT distributions have generally lower MBT’ and higher DC values than any other sample group (Fig. 4; MANOVA analysis, Appendix 2). There is also a clear difference between CL and IPL CBT and DC values in lake sediments, with south basin sediments yielding the lowest CBT values (Table 5).
Having examined the differences in distribution between sample groups closely (Fig. 5a–q; MANOVA analysis), it is clear that soils, river sediments and lake sediments emerge
C
BT
River
SPM sedimentRiver sedimentLake
P2 P3 P4 P1
0.0 0.7 0.9 1.1 1.3
S soils
S1
S2 S3
[image:15.612.52.280.65.237.2]S4
Figure 7. CL CBT ratios of soils from the south catchment area;
river SPM and river sediment from Endrick Water (south basin); and lake sediments from the south basin (labelled). The arrow indi-cates the increasing distance from the mouth of Endrick Water and increasing water depth of the lake sediments.
lake has a large catchment area and receives high influxes of soil- and peat-derived organic matter (Bayfield and Conroy, 1995; after Soil Survey of Scotland, 1982) presumably con-taining substantial amounts of predominantly CL brGDGTs (e.g. Weijers et al., 2006a, b). The fact that clear differences between soil and lacustrine brGDGT distributions are present indicates not only that in situ production also occurs within temperate lakes but also that this production significantly al-ters the CL brGDGT signature derived from a large, peat-rich catchment area.
4.2 Lacustrine production
Based on the significantly different brGDGT distribution in Loch Lomond sediments, it is clear that the in situ production of brGDGTs must occur within the lake. However, where ex-actly in the lake system this production occurs, i.e. in the up-per or lower water column or in sediments, is still unclear. In order to further constrain the location(s) of in situ brGDGT production, SPM depth profiles and settling particles (repre-senting nearly a year of export from the water column) at sev-eral locations in Loch Lomond were analysed for brGDGTs. BrGDGT distributions in lake SPM and settling particles are significantly different to those found in lake sediments (Fig. 6). Flux-weighted mean MBT’ values of 0.40 (CL) and 0.38 (IPL) and mean CBT values of 1.13 (CL) and 1.05 (IPL) in settling particles are both high compared with mean lake sediment values (MBT’ CL: 0.32; IPL: 0.29; CBT CL: 0.96; IPL: 0.86). Since CBT ratios of IPL brGDGTs, con-sidered to be representative of the living community, are sig-nificantly lower than those of CL brGDGTs ratios in lake sediments (Student’s pairedt test,p <0.001), this suggests that brGDGTs are produced within sediments with lower
CBT ratios than seen in other sample groups (lower DC ra-tios; Fig. 4). BrGDGTs must, therefore, also be produced within lake sediments, most likely by different bacterial com-munities that produce brGDGTs with different degrees of methylation and cyclisation. In turn, these in situ produced IPL brGDGTs degrade to CL brGDGTs, meaning that CL brGDGTs in sediments are likely a mixture of sedimentary, soil and potentially water-column-derived brGDGTs.
Tracing the brGDGT signal observed in SPM and sedi-ment from Endrick Water across the south basin, its influence on lake sediments appears to stretch across the basin; along a transect of increasing depth away from Endrick Water, lake sediments yield CL CBT values that decrease from 0.90 to 0.77 (3 to 15 m depth; Fig. 7; Table 5). In comparison, a sed-iment from Endrick Water yields a CL CBT of 0.91, Endrick Water SPM yields a CL CBT of ca. 1.05 and soils from the south catchment show an even higher average value of 1.12 (±0.10). The fact that the CL CBT value decreases, rather than increases, in a transect away from the river inflow in-dicates that it is not a recalcitrant soil signal that emerges due to remineralisation of riverine produced brGDGTs. In-stead this points again to the influence of in situ production of brGDGTs in lake sediments. This transect away from En-drick Water also corresponds with increasing depth, but con-ditions in the water column of the south basin were found to be relatively homogeneous with depth in March and Septem-ber (Fig. 3), so brGDGTs are likely not responding to a gra-dation of ambient environmental change with depth.