* Corresponding author.Tel.: +9147210750. E-mail address: [email protected] (S. Ghadernejad).
Journal Homepage: ijmge.ut.ac.ir
Investigating the Relationship between Various Brittleness Indexes with
Specific Ampere Draw in Rock Sawing Process
Reza Mikaeil
a, Saleh Ghadernejad
b, *, Mohammad Ataei
c, Mahmoud Esmailvandi
b, Abdolsalam
Daneshvar
ba Department of Mining and Metallurgical Engineering, Urmia University of Technology, Urmia, Iran
b School of Mining, College of Engineering, University of Tehran, Tehran, Iran
c Faculty of Mining, Petroleum & Geophysics, Shahrood University of Technology, Shahrood, Iran
ABSTRACT
This study aimed to develop new statistical models for evaluating the specific ampere draw (SI) based on rock brittleness index in rock sawing process. A variety of rocks, including carbonate and granite, were cut by a fully instrumented laboratory-sawing rig with two different types of circular diamond saws. Laboratory tests were performed at different depths of cut and feed rates. Multiple curvilinear regression analysis was utilized in order to estimate the SI from rock brittleness index and operational parameters. Validation of developed models was checked by t and F tests. Results showed that among different brittleness indexes, B3 has the best accuracy for both granite and carbonate rocks. Finally, it was concluded that the specific ampere draw can be reliably predicted using the proposed models for both hard and soft rocks.
Keywords : Brittleness Indexes, Sawing Process, Specific Ampere Draw, Statistical Analysis
1.
Introduction
Precise estimation of machine performance is one of the most critical issues pertaining to rock sawing process. Generally, predictive models for sawability of rocks are of utmost importance for cost estimating and planning in stone planets. In the few past decades, many studies have been carried out by various researchers to investigate the relationship between sawability and rock characteristics, as workpiece in rock sawing process. Luo (1996) investigated the effects of diamond saw blade wear characteristics in rock sawing process. He stated that by increasing the portion of whole crystals and decreasing the portion of macro-fractured particle, efficiency of a saw blade will be improved in rock cutting process [1]. Zhang and Lu (2003) proposed a new method to classify rocks based on their natural sawability, which led to useful findings for optimal designing and rational use of diamond saw blades [2]. As Xu and Zhang (2004) have stated, depth of cut and feed rate are also two main variables in a developed neural network model They tried to predict diamond saw blade segments wear performance and their results could be a helpful guideline in optimizing stone sawing [3]. Ersoy and Atici (2005) established a statistical model to estimate the specific energy required for a circular diamond saw while cutting different types of rocks, using multivariable linear regression analysis [4]. Kahraman et al. (2005) conducted performance measurements of large-diameter circular diamond saws with eight different carbonate rocks. They showed that the sawability of carbonate rocks can be predicted regarding to brittleness index which is determined from Mohr's envelope [5]. Fener et al. (2007) studied the relationship between mechanical properties of rock and performance of circular diamond saws during carbonate rocks cutting. They suggested various statistical models based on both simple and multiple regression analysis [6]. Çimen et al. (2008) carried out an experimental study to reduce electric
energy consumption in marble cutting operation [7]. Turchetta et al. (2009) analyzed machining performance specific energy [8]. Yousefi et al. (2010), in their attempt to find the optimal working condition of sawing machines [9], investigated the effects of three parameters, including the stone, machine and operating characteristics, on sawability of the ornamental stone [9]. Gelfusa and Turchetta (2011) correlated the cutting efficiency of circular diamond blade to cutting speed in various machining conditions [10]. Yurdakul and Akas (2012) introduced a model to predict specific cutting energy for large diameter circular sawing machines. They re-utilized statistical methods and used many properties such as uniaxial compressive strength, shore hardness test, apparent density, Schmidt hammer hardness test, seismic velocity, open porosity, water absorption at atmospheric pressure, saw blade diameter, and depth of cut values as input parameters in their models
[11]. Yaitli (2012) suggested a new numerical approach to simulate circular sawing system and stated that this approach can effectively be used for rock sawing process simulation[12]. Çinar and Çimen (2012) investigated the energy efficiency in cutting machines with diamond segmented circular saw blade using PDI and fuzzy logic controllers. They showed that energy could be saved by controlling the travel speed
[13]. Mikaeil et al. (2013) conducted a study to correlate the production rate of ornamental stone to rock brittleness indexes. They found out that a reliable prediction for ornamental stones production could be achieved based on B3 as a brittleness index [14]. Aydin et al. (2013) studied the performance of saw blades in granite rocks processing. Additionally, they tried to develop a model for wear estimation [15]. In another experimental study, Aydin et al. (2013) developed predictive models for the specific energy of circular diamond saw blades in granitic rocks sawing. The results showed that decreases of peripheral speeds are associated with decreasing in specific energy [16]. Bayram and Yasitli (2013) investigated the effects of machine parameters such as diamond concentration in segment, sawing depth, and saw blade diameter on
Article History:
sawing performance [17]. Xu et al. (2015) studied sawing forces of diamond frame saw in granite cutting. Results indicated that in a cutting cycle the diamond saw blade was sawing along arc trajectories, and that the blade was involved in cutting for only half of the cycle [18]. Recently, Yurdakul (2015) investigated the effect of the cutting mode, depth of cut, and feed rate on the level of consumed power, during granite cutting using circular saw blades. Various cutting tests were performed in different feed rates and cutting depths, while the peripheral speed was kept constant. This study, which was based on the evaluation of industrial cutting conditions involving the sawing of relatively large rock blocks using a circular saw blade, showed that the down-cutting mode was more useful in terms of power consumption [19].
Different factors with varying degrees of complexity affect the production costs of a stone factory. These factors can be mainly categorized as labor, energy, water, maintenance, diamond saw, polishing pad, packing costs, and filling materials. Energy consumption level have major effects on production costs. The main goal of this study was to develop new models for evaluating required energy in rock sawing process using statistical analysis. Specific ampere draw (SI) is considered as a key and controller parameter in rock sawing process and it indicates the amount of electrical energy required to saw the rocks. In this study, specific ampere draw in terms of SI was predicted based on brittleness index of rocks and operational specification of machine.
2.
Brittleness
Brittleness is a property of a material (rock in this case) that raptures or fractures with little or no plastic flow [20]. In general, there is no standardized and universally accepted definition for brittleness or a
precise measurement method to determine it. .Perhaps the best definition is offered by Ramsey (1967): ‘‘When the internal cohesion of rocks is broken, the rocks are said to be brittle’’ and/or by Obert and Duvall (1967): ‘‘materials such as cast iron and many rocks usually terminate by fracture at or only slightly beyond the yield stress’’ [21-22]. Various brittleness index definitions are currently suggested based on stress – strain curve, Mohr's envelop and energy. Additionally, a special test has been devised in order to compute the brittleness [23]. On the other hand, brittleness may be computed as a function of uniaxial compressive and tensile strength. Literature review revealed that four widely used brittleness indexes based on the strength ratio are B1, B2, B3 and B4. Hucka and Das (1974) summarized B1 and B2 (equation 1 and 2 respectively). Subsequently, Altinag (2002) suggested a new brittleness index (Eq. 3). Recently Yarali and Soyer (2011) also introduced B4 as a new brittleness index, which was found as a result of laboratory studies pertaining to percussive and rotary drilling [24-26].
(1)
(2)
(3)
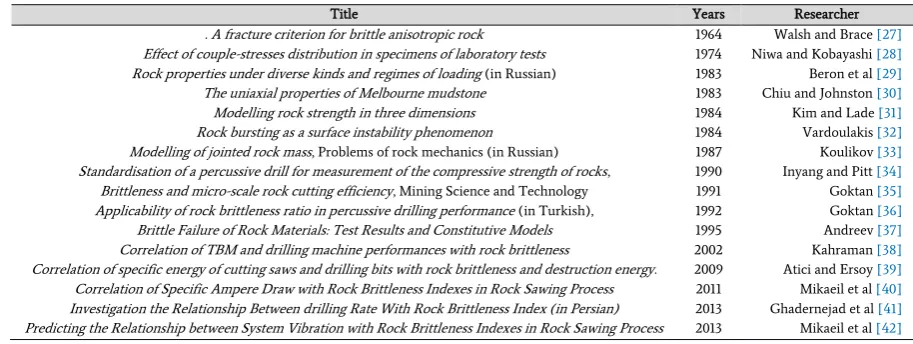
(4) Where, B1, B2, B3 and B4 are brittleness indexes as function of and. is the uniaxial compressive strength (MPa) and is the Brazilian tensile strength (MPa). The most well-known and important studies presented to date are reviewed in Table 1.
Table 1. The most famous and important studies with their parameters used in their studies.
Title Years Researcher
. Afracture criterion for brittle anisotropic rock 1964 Walsh and Brace [27] Effect of couple-stresses distribution in specimens of laboratory tests 1974 Niwa and Kobayashi [28] Rock properties under diverse kinds and regimes of loading (in Russian) 1983 Beron et al [29] The uniaxial properties of Melbourne mudstone 1983 Chiu and Johnston [30] Modelling rock strength in three dimensions 1984 Kim and Lade [31] Rockbursting as a surface instability phenomenon 1984 Vardoulakis [32] Modelling of jointed rock mass, Problems of rock mechanics (in Russian) 1987 Koulikov [33] Standardisationof a percussive drill for measurement of the compressive strength of rocks, 1990 Inyang and Pitt [34] Brittlenessand micro-scale rock cutting efficiency, Mining Science and Technology 1991 Goktan [35] Applicability of rock brittleness ratio in percussive drilling performance (in Turkish), 1992 Goktan [36] Brittle Failure of Rock Materials:Test Results and Constitutive Models 1995 Andreev [37] Correlation of TBM and drilling machine performances with rock brittleness 2002 Kahraman [38] Correlation of specific energy of cutting saws and drilling bits with rock brittleness and destruction energy. 2009 Atici and Ersoy [39] Correlation of Specific Ampere Draw with Rock Brittleness Indexes in Rock Sawing Process 2011 Mikaeil et al [40] Investigation the Relationship Between drilling Rate With Rock Brittleness Index (in Persian) 2013 Ghadernejad et al [41] Predicting the Relationship between System Vibration with Rock Brittleness Indexes in Rock Sawing Process 2013 Mikaeil et al [42]
Recently, Mikaeil et al. (2011) presented some equations for predicting the SI based on various brittleness indexes [40]. They suggested three empirical equations for both hard and soft rocks,Listed in Table 2, These equations were developed by simple regression.
Table 2. Empirical equation for prediction SI.
Equations R square
(5) SI𝐺= −0.054ln(𝐵1) + 0.1661 0.9437
(6) SI𝐶= 0.0507×exp(−0.1205× 𝐵1) 0.5355
(7) SI𝐺= −3779ln(𝐵2) − 0.0311 0.9543
(8) SI𝐶=24.653×exp(−9.0189× 𝐵2) 0.5355
(9) SI𝐺= −0.0081×exp(−0.0011× 𝐵3) 0.9545
(10) SI𝐶= 0.0087×exp(0.002× 𝐵3) 0.8944
Where SIG and SIC are specific ampere draw for granite and carbonate rocks, respectively. Mikaeil et al. (2011) developed mentioned equations only for a particular condition, including a constant operational condition (depth of cut = 30 mm, feed rate = 300 cm/min and peripheral speed of sawing machine was 1540 rpm). In the other hand it can be stated that they neglected the effects of operational
parameters on specific ampere draw. Furthermore, simple regression analysis, was performed on limited series datasets, consists only 12 experimental tests. It is noteworthy that due to limited datasets, the applicability of models is very low and they should be used only in the same operational conditions [40]. In this study, at first step, it was tried to overcome the main shortcomings of previous models, as well as developing more comprehensive models for accurate estimation of SI.
3.
Mechanism of Sawing Process
The process of diamond circular saw with chip is a grinding process, defined as demolition work-piece material. Generally, the term "Saw" is usually used. Circular Saw rotates with an angular speed cutting around the center of saw into the work-piece at a permanent rate. For eliminating the material, the work-piece surface is scratched and cracked by diamond particles on the surface of segment. In this process, an incision involves two mechanisms. Fig. 1 shows the process.
Tangential forces affect the stresses of grains which are involved in t
c B
1
c t
t c B
2
2
3 t c B
72 . 0
4 ( c t)
sawing process. Swarf was formed due to tensile and compressive forces. The result of this mechanism is primarily chip formation. The swarf is forced out through proves in front and beside the grain. Usually it has a small size but maybe make abrasion. To reach a minimum grinding thickness that is obvious, elastic characteristic of rock is necessary for sawing process. Compressive stress caused by the diamond deforms rock cut. Elastic revision by the elimination of load, leads to critical tensile stress, which causes brittle fractures. Finally, at the end of this process secondary chip formation was created by tensile stresses. The coolant fluid was utilized in order to remove the swarf [4].
1: Friction between swarf and matrix 4: Plastic deformation 2: Matrix erosion by swarf and chip 5: Elastic deformation 3: Friction between stone and grain 6: Primary chipping zone Fig. 1. Mechanical interaction between saw and stone during sawing process [4].
4.
Predicting the specific ampere draw using statistical
models
The specific ampere draw is one of the key parameters in rock sawing process and also as it indicates the amount of electrical energy required to saw the rocks it is a very significant measure of sawing process. For every little increase in specific ampere draw, which is a function of both controlled parameters related to machine and non-controlled parameters related to rock characteristics, could lead to huge increase in
sawing process costs. The sawing process and its results are strongly affected by rock characteristics in constant working conditions. This paper aimed to investigate the effect of brittleness as one of the most important mechanical properties of rocks (non-controlled parameter) on specific ampere draw in rock sawing process. On the other hand, operational parameters as controlled parameters have the same effects. The three key operational parameters in sawing operations are feed rate, peripheral speed, and depth of cut. Manipulating the feed rate, peripheral speed and depth of cut can maximize the benefits of a particular cutting operation and it can also increase performance [42]. Feed rate which could be measured in millimeters, inches or feet per actual sawing process, is defined as the saw movement rate into the rock. Applying an appropriate feed rate will lead to maximum performance of sawing operation, while an excessive feed rate will cause a decrease in penetration of saw into the rock and premature wear. In addition, using an inappropriate feed rate could decreas the tools life. The measurement (normally in inches or millimeters) of how wide and deep a tool cuts into the workpiece is referred as the depth of cut. The required force for an increase in feed rate is more than an increase in depth of cut. Increasing of the sawn area should not be done by increasing the depth of cut. Instead, less force can be spent by increasing the feed rate. Peripheral speed is defined as the rotational frequency of the spindle of the machine and is measured in revolutionary movements per minute (RPM). Overmuch peripheral speed will cause premature tool wear, breakages and tool chatter. High-quality surface finish and appropriate tool life can be achieved by using appropriate peripheral speed.
4.1.Laboratory test and statistical analysis
In first step of this study, 12 block samples of ornamental stones (5 granite, 4 marble and 3 travertine samples), were collected from different factories in Iran. In order to obtain all required rock samples from the same block, there was an emphasis on using blocks which were big enough and free of discontinuities such as fractures, alteration zones, and partings. In next step, rock samples were divided into two different groups. The first group of rocks were prepared and tested in order to measure their strength and other characteristics according to ISRM standards [43]. Obtained results from laboratory tests are shown in
Table 3. Brittleness was computed utilizing Eq. 1 to 4.
Table 3. The results of laboratory studies.
Rock sample UCS BTS B1 B2 B3 B4
(MPa) (MPa)
1 Harsin (Marble) 71.5 6.8 10.51 0.826 243.1 86.00
2 Anarak (Marble) 74.5 7.1 10.49 0.825 264.5 91.38
3 Ghermez (Travertine) 53 4.3 12.33 0.849 113.95 49.84 4 Hajiabad (Travertine) 61.5 5.6 10.98 0.833 172.2 67.09 5 Darebokhari (Travertine) 63 5.4 11.67 0.842 170.1 66.50
6 Salsali (Marble) 68 6.3 10.79 0.830 214.2 78.51
7 Haftoman (Marble) 74.5 7.2 10.35 0.824 268.2 92.31
8 Chayan (Granite) 173 14.5 11.93 0.845 1254.25 280.27
9 Ghermez Yazd (Granite) 142 8.52 16.67 0.887 604.92 165.79 10 Sefid Nehbandan (Granite) 145 9.2 15.7 0.881 667 177.87 11 Khoramdare (Granite) 133 8.3 16.02 0.883 551.95 155.20 12 Morvarid Mashhad (Granite) 125 7.4 16.89 0.888 462.5 136.65
The second group was moved to laboratory and experimental tests were performed using a full-instrumented laboratory cutting ring. Sawing machine consists of three major parts, namely a sawing unit, instrumentation and a PC (personal computer). Sawing parameters such as depth of cut, feed rate and peripheral speed can be controlled and monitored during sawing process. Also, vibration and energy consumption of machine were measured using an accelerometer
results were divided into two different groups, namely data obtained from soft and hard rocks. During the sawing process, consumed electrical energy was monitored and the specific ampere draw was calculated.
4.2. Statistical analysis
Multiple regression methods were used for predicting the relationship between the specific ampere draw, machine parameters and rock brittleness index. Used methods can be divided into two parts based on including liner and non-liner variables. In this paper, twin-logarithmic was used. What follows is the equation representing the model;
𝑍 = 𝐶 × 𝑊1
𝑎1× 𝑊
2
𝑎2...× 𝑊
𝑛
𝑎𝑛 (11)
where ‘Z’ is the predicted value corresponding to the dependent variables, ‘C’ is the intercept, ‘W1’, ‘W2’, ‘Wn’ are the independent variables, and ‘a1’, ‘a2’, ‘an’ are the regression coefficients of W1, W2, Wn. . Taking logarithms of both sides of Eq. 11, the model converts into a linear form as follows:
"log" Z="log" C+a_1 "log" W_1+a_2 "log" W_2+"\.\.\."+a_n "log" W_n (12) By implementing the below substitutions, Eq. 12 can be written as a linear regression function. The resultant liner model is given in Eq. 14:
* logZZ
*
logCC (13)
* 1
1logW aW
a * * 2 2 * 1 1 * * ... n nW a W a W a C
Z (14)
Using the experimental procedure data, regression analysis was performed. The specific ampere draw was considered as the dependent
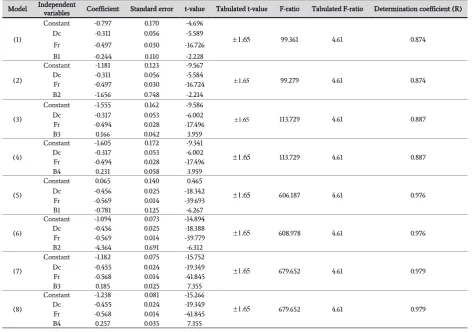
variable. Independent variables were categorized in two groups, including depth of cut and feed rate as operating characteristics and rock brittleness index as rock characteristic. Regression analysis was carried out using a computing package “Statistical Package for Social Sciences (SPSS)”. The resultant models are summarized in Table 4.
Table 4. Model developed using multiple regression methods.
No Models R2
1 SI𝐻=
1
𝐷𝑐0.311× 𝐹𝑟0.497× 𝐵10.244×100.797 0.764
2 SI𝐻=
1
𝐷𝑐0.311× 𝐹𝑟0.497× 𝐵21.656×101.181 0.764 3 SI𝐻=
𝐵30.166
𝐷𝑐0317× 𝐹𝑟0.494×101.555 0.788 4 SI𝐻=
𝐵40.231
𝐷𝑐0.317× 𝐹𝑟0.494×101.605 0.788
5 SI𝐶=
100.065
𝐷𝑐0.456× 𝐹𝑟0.569× 𝐵10.781 0.953
6 SI𝐶=
1
𝐷𝑐0.456× 𝐹𝑟0.569× 𝐵24.364×101.094 0.954
7 SI𝐶=
𝐵30.185
𝐷𝑐0.455× 𝐹𝑟0.568×101.182 0.958
8 SI𝐶=
𝐵40.257
𝐷𝑐0.455× 𝐹𝑟0.568×101.238 0.958
Where SIC and SIH are the specific ampere draw for soft and hard rocks respectively, Fr is feed rate in ‘cm/min’, Dc is depth of cut in ‘mm’, and B1, B2, B3, B4 are rock brittleness indexes.
Validation of the models was accomplished by considering the determination coefficient, and the t and F tests. The statistical results of the models are shown in Table 5.
Table 5. Statistical result of the multiple regression models.
Model Independent variables Coefficient Standard error t-value Tabulated t-value F-ratio Tabulated F-ratio Determination coefficient (R)
(1)
Constant -0.797 0.170 -4.696
99.361 4.61 0.874
Dc -0.311 0.056 -5.589 Fr -0.497 0.030 -16.726 B1 -0.244 0.110 -2.228
(2)
Constant -1.181 0.123 -9.567
99.279 4.61 0.874
Dc -0.311 0.056 -5.584 Fr -0.497 0.030 -16.724 B2 -1.656 0.748 -2.214
(3)
Constant -1.555 0.162 -9.586
113.729 4.61 0.887
Dc -0.317 0.053 -6.002 Fr -0.494 0.028 -17.496
B3 0.166 0.042 3.959
(4)
Constant -1.605 0.172 -9.341
113.729 4.61 0.887
Dc -0.317 0.053 -6.002 Fr -0.494 0.028 -17.496
B4 0.231 0.058 3.959
(5)
Constant 0.065 0.140 0.465
606.187 4.61 0.976
Dc -0.456 0.025 -18.342 Fr -0.569 0.014 -39.693 B1 -0.781 0.125 -6.267
(6)
Constant -1.094 0.073 -14.894
608.978 4.61 0.976
Dc -0.456 0.025 -18.388 Fr -0.569 0.014 -39.779 B2 -4.364 0.691 -6.312
(7)
Constant -1.182 0.075 -15.752
679.652 4.61 0.979
Dc -0.455 0.024 -19.349 Fr -0.568 0.014 -41.845
B3 0.185 0.025 7.355
(8)
Constant -1.238 0.081 -15.266
679.652 4.61 0.979
Dc -0.455 0.024 -19.349 Fr -0.568 0.014 -41.845
B4 0.257 0.035 7.355
5.
Validation and verification of models
In this study, 30 datasets (including 14 and 16 datasets for hard and soft rocks respectively), which were not incorporated in the models, were used for models testing and validating. Four indicators include coefficient of determination (R2), root mean square error (RMSE), variance account for (VAF) and maximum discrepancy between measured and predicted value (MD) were used. A model is considered to be properly developed when R2 is 1, VAF is 100%, RMSE is 0 and MD is 0. Eq. 15 to 17 were used to calculate the RMSE, VAF and MD respectively.
N
i Mi Pi N
RMSE 1 2
) (
1 (15)
100 ) var(
) var( 1
(%)
i i i M
P M
VAF (16)
N i
P M Max
MD ( i i) 1,2,...., (17)
Where Mi and Pi are measured and predicted values of SI respectively and N is number of testing samples.
The main aims of this study were investigating the relationship between SI and different brittleness indexes in varying operational conditions and opting the best brittleness index for predicting SI in rock sawing process. To achieve these purposes, validation of each of these models was checked using t and F tests. Afterwards, using mentioned indicators the best model was selected. Coefficient of determination between measured and predicted values is a good indicator for checking prediction performance of each model. Therefore next step was to calculate the coefficient of determination, RMSE, VAF and MD for each model based on testing data. Calculated values of each indicator for each model are listed in Table 6.
Table 6. Performance prediction indicators values for each model.
Model Description Training data Testing data
ND R2 ND R2 MD VAF (%) RMSE
(1) Predicting SIH with B1 96 0.874 14 0.7861 0.00039 77.7684 1.7 E-4
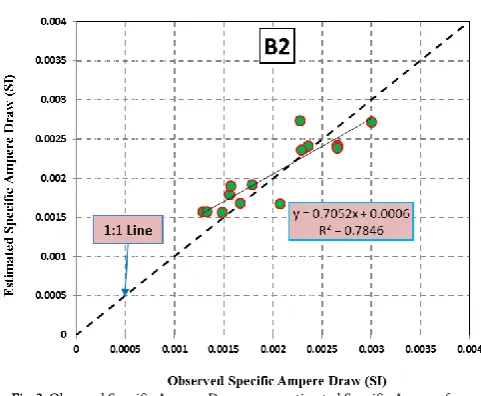
(2) Predicting SIH with B2 96 0.874 14 0.7846 0.00039 77.6609 1.8 E-4
(3) Predicting SIH with B3 96 0.887 14 0.8467 0.00038 83.2686 1.5 E-4
(4) Predicting SIH with B4 96 0.887 14 0.8467 0.00038 83.3183 1.5 E-4
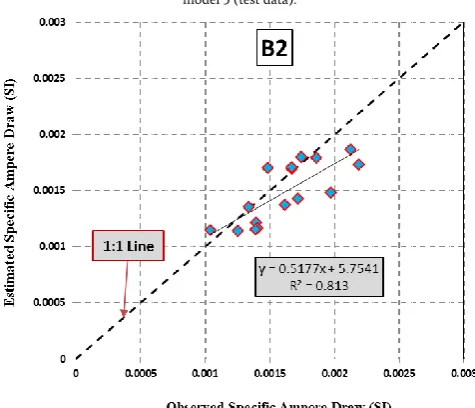
(5) Predicting SIC with B1 95 0.953 16 0.813 0.00049 59.7791 3.1E-5
(6) Predicting SIC with B2 95 0.954 16 0.813 0.00049 59.6111 3.1E5
(7) Predicting SIC with B3 95 0.958 16 0.6824 0.00049 68.137 2.9E-5
(8) Predicting SIC with B4 95 0.958 16 0.6824 0.00049 68.1439 2.9E-5
ND = number of datasets, R2 = coefficient of determination, MD = maximum discrepancy between measured and predicted SI, RMSE = root mean square error and VAF is variance account for
To see the estimation capability of the derived models, the scattered diagrams of the observed and estimated values are plotted. Ideally, on a plot of observed versus estimated values, the points should be scattered around the 1:1 diagonal straight line. Therefore, the point which lying on the line indicates an exact estimation. A systematic deviation from this line may indicate, for example, that larger errors tend to accompany larger estimations, suggesting non-linearity in one or more variables. The plots of estimated versus observed values (test data) for all models are shown in Fig. 2 to 9.
Fig. 2. Observed Specific Ampere Draw versus estimated Specific Ampere for model 1 (test data).
Fig. 3. Observed Specific Ampere Draw versus estimated Specific Ampere for model 2 (test data).
has also been selected as the best model to predict SI in soft rock condition. Finally, it is concluded that the specific ampere draw can reliably be predicted based on B3 index in soft and hard rock sawing process.
Fig. 4. Observed Specific Ampere Draw versus estimated Specific Ampere for model 3 (test data).
Fig. 5. Observed Specific Ampere Draw versus estimated Specific Ampere for model 4 (test data).
Fig. 6. Observed Specific Ampere Draw versus estimated Specific Ampere for
model 5 (test data).
Fig. 7. Observed Specific Ampere Draw versus estimated Specific Ampere for model 6 (test data).
Fig. 8. Observed Specific Ampere Draw versus estimated Specific Ampere for model 7 (test data).
6.
Conclusions
The specific Ampere Draw of system plays a significant role in rock sawing process. The SI denotes the amount of electrical energy required in sawing process. Therefore lower specific ampere draw is associated with lower costs. Main considerable factors in predicting the SI, particularly for stone application, are the operation parameters of the saw. In this paper, new models were constructed to predict the SI of sawing machine in sawing hard (Granite) and soft (Carbonate) rocks via SPSS software. The aim of obtained models was to estimate the SI of sawing machine during sawing process. This study evaluated merits of statistical model declared by SPSS in investigation the relationship between SI and various brittleness indexes in rock sawing process. To validate the proposed models, primarily each model was tested using F and T tests which resulted in demonstrating a good confidence level for each model. In next step, a comparison between performances of models was carried out using coefficient of determination, variance account for, maximum discrepancy and root mean square error. When R2 is 1, VAF is 100% and MD is 0 the model would be an ideal one. Furthermore, it was found that the B3 gives the best results for both hard and soft rocks. I It could finally be concluded that, using each of the proposed models, specific ampere draw can be predicted with a high level of accuracy. However, models 3 and 7 deliver the best results in prediction of specific ampere draw for hard and soft rock respectively. It is evident that the proposed models are constructed using the experimental data and should be used in the same conditions.
REFRENCE
[1] Luo, S.Y. (1996). Characteristics of diamond sawblade wear in sawing. International Journal of Machine Tools and Manufacture, 36(6): p. 661-672.
[2] Zhang, S.H., Lu, F. (2003). A new method of grading the sawability of natural rock materials. In Key Engineering Materials, p. 293-296.
[3] Xu, X.P., Zhang, Y.F. (2004). Neural network prediction of segment wear in stone sawing, in Materials Science Forum. 485-489. [4] Ersoy, A., Atici, U. (2005). Specific energy prediction for circular
diamond saw in cutting different types of rocks using multivariable linear regression analysis. Journal of Mining Science, 41(3): p. 240-260.
[5] Kahraman, S., Fener M., Gunaydin O. (2005). A brittleness index to estimate the sawability of carbonate rocks. In Impact of Human Activity on the Geological Environment. Proceedings of the International Symposium of the International Society for Rock Mechanics, Eurock.
[6] Fener, M., Kahraman, S., Ozder, M.O. (2007). Performance prediction of circular diamond saws from mechanical rock properties in cutting carbonate rocks. Rock Mechanics and Rock Engineering, 40(5): p. 505-517.
[7] Çimen, H., Cinar, S.M., Nartkaya, M., Yabanova, I. (2008). Energy efficiency in natural stone cutting process. IEEE Energy 2030 Conference, ENERGY, p 1-6.
[8] Turchetta, S., Polini, W., Buyuksagis, I.S. (2009). Investigation on stone machining performance using force and specific energy. Advances in Mechanical Engineering
[9] Yousefi, R., Mikaeil, R., Ataei, M. (2010). Study of Factors Affecting on the Sawability of theOrnamental Stone. Proceedings of the 8th International Scientific Conference SGEM. Bulgaria.
[10] Gelfusa, G. and Turchetta, S. (2011). Cutting efficiency of circular diamond blade. In Proceedings of the Euro International Powder Metallurgy Congress and Exhibition, Euro PM
[11] Yurdakul, M., Akdasç, H. (2012). Prediction of specific cutting energy for large diameter circular saws during natural stone cutting. International Journal of Rock Mechanics and Mining
Sciences, 53: p. 38-44.
[12] Yaitli, N.E., Bayram, F., Unver, B., Ozcelik, Y. (2012). Numerical modelling of circular sawing system using discrete element method. International Journal of Rock Mechanics and Mining Sciences, 55: p. 86-96.
[13] Çinar, S.M. and Çimen, H. (2012). On the investigation of the energy efficiency using PID and fuzzy logic controllers in a marble machine. Journal of Engineering Science and Technology Review, 5(4): p. 73-80.
[14] Mikaeil, R., Ataei, M., Yousefi, R. (2013). Correlation of production rate of ornamental stone with rock brittleness indexes. Arabian Journal of Geosciences, 6(1): p. 115-121.
[15] Aydin, G., Karakurt, I., Aydiner, K. (2013). Wear performance of saw blades in processing of granitic rocks and development of models for wear estimation. Rock Mechanics and Rock Engineering, 46(6): p. 1559-1575.
[16] Aydin, G., Karakurt, I., Aydiner, K. (2013). Development of predictive models for the specific energy of circular diamond sawblades in the sawing of granitic rocks. Rock Mechanics and Rock Engineering, 46(4): p. 767-783.
[17] Bayram, F., Yasitli, N.E. (2013). Effects of sawing parameters on natural stone processing performance. Journal of Process Mechanical Engineering, 227(4): p. 287-294.
[18] Xu, D., Zhang, J., Wang, Z., Zhang, H., Sun, Q. (2015). Study on sawing forces of diamond frame saw in granite cutting. Jingangshi yu Moliao Moju Gongcheng/Diamond and Abrasives Engineering, 35(2): p. 21-25 and 32.
[19] Yurdakul, M. (2015). Effect of cutting parameters on consumed power in industrial granite cutting processes performed with the multi-disc block cutter. International Journal of Rock Mechanics and Mining Sciences, 76: p. 104-111.
[20] Glossary of Geology and Related Sciences, Amer. Geology. Inst. (1960). Washington D.C.
[21] Ramsey, J.G. (1967). Folding and Fracturing of rocks, McGraw-Hill, London. p. 289.
[22] Obert, L. and DUVALL, W.I. (1967). Rock mechanics and the design of structures in rock, John Wiley, NewYork. p. 278. [23] Yagiz, S. (2009). Assessment of brittleness using rock strength and
density with punch penetration test. Journal of Tunnelling and Underground Space Technology, vol 24. pp 66-74
[24] Hucka, V., Das, B. (1974). Brittleness determination of rocks by different methods. Int. J. Rock Mech. Min. Sci. 11, 389–392. [25] Altindag, R. (2002). The evaluation of rock brittleness concept on
rotary blast holes drills, J. of The South Afr. Inst. of Min. Metall., Jan.-Feb, 61–66.
[26] Yarali, O., Soyer, E. (2011). The effect of mechanical rock properties and brittleness on drillability. Scientific Research and Essays. [27] Walsh, J.B., Brace, W.F. (1964). A fracture criterion for brittle
anisotropic rock, J. Geophys. Res. vol. 69, pp. 3449–3456. [28] Niwa, Y., Kobasayashi, S.H. (1974). Effect of couple-stresses
distribution in specimens of laboratory tests, Proc. 3rd Congr. ISRM, Denver, V.2A, pp. 197–201.
[29] Beron, A.I., Vatolin, E.S., Koifman, M.I., Mohnachev, M.P., and Chirkov, S.E. (1983). Rock properties under diverse kinds and regimes of loading (in Russian), Moscow, Nedra, p. 274. [30] Chiu, H.K., Johnston, I.W. (1983). The uniaxial properties of
Melbourne mudstone. Proc. 5th Congr. ISRM, Melbourne, vol.1, pp. A209–A214.
[31] Kim, M.K., Lade, P.V. (1984). Modelling rock strength in three dimensions, Int. J. Rock Mech. Min. Sci. Geomech. Abstr. vol. 21, pp. 21–33.
phenomenon, Int. J. Rock Mech. Min. Sci. Geomech. Abstr. vol. 21, pp. 137–144.
[33] Koulikov, V.V. (1987). Modelling of jointed rock mass, Problems of rock mechanics (in Russian), Moscow, Nauka. pp. 59–65. [34] Inyang, H.I., Pitt, J.M. (1990). Standardisation of a percussive drill
for measurement of the compressive strength of rocks, Rock Mech. Contributions and Challenges (Eds. Hustrulid and Johnson), 489–496.
[35] Goktan, R.M. (1991). Brittleness and micro-scale rock cutting efficiency. Mining Science and Technology, 13, pp. 237–241. [36] Goktan, R.M. (1992). Applicability of rock brittleness ratio in
percussive drilling performance (in Turkish). Anadolu University, Journal of Eng. and Arch. Fac. 8, N.1, pp. 89–99.
[37] Andreev, G.E. (1995). Brittle Failure of Rock Materials: Test Results and Constitutive Models. A.A. Balkema, Netherlands.
[38] Kahraman, S. (2002). Correlation of TBM and drilling machine performances with rock brittleness. Engineering Geology, 65(h), 269–283.
[39] Atici, U., Ersoy, A. (2009). Correlation of specific energy of cutting saws and drilling bits with rock brittleness and destruction energy. journal of materials processing technology, 209, 2602–2612. [40] Mikaeil, R., Ozcelik, Y., Ataei, M., Yousefi, R. (2011). Correlation of
Specific Ampere Draw with Rock Brittleness Indexes in Rock Sawing Process. Arch. Min. Sci., Vol. 56, No 4, p. 741–752. [41] Ghadernejad, S., Mikaeil, R., Hoseinie, S. H., Ataei, M., Sadegheslam,
G. (2013). Investigation the Relationship Between Drilling Rate with Rock Brittleness Index (in Persian). 8th conference on Iranian Society of Engineering Geology and Environment, pp 2391-2398
[42] Mikeail, M., Ataei, M., Ghadernejad, S., Sadegheslam, G. (2013). Prediction the relationship between system vibration with rock brittleness index in rock sawing process. Journal of Arch. Min. Sci., Vol. 59, No 1, p. 121–135
![Fig. 1. Mechanical interaction between saw and stone during sawing process [4].](https://thumb-us.123doks.com/thumbv2/123dok_us/8957016.1866384/3.595.156.447.480.661/fig-mechanical-interaction-saw-stone-sawing-process.webp)