JIEMS
Journal of Industrial Engineering and Management Studies Vol. 5, No. 2, 2018, pp. 61-83
DOI: 10.22116/JIEMS.2018.80685 www.jiems.icms.ac.ir
Technical performance evaluation of ERP packages with two-stage
DEA approach
Mojtaba Arab Momeni1,
*
, Mina Ebrahimi Arjestan2, Saeed Yaghoubi1Abstract
Enterprise resources planning (ERP) systems attract many attentions from industry sector because of their ability to facilitate and integrate the enterprise operations. However, many expenses accompany the implementation of these systems and consecutive changes which doing a precise and comprehensive performance evaluation a necessary part of this process. These evaluations should consider operational and technical aspects of ERP systems to reflect the effectiveness of them toward the organization's requirements. In this paper, a two-stage data envelopment analysis model (DEA) is presented in order to evaluate the efficiency of ERP systems in such a way that the operational and the technical aspect are evaluated in the first stage and the second stage of DEM model, respectively. Based on the obtained results the ERP systems’ functionality and customizability to the client processes are the two key features that need to be considered by the providers. Furthermore, the findings of parameter sensitivity analysis of the proposed model provide deep and managerial insights into the further usability improvements of ERP systems.
Keywords: Data envelopment analysis; Enterprise resource planning; two-stage DEA; ERP performance evaluation.
Received: September 2018-06
Revised: October 2018-14
Accepted: November 2018-17
1. Introduction
Nowadays, most of the business processes are encompassed by information technology (IT). With the development of IT, the organizations are processing their information with an increasing speed and accuracy, and this has led to an increase in productivity and efficacy of their operations. Along with the growth of IT, the IT service providers are increasing, hence these companies always look for the distinct and superior services to gain more market share than other competitors. Enterprise resource planning packages are one of the IT products that integrate organizational processes and has been found great attractiveness in the business context. Despite the advantages of ERP systems, such deployment of these packages in the
Technical performance evaluation of ERP packages with two-stage DEA approach
organizations is along with many changes in the organizational processes and routines that make the organizations cautious in ERP systems acceptance.
To overcome these challenges, customization of ERP packages is a solution that aims to design ERP modules according to the organizational processes. However, customization is a complicated effort and needs considerable technical abilities, besides extra efforts regarding time and cost of ERP implementation. Therefore, customization reflects the technical efficiencies of the ERP providers which increases the ERP successes and customer satisfaction. The customization also influences the quality of ERP packages. Sudhaman and Thangavel (2015) observed that customization during ERP implementation affects the quality of the final ERP packages. The change in the quality also was explained by the problems incurred in the modification of the databases, program's codes, and system design through the process of ERP customization. These problems along with the inability to debug and reduce the flaws reduced the efficiency of ERP systems.
Despite the fact that in the previous studies, the importance of the ERP customization is addressed, there are few studies that examine the customization evaluation of ERP (Nozdrina, 2009). In this regard, some researchers indicated the mismatch between ERP packages and the requested requirements (Zickert and Beck, 2013). Therefore, ERP systems evaluation with a focus on the ERP customization is one of the main purposes of this paper, which is an emerging and interesting subject in the area of the business as well as the academic research.
In this paper, the focus of our research is to consider the efficiency of the ERP packages as a combination of technical and operational efforts allocated for deployment of them. Here, the technical aspects refer to the degree of ERP accordance with the requested organization’s requirements and the operational aspects are associated with the common efforts such as time and cost paid to implement ERP functionalities. As will be discussed in the model description, these two aspects of efficiency influence each other. So measuring the efficiency of these two aspects entails a network representation of these relations. Thus, a two-stage DEA which enables to emphasize and take into account this relational network is modeled in this research. The main contributions of this paper include the following.
1. Modeling the ERP efficiency by considering the aspects related to the specifications of the product not related to the management aspect.
2. Measuring operational, technical and the total efficiency of ERP packages using a modified two-stage DEA model, which considers network relationships of the efficiency aspects.
3. Providing managerial insights by doing the sensitivity analysis of the model parameters to improve their efficiency compared to the competitors of the ERP packages.
The following sections of this paper are as follows. In section 2, the literature is reviewed by the focus on the efficiency of DEA models and ERP packages customization. Section 3, introduces the two-stage DEA model of ERP evaluation. In section 4, our model is presented and in Section 5, the results of the model implementation and sensitivity analysis are presented which provide managerial insights. Section 6, presents the discussion and finally, in Section 7, the results of the paper are highlights and some suggestions for the future studies is stated.
2. Literature Review
M. Arab Momeni, M. Ebrahimi Arjestan, S. Yaghoubi
customization or technical efficiency of ERP in the second stage. Finally, by integrating these two aspects of ERP, the total efficiency of ERP packages is measured. The study of Aversano and Tortorella (2013) also showed that large-scale information technology projects, such as ERP projects, often require the customization processes. Therefore, the quality and function of such projects should be evaluated before being established in an organization. In another study conducted by Mayrhauser et al. (1999), costs were considered as inputs and the number of users, electronic data interchange (EDI) and communications were considered as outputs. In that research, it was not clear whether the projects needed to customize or the standard ERP packages were sufficient for them. Therefore, the customization is especially important in evaluating the performance of software packages.
The DEA technique is used to determine the best decision units and consequently better usage of the resources and to identify the areas that have more contribution to the improvement purposes. Hence, DEA enables the decision units to determine their potential for performance improvement (Koch, 2007). DEA models analyze the efficiency of the similar decision units by considering multiple influencing factors. Charnes et al. (1978) published the first article in DEA and developed the Constant Return Scale (CRS) model of DEA. Banker et al. (1984), extended this model to the Variable Return Scale (VRS) model. In the CRS model, the outputs of the model directly reflect the level of the inputs. This means that if the inputs are doubled, the outputs will be doubled, too. However, in the VRS models, if a decision u nit is an Increasing Returns to Scale (IRS) unit, then increasing the inputs leads to more increase in the outputs. On the other side, if the decision unit is a Decreasing Returns to Scale (DRS) unit, the extent of increase in the inputs is more that that of the outputs. So, before applying the DEA models, one should decides to use the CRS models or VRS models. Although in the evaluation of the traditional software development project, the CRS models have been utilized, for large-scale information technology projects such as ERP, the VRS model has been preferred by some researcher such as Stensrud and Myrtveit (2003). After deciding on the CRS or VRS models, the type of optimization in the DEA model should be scrutinized. Totally, two types of the optimization modes are studied in the DEA models. The first one is Minimum Input optimization or briefly Min-In which aims to minimize the inputs to reach a certain level of outputs. The second one is Maximum Output optimization or Max-Out in which the outputs is maximized given the certain level of the inputs. In the ERP evaluation, the Max-Out optimization mode seems to be more applicable than Min-In (Stensrud and Myrtveit, 2003).
The efficiency in the DEA models is based on the definition that measures efficiency by dividing the value of the output to the value of the input. In the DEA models, however, the weighted sum of the outputs of a decision-making unit relative to the weighted sum of its input is regarded as the unit efficiency. Then by considering the model assumptions, such as being VRS or CRS, a mathematical model is presented to measure the relative efficiency of the units. The idea behind the relative efficiency of the units in the CRS model is derived by definition of the production possibility set. Regarding X as the input vectors and Y as the output vectors, in the production possibility set, it is assumed that if X is able to produce Y, then the input vector X X is also able to produce Y. Moreover, if Y could be produced by X, then Y Y is also could be produced by X. Now the production possibility set assuming a constant return to scale is defined over X and Y as the following:
1 1
{( , )| & . & 0, 1,..., }
n n
C j j j j j
j j
T X Y X X Y Y j n
(1)Technical performance evaluation of ERP packages with two-stage DEA approach
produces Yp or more than it with inputs less than Xp. This yields to the mathematical
programming model as follows:
1
1
. .
.
0, 1,..., n
j j p
j
n
j j p
j
j
Min
s t
X X
Y Y
j n
(2)
Now, if solving Eq. 2 results in 1, the decision-making unit p is said to be relatively inefficient.
The BCC model with the Max-Out optimization model which is suitable for ERP evaluation is also as follow. In this model, if
* for a decision-making unit is greater than 1, this unit is relatively inefficient and if
* is equal to 1, this indicates the efficiency of the unit.1
1
1
. .
ˆ
ˆ
1 0, 1,..., n
j j p
j
n
j j p
j
n
j j
j
Max
s t
X X
Y Y
j n
(3)
Technical performance evaluation of ERP packages with two-stage DEA approach
M. Arab Momeni, M. Ebrahimi Arjestan, S. Yaghoubi
(2016) introduced the concept of the leakage variables in the two stages DEA models. These variables act as the outputs of the first stage while they are not used in the second stage as inputs.
The multi-stages DEA models provide an appropriate framework for the evaluation of the complicated systems. Wanke and Barros (2014) measure the efficiencies of the Brazilian banks using two stages DEA model. This model includes cost efficiency in the first stage and productive efficiency in the second stage. In the first stage of the model, a number of branch and staffs used as the inputs and the staffs' cost are regarded as the output. Also, assets and deposits of the bank are considered as the outputs of the second stage. The results of that paper showed differences between the efficiency of the banks in the first and the second stage, which reflects the focus of them on one of the stages. A modified two-stage DEA model is developed in Huang et al., (2014) for measuring the efficiency of hotels in Taiwan. The proposed model evaluated the efficiency of productivity, customer attraction and catering services of the hotels and defined an efficiency index that measured all stages efficiency instead of measuring them separately. Wang et al. (2014) studied the efficiency of Chinese banks using a two-stage DEA model. The first stage of the model included the deposit of the banks and the second stage investigated the profitability of the banks. The results of the study denoted that the first stage inefficiency is more relevant in the Chinese bank while the private banks were more efficient than government banks. Wu et al. (2015) examined the efficiency of the industries in China by a two-stage DEA model. In that paper, changing the business roles in China was identified as an improving factor in firms' performance, although this modification amplified the problems such as the increment in energy consumption and pollution. Hence, in their proposed DEA model, the energy efficiency was measured in the first stage and the efficiency of the Chinese firms in the control of pollution is considered at the second stage. However, despite the remarkable use of the two-stage DEA models in some business context such as banking, this method has not been extended to the ERP evaluation to the best of our knowledge. Dos and Datta (2017) introduced a two-stage models for evaluation of Information Technology-enabled Services (ITeS) which seems to be relevant with the present research. However, in Dos and Datta (2017), the second stage of evaluation is not a DEA stage but they used the Random-Effects Tobit regression analysis to map the inputs (salaries and wages and operating expenses) and output (sales incomes) of the one- stage DEA model into the obtained efficiency score of the DEA model. Therefore, introducing the two-stage DEA model for ERP evaluation and underlining different aspects of each stage is the contribution of the present paper for ERP studies which is also applicable for other software's evaluation process.
So far, some studies have been conducted on the effectiveness of ERP packages. Teltumbde (2000) presented a methodological framework that evaluated ERP projects based on management factors. In this research, the technical aspects of ERP packages were not studied. Stefanou (2001) proposed a framework for evaluating ERP software using the estimation of cost and benefits. Nozdrina (2009) presented a model based on fuzzy logic to assess the effectiveness of ERP projects from a project management perspective. Daneva (2010) reported that a low level of reuse of an ERP project implies the customization of standard components, and the high level of reuse reflects the limited customization of the ERP package. Also, it states that ERP projects usually rely less frequently on reusing program components, reflecting the low performance of ERP projects.
Technical performance evaluation of ERP packages with two-stage DEA approach
Liu et al. (2010) measured the financial and commercial efficiency of ERP with eight input variables and four output variables. Chen et al. (2009b) studied the failure factors of ERP in the viewpoint of the management and resulted that only when the major functionality of the ERP fail to meet the requirements, customization should be taken into account. Also, they showed that without preliminary evaluation of ERP customization, the customization leads to poor outcomes. Tu and Yen (2013), analyzed the efficiency of the web service providers in Taiwan. They showed that the poor operational efficiency of the service provider and proposed suggestion for improvement of them. They also demonstrated that service providers' size, bandwidth, market share and demand growth rate have a determinant role in the efficiency of the second stage. Tsai and Chou (2015) paid attention to the effect of ERP on firms’ performance using a DEA model with two outputs, namely number of the resulting patents and a net profit of the firms. The results of the study showed the positive effect of ERP implementation on the growth of the patents because it facilitates the innovative activities of the firms. Moreover, based on the results, the net profit of the firms is increased as a result of ERP implementation after 3 years. Parthasarathy and Sharma (2016) defined the efficiency of the ERP packages as the ratio of the software codes and functions to the effort of ERP development in terms of time and cost. Furthermore, customization was regarded as the efficiency of the ERP packages in the viewpoint of the customer. Therefore, the relationship between the efficiency of the ERP is examined through the correlation analysis and the positive relation between these two aspects of efficiency was confirmed. In the present study, the customization definition in Parthasarathy and Sharma (2016) is utilized and we consider the customization as the efficiency of the ERP package in the second stage because it is also related to the outputs of the first stage, i.e. number of the codes and functions of the ERP package and additional efforts required to prepare the customized ERP for the customers.
In the context of ERP packages, some researchers also utilized DEA models for selection of the best ERP provider (Lall and Teyarachakul, 2006). A fuzzy DEA ranking approach also proposed by Kumar et al. (2017) for ranking software reliability growth models (SRGMs). It is notable that SRGMs models are used for estimating the reliability indexes of software such as software failure rate. In the same study, the DEA model was combined with a software components selection model for taking into account the cost of purchasing as well as the efficiency scores associated with different attributes of the components (Gupta et al., 2018). Toloo et al. (2018) also used a DEA model for project selection of information system (IS) which was combined with subjective opinions of decision makers. Brzozowski and Birfer (2017) reviewed the methods of MCDM (Multi Criteria Decision Making) technique for ERP selection. According to their results, DEA techniques had less attentions in the recent years for The ERP selection problem.
3. Proposed model
In this section, at first, some aspects of ERP customization and ERP evaluation is represented and then the DEA model measure the operational and technical efficiency of the ERP packages is provided.
3.1. ERP customization
Technical performance evaluation of ERP packages with two-stage DEA approach
M. Arab Momeni, M. Ebrahimi Arjestan, S. Yaghoubi
Hence, due to the competitiveness of providing ERP packages, those providers that have the ability to modify ERP modules in accordance with organizational requirements and provide the customized and specialized ERP packages will be better served. Therefore, in this research, we introduce customization as one of the most important aspects of ERP’s performance and efficiency.
The customization of ERP packages involves the changes and modifications to each component of ERP systems including modules, databases, code, reports, and user interfaces to provide ERP packages according to the user requirements (Lee et al., 2005). Many organizations prefer to customize their ERP packages to match their business and IT goals (Shao and Lin, 2002). In customizing ERP packages, organizations can adopt a variety of solutions such as (Brehm et al., 2001): configuring ERP packages by using software components in their organization; using the third party to implement ERP functions and modifying user interfaces and codes to match software requirements. Customizing ERP packages not only cause any changes to the organization's processes but also changes in the implementation process.
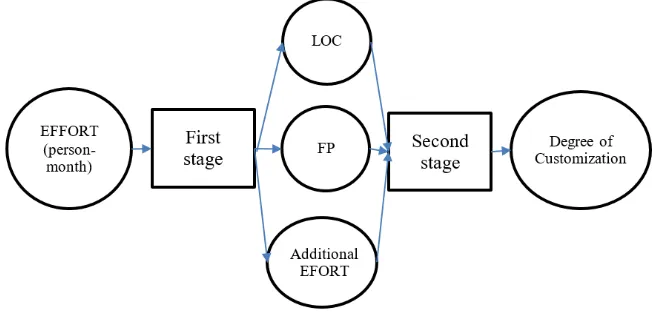
The main process in evaluating the performance of a software product is the use of an appropriate methodology to identify the functional parameters of the software package by Kitchenham and Mendes (2004). The size and the amount of effort have been made to develop a software are the two important factors to evaluate their efficiency by Kitchenham (2002). The size of a software can be determined by counting the number of program code lines (LOC) and the number of function points (FP) used in the software. The amount of time which is spent to produce a software package is an important measure in the evaluation of ERP packages. This measure shows the number of hours worked by the total workforce to complete a software. Operational aspects of ERP systems are measured by the number of hours used in software preparation, the number of lines in the program code and the number of function points. Here, the number of code lines and the number of functions is the output of the first stage and the number of person-hour of the workforce is the input of the first stage.
3.2. ERP performance evaluation
The conceptual model of our research is presented in Fig. 1.
Figure 1. The conceptual model of ERP evaluation
Technical performance evaluation of ERP packages with two-stage DEA approach
ERP and its organizational processes. In the process of the customization, the ERP provider make appropriate changes to the offered software package based on the customers' requirements. Moreover, the degree of the customization is dependent to the ability of the ERP providers as well as their additional efforts dedicated to the process of the customization. In this regard, an efficient and skillful ERP providers is the one with the sophisticated codes and functions which enable it to make the highest level of the customization with the least additional effort. Therefore, we call the second stage of the proposed model "technical efficiency" or "customization efficiency. The second phase of the DEA network model in this study is the customization function. In order to calculate the degree of customization of ERP packages we can use the Software Requirements Specification (SRS) (Parthasarathy and Sharma, 2016). By using these worksheets, we can make the necessary changes, including adding, deleting, and modifying the configuration characteristics, design and functionality requirements. Then we can obtain the degree of customization using the equation
/
100D X Y Z R . In this equation, X is the number of configuration requirements,
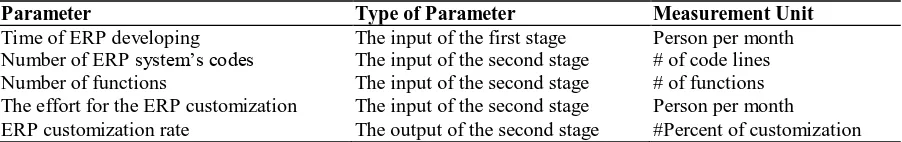
Y defined as the number of functional requirements and Z is the number of design requirements in the ERP package, which need to be customized, and R is the sum of the above requirements, which must be in accordance with the worksheet of the SRS of the ERP client organization. Types of customization are defined in Table 1. Also, Table 2 shows the inputs and outputs of the DEA model and its measurement units.
Table 1. Types of customization of ERP packages (Parthasarathy and Sharma, 2016) Type of
customization Descriptions Example
Configuration Customize the
configuration of ERP
packages
In this method, the ERP packages are configured to fit the needs of the client organization. For example, if ERP packages are going to use in different countries, then the tax rate should be adjusted according to the local auditing and calculated according to the customer's geographical location. These changes are categorized as the ERP configuration changes, so there are no changes in the programming codes.
Functionality Customize ERP packages to
enhance the technical
requirements
In this type of customization, new functions need to be added to the ERP packages or, in some cases, a number of existing functional requirements should be corrected.
Design User interface changes In this case, changes are made in the design of the software,
and subsequently, programming codes are rewritten.
Table 2. Inputs and outputs of different stages of ERP performance evaluation
Parameter Type of Parameter Measurement Unit
Time of ERP developing The input of the first stage Person per month
Number of ERP system’s codes The input of the second stage # of code lines
Number of functions The input of the second stage # of functions
The effort for the ERP customization The input of the second stage Person per month
ERP customization rate The output of the second stage #Percent of customization
M. Arab Momeni, M. Ebrahimi Arjestan, S. Yaghoubi
Table 3. Parameters of the proposed models Description
Parameter
Index of decision-making units j
Index of the reference unit o
Index of the first stage inputs i
Index of the first stage outputs d
Index of the second stage inputs which are not the outputs of the first stage l
Index of the second stage output r
Number of decision-making units (ERP provider or seller) n
Number of inputs in the first stage m
Number of outputs in the first stage D
Number of the inputs in the second stage which are not the outputs of the second stage Q
Number of the outputs in the second stage S
Amount of input i used by DMU j ij
x
Amount of output d provided by DMU j dj
z
Amount of output r provided by DMU j rj
y
Amount of input l used by DMU j lj
s
Table 4. Variables of our models Description
Variable
the weight of the efficiency in the first stage w1
the weight of the efficiency in the second stage w2
the weight of output d in the first stage
d
the weight of input i in the first stage i
v
the weight of output r in the second stage r
u
the weight of input l in the second stage
l
the relative efficiency of decision-making unit o *
o
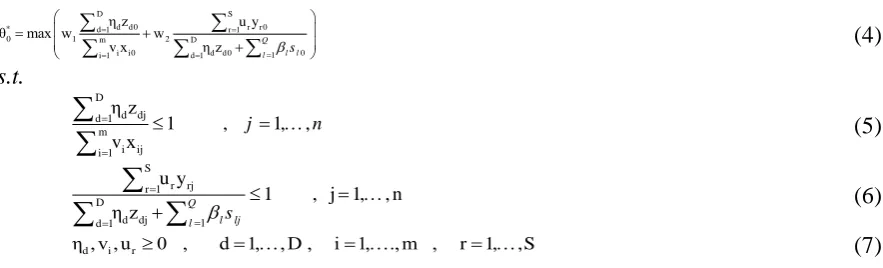
Our proposed model is based on the two-stage DEA model that proposed by Chen et al. (2009). By using the aforementioned parameters and variables, we formulated our model as follows.
D S
d d0 r r 0
* d 1 r 1
0 1 m 2 D i i0 d d
1 d 1 0
i 0 1
η z u y θ max w w
v x η z Q l l
l s
(4)
s.t. D d dj d 1 m i ij i 1 η z
1 , 1, , v x j n
(5) S r rj r 1 Dd dj 1 d 1
u y
1 , j 1, , n η z Q
l lj l s
(6)d i r
η , v , u 0 , d 1, , D , i 1, ., m , r 1, ,S (7)
In the above model, the Eq. 4 shows the relative efficiency of the oth decision-making unit,
which is the weighted sum of the first stage performance and its second stage performance. Eqs. 5 and 6 describe the efficiency of the first and second stages cannot be greater than 1, and finally, the constraints Eqs. 6 and 7 describe the types of decision variables.
Technical performance evaluation of ERP packages with two-stage DEA approach
m i i0 i 1
1 m D
i i0 d d 0
i 1 d 1 1 0
v x w
v x η z Q l l
l s
(8)D
d d 0 d 1
2 m D
i i0 d d 0
i 1 0 1 0 1 d 1 η z w
v x η z
Q l l l Q l l l s s
(9)By substituting w1and w2in the previous model, Eq. 10 is obtained as follows:
D S
*
0 d d0 r r 0
d 1 r 1
m D
i i0 d d0
i 1 d 1
D m
d dj i ij
d 1 i 1
S D
r rj d dj
r 1 d 1
d i r
1 2 0 1 1 2 1
max θ η z u y
v x η z 1
η z v x 0 , j 1, , n
u y η z 0 , j 1, , n
η , v , u 0 , d 1, . . , Q l l l Q l lj l l u u s t s u s u
1 2, D , i 1, ., m , r 1, ,S, l=1,.. ,
Q ,
.,
u u free
(10)
It is obvious that in Eq. 10, all the outputs of the first stage are consumed in the second stage. Finally, if *
o
is equal to 1, the decision-making unit would be considered as an efficient unit, otherwise, the decision-making unit would be identified as inefficient relative to other units.
4. Model performance evaluation
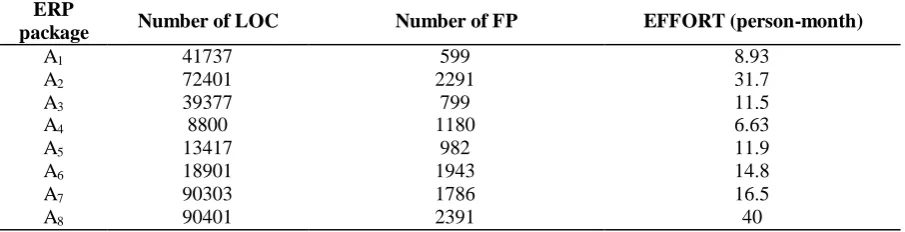
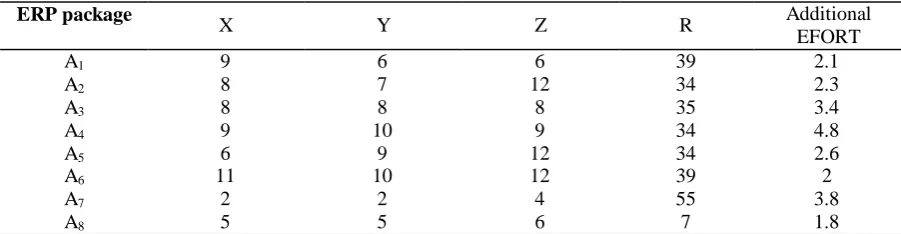
To evaluate the performance of the proposed method, we adopted the same cases as presented in Parthasarathy and Sharma (2016) which include the information about the user, the time required to implement the software, the number of operating codes, the number of functional codes, and the level of customization of each of the ERP packages. These packages are nominated as A1 to A8 and the details of them are presented in table 5. Table 6 presents the
details of customized ERP packages:
Table 5. Data on the operational efficiency of ERP packages (Parthasarathy and Sharma, 2016)
EFFORT (person-month) Number of FP
M. Arab Momeni, M. Ebrahimi Arjestan, S. Yaghoubi
Table 6. The efficiency of customization of ERP packages (Parthasarathy and Sharma, 2016)
Additional EFORT R Z Y X ERP package 2.1 39 6 6 9 1 A 2.3 34 12 7 8 2 A 3.4 35 8 8 8 3 A 4.8 34 9 10 9 4 A 2.6 34 12 9 6 5 A 2 39 12 10 11 6 A 3.8 55 4 2 2 7 A 1.8 7 6 5 5 8 A
In the following section, we determine the operating efficiency, customization efficiency, and overall efficiency of ERP packages using the proposed two-stage DEA model.
Also, It should be pointed out that all models; the operational efficiency, the customization efficiency and the two-stage model of the total efficiency; have been coded and solved using GAMS software v. 22.9 on a computer with core i5 CPU and 4.0 GB RAM. Doing so, we utilize the concept of the dynamic sets in GAMS to run all DEA models for all the references ERP packages in just one implementation. Furthermore, each model for each reference ERP package is solved in less than one second due to the linearity of the proposed models.
4.1. Measuring the operational efficiency of the ERP packages
Table 7 shows the efficiency of the ERP packages in the first stage namely operational efficiency. Also, the values of the variablej | j 1,..., n in model (3) for each reference ERP package are shown in Table 8.
Table 7. The operational efficiency of ERP packages
* ERP package 1.000 1 A 1.000 2 A 1.415 3 A 1.000 4 A 1.670 5 A 1.000 6 A 1.000 7 A 1.000 8 A
Table 8. The values of jfor ERP packages relative to the reference units in the first stage
Technical performance evaluation of ERP packages with two-stage DEA approach
According to the results of Table 7, the ERP packages A1, A2, A4, A6, A7, and A8 are efficient
ERP packages operationally (* 1 ), while A3 and A5 compared to other REP packages are
relatively inefficient. It is also notable that for an inefficient reference ERP packages, if j
(associated with decision-making unit j) is positive then the unit j unit is known as a dominant unit for that reference package. In this regard, the raw of A3 in Table 8 has j 0 for ERP
packages A1, A4 and A7 and this fact denotes that A1, A4 and A7 are dominant decision-making
units for ERP package A3. Similarly, A4, A6, and A7 are identified as the dominant unit for the
inefficient ERP package A5. Obviously, for the efficient ERP package j*, we have
j* 1 and0 | *
j j j
, because this ERP package is just dominated by itself.4.2. Measuring the customization efficiency of the ERP packages
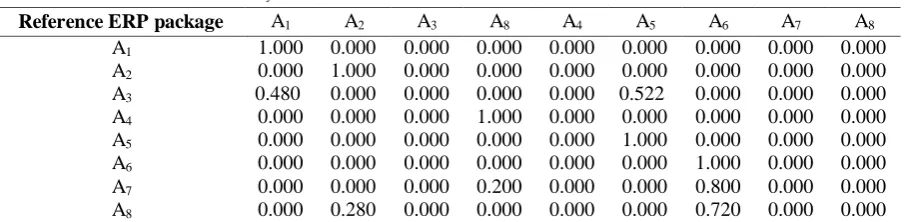
In calculating the customization efficiency of ERP packages, the number of function points, as well as the number of program codes and the number of person-month spent for customization, are used as the inputs in the single-stage DEA model of customization efficiency, and the level of customization is the output of this model. The required information about this stage is available in Tables 5 and 6. Table 9 shows the efficiency of the ERP package in the second stage, and in Table 10, the values of the j for ERP package relative to the reference units are
shown.
Table 9. The customization efficiency of ERP packages
* ERP package 1.000 A1 1.000 A2 1.145 A3 1.000 A4 1.000 A5 1.000 A6 5.640 A7 2.610 A8
Table 10. The values of jfor ERP packages relative to the reference units in the second stage
8 A 7 A 6 A 5 A 4 A 8 A 3 A 2 A 1 A
Reference ERP package
0.000 0.000 0.000 0.000 0.000 0.000 0.000 0.000 1.000 1 A 0.000 0.000 0.000 0.000 0.000 0.000 0.000 1.000 0.000 2 A 0.000 0.000 0.000 0.522 0.000 0.000 0.000 0.000 0.480 3 A 0.000 0.000 0.000 0.000 0.000 1.000 0.000 0.000 0.000 4 A 0.000 0.000 0.000 1.000 0.000 0.000 0.000 0.000 0.000 5 A 0.000 0.000 1.000 0.000 0.000 0.000 0.000 0.000 0.000 6 A 0.000 0.000 0.800 0.000 0.000 0.200 0.000 0.000 0.000 7 A 0.000 0.000 0.720 0.000 0.000 0.000 0.000 0.280 0.000 8 A
According to Table 9, ERP packages A1, A2, A4, A5, and A6 are fully efficient in the
customization stage, while A3, A7 and A8 are relatively inefficient. Also, based on Table 10,
the reference units of an inefficient unit A3 consist of A1 and A5. In addition, A2 and A6 are
dominant units of A8. In the next subsection, it is explained that if the function and program
codes will be larger in a software package, then it would be possible to customize it with better performance. For example, A2 and A6, which has a large number of function and codes and this
M. Arab Momeni, M. Ebrahimi Arjestan, S. Yaghoubi
effort (person-month) needed to customize them still results in higher efficiency in the second stage.
4.3. Calculation of Total Efficiency
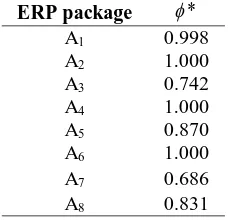
To calculate the total efficiency, we use the presented model in (10) which is a modified model of the one proposed by Chen and Kho (2009). Therefore, the total efficiency of the ERP packages will be according to Table 11.
Table 11. Performance of customization of ERP packages
*
ERP package
0.998 A1
1.000 A2
0.742 A3
1.000 A4
0.870 A5
1.000 A6
0.686 A7
0.831 A8
Based on the obtained results shown in Table 11, the A2, A4, and A5 are fully efficient, and A1,
A3, A5, A7, and A8 are identified as the inefficient ERP packages. In the previous subsections,
we observed that A3 is inefficient in both stages and it has a total efficiency of 0.743, which
indicates this package is also totally inefficient. In addition, A5, A7, and A8 were inefficient in
one of the two stages, and they are totally inefficient too. These results indicate that if one of the software packages were not being efficient in at least one stage of evaluation, it would not be measured as a completely efficient ERP package.
4.4. Sensitivity analysis of model results
In this section, we will consider whether changing the inputs of each of the network analysis stages could make inefficient ERP packages into an efficient one or not. In the calculation of operational efficiency, it was shown that A3 and A5 are inefficient. We expect that by reducing
the inputs of these packages or increasing their outputs, we can increase the relative efficiency of these decision-making units. By changing the inputs of A3 which was illustrated in Table 5
and 6, changes in the efficiency of A3 are shown in Table 12. Also, in Table 13, the operational efficiency of A5 versus different values of its input is presented.
Table 12. The operational efficiency changes of the A3 relative to the input changes 11.5 10.5
9.5 8.5
Input value
1.45 1.24
1.07 1
Efficiency
Table 13. The operational efficiency changes of the A5 relative to the input changes 11.9 10.9
9.9 8.9
7.9 6.9
Input value
1.67 1.57
1.48 1.38
1.29 1
Efficiency
Based on the results of Tables 12 and 13, it is clear that by decreasing the inputs, the relative efficiency of inefficient ERP packages will increase. Also, in calculating the relative efficiency of the second stage, it was shown that the performance of ERP packages A3, A7 and A8 is not
Technical performance evaluation of ERP packages with two-stage DEA approach
Table 14. Customization efficiency changes of the A3
59 69
79
Output value
1.45 1
1
Efficiency
Table 15. Customization efficiency changes of the A7
15 25
35 45
55 65
75 85
Output value
5.64 3.38
2.4 1.8
1.53 1.3
1.12 1
Efficiency
Table 16. Customization efficiency changes of the A8
32 42
52 62
72 82
92
Output value
2.61 1.9
1.6 1.34
1.16 1.09
1
Efficiency
The results of Tables 14 to 15, shown that increasing the outputs will lead to an increase in the relative efficiency of inefficient decision-making units in such a way they can be converted into the efficient units.
In order to increase the total efficiency of inefficient units, we can reduce the inputs of them in both stages while these inputs do not act as outputs of the first stage. Also increasing the output of the second stage could improve the total efficiency as shown in Table 13 to 15. However, increasing the outputs of the first stage, which act as both input and output parameter, their effect on the total efficiency cannot be explained without using the proposed model. In determining the total efficiency, the ERP packages A1, A3, A5, A7, and A8 were identified as
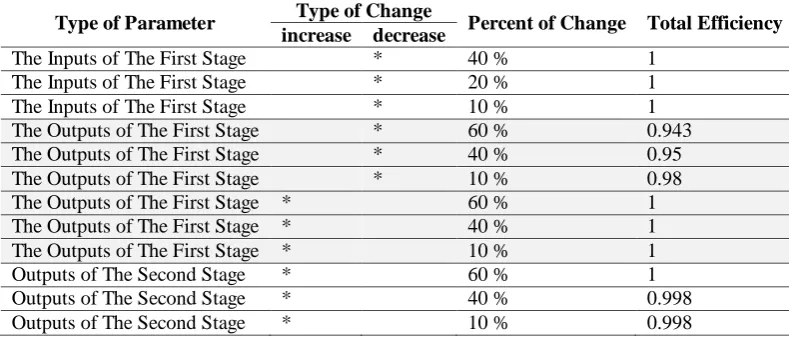
inefficient decision-making units. In this section, we investigate the effect of input and output changes on the performance of these units. Table 17 shows the different combinations of inputs from the first stage and the second stage (not the output of the first stage), and the outputs of the second stage and their effects on the total efficiency of the decision-making unit A1.
Table 17. Changes in the total performance of the A1 by changing the outputs and inputs
Type of Parameter Type of Change Percent of Change Total Efficiency increase decrease
The Inputs of The First Stage * 40 % 1
The Inputs of The First Stage * 20 % 1
The Inputs of The First Stage * 10 % 1
The Outputs of The First Stage * 60 % 0.943
The Outputs of The First Stage * 40 % 0.95
The Outputs of The First Stage * 10 % 0.98
The Outputs of The First Stage * 60 % 1
The Outputs of The First Stage * 40 % 1
The Outputs of The First Stage * 10 % 1
Outputs of The Second Stage * 60 % 1
Outputs of The Second Stage * 40 % 0.998
Outputs of The Second Stage * 10 % 0.998
The results of Table 17 denote that reducing the inputs of the first stage and increasing the output of the second stage leads to an increase in the total efficiency of A1. However, by
M. Arab Momeni, M. Ebrahimi Arjestan, S. Yaghoubi
Therefore, the proposed model could be used as a framework for evaluating the efficiency of an ERP package and also the establishment of improvement strategies in comparison with other ERP packages. For other inefficient units, a similar analysis like as the parameter sensitivity analysis of A1 can be done. Among these inefficient decision-making units, A3 has both
inefficiencies in the first and second stage and therefore needs deeper analysis to improve its efficiency. In Table 18, the efficiency changes with inputs and outputs changes for this decision-making unit are shown.
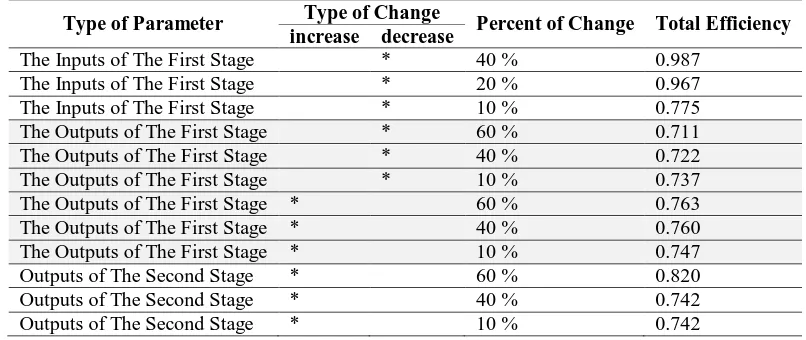
Table 18. Changes in the total performance of A3 by changing its outputs and inputs
Type of Parameter Type of Change Percent of Change Total Efficiency increase decrease
The Inputs of The First Stage * 40 % 0.987
The Inputs of The First Stage * 20 % 0.967
The Inputs of The First Stage * 10 % 0.775
The Outputs of The First Stage * 60 % 0.711
The Outputs of The First Stage * 40 % 0.722
The Outputs of The First Stage * 10 % 0.737
The Outputs of The First Stage * 60 % 0.763
The Outputs of The First Stage * 40 % 0.760
The Outputs of The First Stage * 10 % 0.747
Outputs of The Second Stage * 60 % 0.820
Outputs of The Second Stage * 40 % 0.742
Outputs of The Second Stage * 10 % 0.742
In accordance with the results of Table 17, reducing the inputs of the first stage and increasing the inputs of the second stage will increase the efficiency of A3. In addition, increasing the
outputs of the first stage cannot produce results with a specific pattern. However, in order to increase the efficiency of this unit, which is inefficient in both stages and does not have total efficiency, various combinations including simultaneous reduction of inputs and outputs can be analyzed. For example, a 60% increase in the output of the second stage and a 40% decrease in inputs will result in a total relative efficiency of this unit.
Technical performance evaluation of ERP packages with two-stage DEA approach
5. Discussion
In line with the previous studies, in this paper explained that the customization of ERP packages could be considered as a competitive advantage for ERP sellers to satisfy and attract the customers. However, we discuss that evaluation of the ERP customization is a multi-stage process, which needs a network analysis, such as the two-stage DEA model proposed in this paper. In this regard, we explain that customization needs great programming skills and reflects this fact in the model by considering the number of functions and codes applied in the ERP packages. It was stated that the more sophisticated functionality and codes could facilitate the customization process on one hand and it could affect the operational efficiency on the other hand. So in order to evaluate the customization efficiency of the ERP packages, we integrate the operational and the customization efficiency in a two-stage network that finally could be regarded as a framework to measure the total efficiency of the ERP packages. However, despite the fact that the proposed framework is suitable to consider technical features of the ERP packages in the evaluation process, but one could modify the proposed model by considering other technical features such as distinguishing the different programming techniques embedded in the ERP packages. Nevertheless, the idea of considering the ERP evaluation process in a two-stage model is the novelty of the paper that could be regarded as a new and more comprehensive framework which enhance the results confidence more than one stage models and also could provide the managerial insights by doing the sensitivity analysis explained in this paper.
6. Conclusion
In this paper, a new model for efficiency evaluation of ERP packages was proposed. To do so, the efficiency was measured in terms of the software features including a number of codes and functions and the customization stage, which reflects the degree of ERP accordance with the organizational processes of buyers. Furthermore, we considered the operational aspects of efficiency by regarding the spend time and costs of ERP development. The ERP efficiency was modeled by a two-stage DEA model, which measured operational efficiency of ERP packages in the first stage and the customization efficiency in a second stage. The two-stage DEA models have already utilized in efficiency evaluations of some decision making units such as banks and hotels and extending this concept to the evaluation of ERP packages was the novelty of the paper. Integrating the operational and customization efficiency of ERP packages in the two stages was in line with the idea that more sophisticated and comprehensive codes and functions that might lead to the less operational efficiency of ERP packages, ultimately facilitates the customization of ERP packages and consequently improves the customization efficiency. Therefore, these two aspects of the ERP packages should be measured in an integrated manner to reflect the total efficiency. The results of the paper indicated that ERP providers with higher operational efficiency and the ability to customize ERP packages have better performance than others. However, the sensitivity analysis of the parameters of the proposed model could provide managerial insights for the less efficient ERP providers to improve their efficiencies and are categorized as the efficient ERP providers in the competitive market of ERP packages.
M. Arab Momeni, M. Ebrahimi Arjestan, S. Yaghoubi
establishment of performance quality evaluation of floss projects: Application to ERP systems appraisal and employee incentive system could be notable. Moreover, the team members could facilitate the customization process using the techniques such as brainstorming, Delphi method, and deployment of good customer relationship systems.
The practical implications of the paper could be explained as follow. First, two aspects of ERP efficiency were introduced namely "operational efficiency" and "customization efficiency". The first aspect emphasizes on the processes which are important in the viewpoint of ERP provider's organizations. The second one relates the operational efficiency with the concern of the customers. The proposed framework suggests that an ERP provider could improve its efficiency by reducing the organizational efforts through some performance management best practices while trying to increase the customers' satisfaction by customizing its ERP packages. Actually, these two aspects are in line with the value-adding activities in the organizations and their relationships are addressed in the present paper by a two-stage DEA model. Second, we show through a sensitivity analysis how an inefficient ERP provider could increase its efficiency in each stage and totally. Collectively, the proposed optimization models regard the efficiency of an ERP firm in relations with other firms and these relations somehow demonstrate the competitive advantages of the firms over each other.
For the future research, using other decision-making models such as AHP and ANP models is suggested that could use other criteria to evaluate ERP packages besides the operational and customization criteria explored in this paper. Also one could extend the model of this paper to the models that examine changes in the efficiency over time such as a Malmquist productivity index as explained before. Finally, it should be pointed out that in the proposed two-stage DEA models, the output of ERP providers in terms of the customers' satisfaction were modeled as the level of customization. However, other factors such as the prices of ERP packages and other proposed service of ERP providers could affect the satisfaction of the customers and consequently the market share of ERP packages. So, one could add the third stage to the models for representing the market share. In that stage, the level of customization, price and other services act as the inputs and the sales income or the market share is the stage's output.
References
Ahn, Y. H., and Min, H., (2014). “Evaluating the multi-period operating efficiency of international airports using data envelopment analysis and the Malmquist productivity index”, Journal of Air
Transport Management, Vol. 39, pp. 12-22.
Aversano, L., and Tortorella, M., (2013). “Quality evaluation of floss projects: Application to ERP systems”, Information and Software Technology, Vol. 55, No. 7, pp. 1260-1276.
Banker, R. D., Charnes, A., and Cooper, W. W., (1984). “Some models for estimating technical and scale inefficiencies in data envelopment analysis”, Management science, Vol. 30, No. 9, pp. 1078-1092. Brehm, L., Heinzl, A., and Markus, M. L., (2001). “Tailoring ERP systems: a spectrum of choices and their implications”, In System Sciences, 2001. Proceedings of the 34th Annual Hawaii International
Conference on (pp. 9-pp). IEEE.
Technical performance evaluation of ERP packages with two-stage DEA approach
Charnes, A., Cooper, W. W., and Rhodes, E., (1978). “Measuring the efficiency of decision making units”, European journal of operational research, Vol. 2, No. 6, pp. 429-444.
Chen, Y., and Zhu, J., (2004). “Measuring information technology's indirect impact on firm performance”, Information Technology and Management, Vol. 5, No. 1, pp. 9-22.
Chen, Y., Cook, W. D., Li, N., and Zhu, J., (2009). “Additive efficiency decomposition in two-stage DEA’, European Journal of Operational Research, Vol. 196, No. 3, pp. 1170-1176
Daneva, M., (2010). “Balancing uncertainty of context in ERP project estimation: an approach and a case study”, Journal of Software: Evolution and Process, Vol. 22, No. 5, pp. 329-357.
Das, P., and Datta, A., (2018). Performance Evaluation of Indian Information Technology-enabled
Services (ITeS) Industry: An Application of Two-Stage Data Envelopment Analysis, IJAME.
Galagedera, D. U., Watson, J., Premachandra, I. M., and Chen, Y., (2016). “Modeling leakage in two-stage DEA models: An application to US mutual fund families”, Omega, Vol. 61, pp. 62-77.
Gefen, D., (2004). “What makes an ERP implementation relationship worthwhile: Linking trust mechanisms and ERP usefulness”, Journal of Management Information Systems, Vol. 21, No. 1, pp. 263-288.
Gupta, P., Mehlawat, M. K., and Mahajan, D., (2018). “Data envelopment analysis based multi-objective optimization model for evaluation and selection of software components under optimal redundancy”, Annals of Operations Research, pp. 1-24.
Huang, C. W., Ho, F. N., and Chiu, Y. H., (2014). “Measurement of tourist hotels׳ productive efficiency, occupancy, and catering service effectiveness using a modified two-stage DEA model in Taiwan”,
Omega, Vol. 48, pp. 49-59.
Kao, C., and Hwang, S. N., (2008). “Efficiency decomposition in two-stage data envelopment analysis: An application to non-life insurance companies in Taiwan”, European journal of operational research, Vol. 185, No. 1, pp. 418-429.
Kitchenham, B., and Mendes, E., (2004). “Software productivity measurement using multiple size measures”, IEEE Transactions on Software Engineering, Vol. 30, No. 12, pp. 1023-1035
Koch, S., (2007). “ERP implementation effort estimation using data envelopment analysis”, Technologies for business information systems, pp. 121-132.
Kumar, V., Singh, V. B., Garg, A., and Kumar, G., (2018). “Selection of Optimal Software Reliability Growth Models: A Fuzzy DEA Ranking Approach”, Quality, IT and Business Operations, pp. 347-357. Lall, V., and Teyarachakul, S., (2006). “Enterprise resource planning (ERP) system selection: a data envelopment analysis (DEA) approach”, Journal of Computer Information Systems, Vol. 47, No. 1, pp. 123-127.
Lee, S., Lee, K., and Kang, I. W., (2005). “Efficiency analysis of controls in EDI applications’,
M. Arab Momeni, M. Ebrahimi Arjestan, S. Yaghoubi
Light, B., Holland, C. P., and Wills, K., (2001). “ERP and best of breed: a comparative analysis”,
Business Process Management Journal, Vol. 7, No. 3, pp. 216-224.
Liu, D. W., and Ye, X. B., (2010). “Study on the Objectives of SCM in E-commerce Based on ERP Application”, In Applied Mechanics and Materials, Vol. 20, pp. 22-27.
Mayrhauser, A. V., Wohlin, C., and Ohlsson, M. C., (2000). “Assessing and understanding efficiency and success of software production”, Empirical Software Engineering, Vol. 5, No. 2, pp. 125-154. Nozdrina, L., (2009). “Applying of fuzzy logic modeling for the assessment of ERP projects efficiency”, In Proc. 5th Int. Sci. Conf. Project Management: Status and Opportunities.
Parthasarathy, S., and Anbazhagan, N., (2008). “Evaluating ERP projects using DEA and regression analysis”, International Journal of Business Information Systems, Vol. 3, No. 2, pp. 140-157.
Parthasarathy, S., and Sharma, S., (2016). “Efficiency analysis of ERP packages—A customization perspective”, Computers in Industry, Vol. 82, pp. 19-27.
Shao, B. B., and Lin, W. T., (2002). “Technical efficiency analysis of information technology investments: a two-stage empirical investigation”, Information & Management, Vol. 39, No. 5, 391-401.
Somers, T. M., and Nelson, K., (2001, January). “The impact of critical success factors across the stages of enterprise resource planning implementations”, In System Sciences, 2001. Proceedings of the 34th Annual Hawaii International Conference on. IEEE.
Stefanou, C. J., (2001). “A framework for the ex-ante evaluation of ERP software”, European Journal
of Information Systems, Vol. 10, No. 4, pp. 204-215.
Stensrud, E., and Myrtveit, I., (2003). “Identifying high performance ERP projects”, IEEE Transactions
on Software Engineering, Vol. 29, No. 5, pp. 398-416.
Sudhaman, P., and Thangavel, C., (2015). “Efficiency analysis of ERP projects—software quality perspective”, International Journal of Project Management, Vol. 33, No. 4, pp. 961-970.
Teltumbde, A., (2000). “A framework for evaluating ERP projects”, International journal of production
research, Vol. 38, No. 17, pp. 4507-4520.
Toloo, M., Nalchigar, S., and Sohrabi, B., (2018). “Selecting most efficient information system projects in presence of user subjective opinions: a DEA approach’, Central European Journal of Operations
Research, pp. 1-25.
Tsai, B. H., and Chou, S. B., (2015). “Application of multiple output data envelopment analysis in interpreting efficiency improvement of enterprise resource planning in integrated circuit firms”, The
Journal of Developing Areas, Vol. 49, No. 1, pp. 285-304.
Technical performance evaluation of ERP packages with two-stage DEA approach
Wang, K., Huang, W., Wu, J., and Liu, Y. N., (2014). “Efficiency measures of the Chinese commercial banking system using an additive two-stage DEA”, Omega, Vol. 44, pp. 5-20.
Wanke, P., and Barros, C., (2014). “Two-stage DEA: An application to major Brazilian banks”, Expert
Systems with Applications, Vol. 41, No. 5, pp. 2337-2344.
Wu, J., Xiong, B., An, Q., Sun, J., and Wu, H., (2015). “Total-factor energy efficiency evaluation of Chinese industry by using two-stage DEA model with shared inputs”, Annals of Operations Research, pp.1-20.
Zickert, F., and Beck, R., (2013). “A mapping model for assessing project effort from requirements”,
Information Systems and e-Business Management, Vol. 11, No. 3, pp. 377-401.
This article can be cited: Arab Momeni, M., Ebrahimi Arjestani, and Yaghoubi, S., (2018). "Technical performance evaluation of ERP packages with two-stage DEA approach ", Journal of Industrial Engineering and Management Studies, Vol. 5, No. 2, pp. 61-83.