DESERT
Desert
Online at http://desert.ut.ac.ir
Desert 22-1 (2017) 51-67
Assessment of desertification hazard, risk and development of
management plans
S.A. Arami
a*, M. Ownagh
aa
Gorgan University of Agricultural Sciences and Natural Resources, Gorgan, Iran
Received: 30 January 2016; Received in revised form: 16 February 2017; Accepted: 30 February 2017
Abstract
About 80 percent of Iran is arid and semi-arid and about 35 percent of this area is susceptible to desertification hazard. Therefore desertification assessment and identification of the most important criteria for the assessment of risk and a basis for development of management plans is essential. This research was conducted in the semi-arid region of Agh-Band in the Golestan province, Iran with an area of 3062.5 km2 aiming at preparation of the
desertification hazard and risk maps and development of various management plans to control the desertification. In this study, the IMDPA model and geomorphologic facies were used to evaluate the desertification hazard. The work units (geomorphologic facies) were defined based on geology and land use maps, satellite images and field surveys. The risk map was developed with a combination of desertification hazard intensity and hazard elements and degree of vulnerability maps using the total risk equation. Desertification management plan was developed based on four management strategies including: no plan, maintains the status quo, avoid the risk and implement the control measures. The results indicated that soil and vegetation criteria with magnitudes of 2.67 and 2.54 fall into sever desertification category (III) and other criteria are within medium class (II). The average value of degree of desertification in the study area was 2.03 (class II).
Keywords: Desertification hazard; Geomorphologic facies; Risk; Management plan; Agh-Band; Golestan
1. Introduction
Nowadays, risk has a widespread and multi-dimensional meaning which depends on safety, economic, social and environmental issues. Various meanings which are due to different application of different decision- making authorities have caused an indefinite definition of this word. One of the problems encountered is the technical definition of risk and extension of its application in different sciences. The best definition for the risk may be the correlation between parameter (element) and hazard (Messnerand Meyer, 2005). Desertification in arid, semi-arid, and dry sub-humid regions, is a global environmental problem (Yang et al.,
2005). Desertification sensitivity can be defined,
Corresponding author. Tel.: +98 939 4714502 Fax: +98 17 32424155
E-mail address: [email protected]
Arami & Ownagh / Desert 22-1 (2017) 51-67 52
damages as well as providing and developing various managerial plans for a semi-arid area named Agh-band. Evaluating the contribution of the most important criteria (soil, vegetation, etc.) involved in desertification is another objective of this study. A performed study by Yang et al. (2005) showed that there are two
major problems facing the assessment of degradation in China including uncertainty of baseline assessments and indictor systems and the misuse of remotely sensed data sources. Ownegh (2009) developed a desertification risk management plan for Gorgan plain on the basis of physiographic units by including five key parameters (salinity, waterlogging, water erosion, wind erosion, and degradation of vegetation cover) based on AHP and subjective model. He also classified the risk of desertification in this region into four classes, and by applying different scenarios provided a managerial plan. From the major advantages of the model adopted in this study, the quick process of evaluation and the inclusion of expert judgments under the lack of reliable field and laboratory data sources could be mentioned. Bouabid et al. (2010) assessed desertification in
Morocco's Souss river basin by means of MEDALUS with some modifications. Four main indicators including soil, vegetation, climate and management were used for the preparation of desertification sensitivity map. As given by the results, a large part of the area (72%) is highly vulnerable to desertification. The southern part of the state has a critical and fragile condition with weather as the crucial parameter which is per se exacerbated by the physical and human factors. Gad and Lotfi (2008) used remote sensing and GIS for mapping susceptible areas for desertification in Egypt and they understand that the Nile valley’s soil quality is low and also showed that 86.1% of Egypt’s soil is in the low quality class and is sensitive to erosion. Hosseini et al. (2012)
studied desertification hazard using modified MEDALUS model in Niatak region of Sistan and indicated that of the whole studied region (comprising 4819.6 acres), 55% are located in medium desertification intensity class, 26.34% are positioned in severe desertification intensity class, and 18.64% are placed in vary severe desertification intensity class. All things considered, it appears that desertification is complex in nature and many factors are involved in this phenomenon. In spite of the facts that different methods have been used to assess the risk of desertification in different regions of the world, no single method has been identified for the assessment of desertification
risk and damages and thus no management agenda thus far has been proposed. Therefore, in a systematic and sustainable attempt to reach a management plan for dealing with the risk of desertification in desert areas along a steep gradient from the foothills to the playa, preparing the maps of desertification risk and damage based on an appropriate model (IMDPAa) is inevitable. The model provides a procedure of weighted layers with GIS applications. Moreover, it insures accuracy, speed of assessing and mapping (Geeson et al.,
2010). In this study, the simultaneous implementation of three stages of risk and damage assessment as well as development of the desert management plan is of high applicability as the consecutive circles of information chain in the comprehensive land management and management of environmental risks. this study assessed desertification risk by applying the general equation R = H. E. V. Ownegh (2009) in Ziarat watershed in Gorgan, Kenlong et al. (2007) in Yangjya, Yangf Zhyg
province of China, Remondo et al. (2008) in Bajudba (northern Spain), Enrique et al. (2008)
in Kuantamo, Cuba also used this equation to estimate damage. Roads, residential areas, springs, facilities, rangeland lands and agricultural lands were selected as elements at risk in this study. Ownegh (2009) in Ziarat watershed selected roads, electricity networks, residential areas, tourist complexes and water resources. Zezere et al. (2008) in north of
Lisbon, Portugal have selected roads and buildings and Enrique et al. (2008) in Kvantamv
Cuba have selected houses, schools, cemeteries and roads as in hazard elements. Desertification in semi-arid region of Agh-band is in its active state because of the special climate, edaphic and geomorphologic characteristics of the area. Hence, it is inevitable to assess the desertification risk and status based on the criteria and indices of utmost influence in the form of the IMDPA model in order to wisely develop a mitigating while harnessing managerial plan in line with national action plan (NAP) for desertification control.
2. Materials and Methods
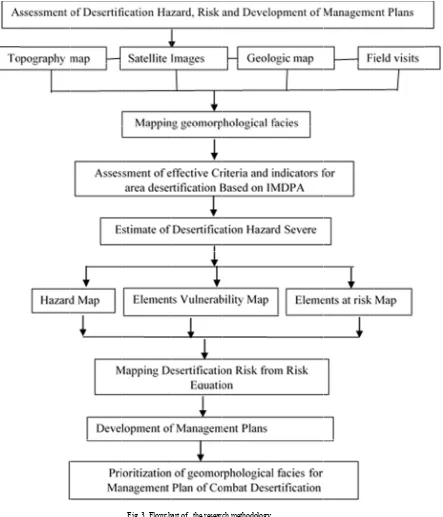
This phase of the research involved collecting information from relevant agencies, acquiring maps, defining work units, risk mapping by means of the IMDPA model, preparing risk and damage maps and finally developing an
appro pheno
2.1. S
The s 22” n
2.2. M units)
In th desert plan i geom moun
2.3. D
In this status desert provin
priate manag omenon.
Study area
study area lies northern latitud
Mapping geo
his study, to tification and in accordance orphological f ntains and pedi
Desertification
s study, for th s of deser
tification ma nce of Iran,
Table 1.
gement plan t
s within 37o 7 de and 54o 24
Fig.
omorphologica
o evaluate to provide ri with the purp facies has bee iments.
n hazard
he purpose of i rtification a aps in Agh-b IMDPA mo
Classification of Class Slight and ne Modera Sever Very Sev
Arami & Own
o deal with t
7' 37” to 37o 3 4' 03” to 54o 4
1. Location of th
al facies (wo
the hazard isk manageme pose of researc en separated in
investigating t and providi band, Golest odel was use
f desertification c s
egligible ate re
vere
nagh / Desert 2
the
37' 40'
07 km te se Fi G
he study area, Gol
ork
of ent ch, nto
the ing tan ed.
IM de cr se ge w ec de se de in ve (T
classes in IMDPA v
22-1 (2017)
51-7” eastern lon m2 in Golestan
rms of geom ections of mou
ig. 1 shows t olestan provin
lestan province o
MDPA is the esertification riteria for thre emi-humid dry eology and g
ater, erosion conomic con evelopment. eparately con esertification c As can be se nto four classe
ery severe b Table 1).
A model (Arami, 2 value range
0 – 1.5 1.6 – 2.5 2.6 – 3.5 3.6 - 4
67
ngitude with a n province, Ira morphology, is
untainous, foo the location o nce.
f Iran
latest tool fo in Iran by ta ee climates of
y. The nine c geomorpholog (water-air), nditions, urb Each of th nsidered and criterion (Fig. een each crite es of slight, m based on the
2012)
Symb I II III IV
total area of 3 an. The provin s divided into othills and low of the study a
or the assessm aking accoun f dry, semi-ar criteria are: cl gy, soil, vege agriculture, an and ind he parameters d evaluated
2).
erion map is d moderate, seve e assigned w
bol
I V
53
3062.5 nce, in o three wlands.
area in
ment of nt of 9 rid and limate, etation, socio– dustrial
s was as a
Arami & Ownagh / Desert 22-1 (2017) 51-67 54
Fig. 2. Structural diagram of IMDPA model (assessed criteria and indices) (Ahmadi, 2006)
2.4. Assessment of Desertification Risk
Total Risk is estimated by the desertification risk equation as R = H.E.V (Ammann, 2016). Where, R is risk, H large hazard, E elements at stake and V vulnerability of the elements. Elements at risk studied in this research include buildings, roads, rangelands, residential areas and infrastructure.
2.5. Map of the elements at risk
Land use, topography and the inventory of elements at risk (agriculture, rangelands, villages, facilities, roads and springs) facilitate the identification and delineation of these elements in each unit of hazard classes (Ownegh, 2009).
Table 2. Classes of elements at risk in the semi-arid region of Agh-band (Ownegh, 2009)
No Element Class Qualitative Class Number of Elements
1 I Very Low ≤2
2 II Low 3
3 III Medium 4
4 IV High 5
5 V Very High 6
Criteria
Development
of technology economicSocio- Erosion Groundwater Agriculture Vegetation cover Soil Geology Climate
Water erosion Wind erosion
Dr ou ght Ar id ity in dex Th e a m ou nt of an nu al rainf all Th e utiliza tion o f veg eta tion co ver C over c ond ition R ene wi ng C ove ra ge Elect ric al con du ctivi ty Dra in age Ut iliz at io n typ e of w or k un it T he sen si tiv ity o f sto ne Sl op e T he us e of in pu ts a nd m ac hi ne ry P rod uc ts yi el d Crop pin g patte rn EC Amou nt of ch lor ine SAR T he nu mb er of d ays with dus t sto rm Veget at io n cov er per cent Th e adven t of ero sion fac ie s Ow ne rs hi p T yp
e of u
tilization an d yield Fo rm ations and
trust to exe
Arami & Ownagh / Desert 22-1 (2017) 51-67 55
2.6. Elements Vulnerability Map
After determination of classes (Table 2) and identification of the elements in each unit of hazard map, elements vulnerability classes were
determined by using table 3 (Nazari Nejad, 2010) and based on the related hazard intensity classes, expert judgments and Conditions of the study area. Elements at the higher classes are subjected to higher level of vulnerability.
Table 3. Classification Standards and vulnerability level of elements at hazard (Nazari Nejad, 2010) Vulnerability Class Qualitative Classes Vulnerability Value
I Very Low < 7
II Low 7 - 15
III Moderate 15 - 35
IV High 35 – 45
V Very High > 45
2.7. Risk Assessment
To calculate the risk value from the aforementioned equation R = H. E. V, numerical value of risk elements, vulnerability of the elements and risk severity are multiplied in order to demonstrate the priorities of different work units and management plans to combat desertification (Table 4) (Nazari Nejad, 2010).
2.8. Prioritization of desertification management plans
Based on management classes, prioritization of management plans to deal with the crisis of desertification was carried out in semi-arid region of Agh-band (Table 5).
Table 4. Classification Standards and risk value
Risk Class Qualitative Classes Risk Value
I Very Low 0-10
II Low 10-25
III Moderate 25-40
IV High >40
Table 5. Guidelines for the setting priorities for management plans Risk
Class Management Plan Recommended Plans
Management Plan Classification
I No Plan No specific management plan is recommended 0
II Maintaining Status quo Prevention of land use change and destruction of vegetation or controlling grazing I
III Risk Avoidance II-b: planting crops tolerant to salinity II-a: spaces at risk not to be occupied II
IV Controlling measures
III-a: enrichment of grasslands, increasing vegetation, especially crops tolerant to salinity and
drought III
III-b: the mechanical operation of constructing Open Drains
3. Results
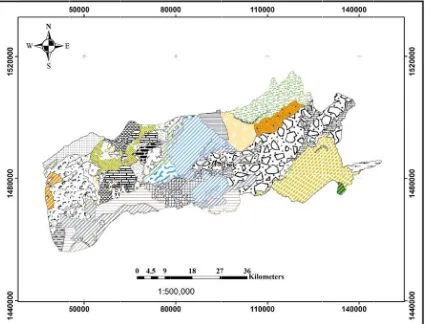
3.1. Work units (geomorphological facies)
3 study area was divided into 3 units, 5 types and 40 geomorphological facies (work unit) (Fig. 4 and 5 and Table 6). The scale all maps are 1/100000.
3.2. The hazard of desertification in the study area
56 Arami & Own
Fig. 3. Flowcha
nagh / Desert 2
art of the researc
22-1 (2017)
51-ch methodology
Geoomorphologica
(1-1-1) Mountain
(2-1-2) Hills with ril
(1-1-3) Highly salin
(1-2-3) Sand dunes
(1-3-3) River Gorga
(10-1-3) Alluvial de
(10-3-3) Aryadasht
(11-1-3) Saline outc
(11-3-3) Old terrace
(12-1-3)Saline and
(12-3-3)Aq Tappeh
(13-1-3) Rills with g
F al facies
l-furrow erosion
ne and waterlogged
s
anrood’s old meande
epositions of Atrrak
t alluvial deposits wit
crops
es of Bishek-teppeh
highly waterlogged
h alluvial deposits wit
gully morphology
Fig. 4. Work-Unit
ers
h slight salinity
and alluvial deposits
(with small eroded w
h medium salinity
Arami & Own
t map of Agh-ban
s
wind dunes) (1
(5 (1
(1
(1
(1
(1
(4
(2
(2
(2
(2
(2
(3
(3
nagh / Desert 2
nd area, Golestan
15-1-3)Marginal salin
5-1-3)Saline and wat 14-1-3)inter-rill Saline
16-1-3)Rill erosion
17-1-3)Rill and furrow
18-1-3)Marsh lands
19-1-3)Degraded field
4-1-2)Highly Hilly with
2-1-3)Clay pan
2-3-3)River Gorganro
20-1-3)Saline and ab
21-1-3)Gully erosion
22-1-3)Kalmasen
3-1-2)Hills with gullie
3-1-3)Atrak Flood Sp
22-1 (2017)
51-province (geomo
ne and waterlogged a
erlogged e surfaces
w erosion
ds
h sheet-rill erosion
ood’s inter-meanders
bandoned
s
preading
67
orphological facie
(3-3-3
(4-1-2
(4-1-3
(4-3-3
(13-3-(5-3-3
(6-1-3
(6-3-3
(7-1-3
(7-3-3
(8-1-3
(8-3-3
(9-1-3
(9-3-3 areas
s
es)
3)Regular pediments
2)Few hills with rill-sh
3)Saline with small fo
3)Piedmont Plains
-3)Marginal saline an
3)River and alluvial p
3)Local Fans
3)Plateaus and uppe
3)Water breadths
3)Bank erosion
3)Agricultural fields
3)Relatively high land
3)Saline with gully mo
3)Aryadasht alluvial d 57
heet erosion
ossil hills
nd waterlogged ares
lains
r terraces
ds, water dividing ridg
orphology
deposits with medium ges
Arami & Ownagh / Desert 22-1 (2017) 51-67 58
Table 6. Distribution of geomorphological units of semiarid region of Agh-band
frequency Percent Area (ha) Facies Type Unit 1 0.26 808.1 Mountain Relatively high mountains (0.26 %) Mountain
(0.26 %)
1 5.92
18128.55 Hills with rill-furrow erosion
Loess Hills (12.57 %) Loess Hills
(12.57 %)
1 2.90
8892.9 Highly Hilly with sheet-rill erosion
1 2.23
6825.85 Hills with gullies
1 1.52
4650.6 Few hills with rill-sheet erosion
2 2.60
7978.9 Highly saline and waterlogged
A
tra
k’
s New
Floo
d Plain (
34. 49 % ) K ha zari co ve re d p edim ent (87. 17 % ) 3 0.45 1374.98 Clay pan 1 0.11 349.88 Atrak Flood Spreading
1 0.70
2160.21 Saline with small fossil hills
3 3.15
9652.35 Marginal saline and waterlogged ares
2 1.04 3197.09 Local Fans 11 1.66 5092.58 water breadths 3 1.85 5652.23 Agricultural fields 1 1.03 3143.3 Saline with gully morphology
1 2.48
7603.02 Alluvial depositions of Atrrak
1 1.35 4149.06 Saline outcrops 1 0.86 2638.14 Saline and highly waterlogged (with small eroded
wind dunes)
2 4.34
13295.1 Rills with gully morphology
7 3.25
9940.73 inter-rill Saline surfaces
1 7.08
21687.03 Saline and waterlogged
2 0.61 1864.7 Rill erosion 3 0.78 2386.69 Rill and furrow erosion
4 0.46 1389.07 Marsh lands 1 0.29 880.4 Degraded fields 4 0.44 1350.47 Saline and abandoned
3 1.52 4662.35 Gully erosion 1 0.09 264.19 Kalmasen 15 2.58 7894.49 Coastal fossil dunes
Sand dunes (2.58 %)
1 0.21
636.97 River Gorganrood’s old meanders
Gorg an roo d’s N ew F lood Plain (50. 1 % ) 1 0.39 1181.7 River Gorganrood’s inter-meanders
1 0.30 934.54 Regular pediments 1 9.97 30584.06 Piedmont Plains 4 16.00 49016.52
River and alluvial plains
1 0.70
2132.53 Plateaus and upper terraces
2 2.01 6153.47 Bank erosion 1 0.78 2396.2 Relatively high lands, water dividing ridges
(between Atrak and Gorganrood Basins)
3 5.21
15952.05 Aryadasht alluvial deposits with medium salinity
1 2.46
7584.71 Aryadasht alluvial deposits with slight salinity
3 8.47
25946.22 Old terraces of Bishek-teppeh and alluvial deposits
1 1.97
6022.6 Aq Tappeh alluvial deposits with medium salinity
1 1.60
4888.13 Marginal saline and waterlogged areas
99 100
306250.08 Total
Fig. 5. Frequency distribution of geomorphological work-units in the study area 0.26 12.57 87.17 0 10 20 30 40 50 60 70 80 90 100
Mountain Loess Hills Khazari covered
pediment
fr
eque
ncy
(%)
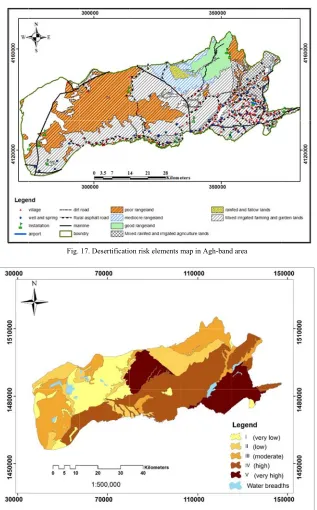
Fig. 7. Desert
Fig. 9. Desert
Fig. 11. Deser
tification sensitivi clima
tification sensitivi vegetation
rtification sensitiv erosi
ity map of Agh-b ate criterion
ity map of Agh-b n cover criterion
vity map of Agh-b ion criterion
Arami & Own
band region based
band region based
band region based
nagh / Desert 2
Fig. d on
Fig. d on
Fig. 1 d on
22-1 (2017)
51-6. Desertification
8. Desertification
10. Desertification
67
n sensitivity map geology crite
n sensitivity map agriculture crit
n sensitivity map socio-economic c
of Agh-band regi erion
of Agh-band regi terion
p of Agh-band reg criterion
59
ion based on
ion based on
60
Fig. 13. Deser
3.3. A desert
3.3.1.
Criter of im soil ( socio-climat groun
rtification sensitiv groundw
Analysis of tification in A
Desertificatio
ria of desertifi mportance inclu
2.54), develo -economic ( te (1.72), eros ndwater (1.6) (
vity map of Agh-b water criterion
Fig. 14. Deserti
criteria and gh-band area
on criteria
ication in the ude: vegetatio opment of tec
(2.21), agric sion (1.7), geo (Figs. 15 and
Arami & Own
band region based
ification sensitivi
d indicators a
region, in ord on cover (2.6 chnology (2.4 culture (2.0 ology (1.65) a
16).
nagh / Desert 2
Fig. 1 d on
ity map of Agh-ba
of
der 7), 2), 8), and
3.
A A de A 1. IM as re ar ne m (T
22-1 (2017)
51-12. Desertification develo
and region based
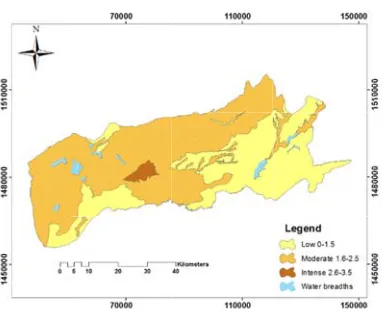
3.2. The sever
According to ArcGIS deskto
esertification Agh-band in G
95. In the cur MDPA model ssigned as th egion.
In terms of rea fell into egligible dese moderate and
Table 7).
67
n sensitivity map opment of techno
d on soil criterion
rity of desertif
calculations op 9.3 softw intensity in s Golestan prov
rrent classific l, desertificat he average st
f frequency, 3 o the desert ertification cla 17.80% into
p of Agh-band reg ology criterion
fication
made usin ware, the val semi-arid reg vince was me ation scheme tion class (II tatus to the
31.32% of th tification slig ass, 50.88% in the severe c
gion based on
ng the lue of gion of easured
of the I) was
whole
Ac found
3.4. R
In ord firstly eleme of vu consid desert classe
Table 7. Freque Class cod
I II III
ccording to th d that:
1.72 1.6 2.
Fig. 16. T
Risk Assessmen
der to map th y attempted t ents at risk and ulnerability o
deration of th tification risk es based on th
Fig. 15. The an
ncy distribution o Haza L Mo s Total
e following fo
54 1.65 2.08 2.21 2.67
The final Map of d
nt
he desertificat to identify a d then by app f each eleme he hazard int
classes were e general risk 0 0.51 1.52 2.53 3.54
we
ig
ht
ed
a
ver
ag
e
Arami & Own
nalysis of the wei
of desertification ard class Low oderate
ever
ormula it can
8 2.42 1.7 2.03
desertification int
tion risk, it w and classify t lying the degr ent and by t ensity map, t assigned in fo
equation. 1.6 1.65
0 5 5 2 5 3 5 4
nagh / Desert 2
ghted average of
hazard classes in Weight range
0-1.5 1.6-2.5 2.6-3.5
be Ev av m re 2. in
tensity in the sem
was the ree the the our
3.
Fi of de in in 1.7 1.72 2.
IMDPA Mod
22-1 (2017)
51-f deserti51-fication in
n Agh -band regio Area(ha) e
95925.92 155811.5
54512.5 302800
valuations ta verage of qua model’s criteri
egion of Agh 67 and intens ntensifying des
mi-arid region of A
4.1. Map of th
ig. 17 and 18 f classes o esertification n terms of the n the east and s
.08 2.21 2.42
del Criterias
67
n Agh-band area
on
Frequen )
3 2
5 59
1 5
aken place antitative valu ia showed th h-band, vegeta
se class (III) i sertification.
Agh-band based o
he desertificat
illustrates fre f componen in the study a e number of e
south-east. 2 2.54 2.67
ncy percent 31.32 50.88 17.80 100
on the we ues of the IM at in the sem ation criterion is the main fa
on IMDPA
tion elements
equency distri nts at hazar area. Sensitive elements are l
61
eighted MDPA mi-arid n with actor in
at risk
62
3.4.2
The e of the degre major with
The vulnerabi
expert judgme e elements at r e of vulnerab r industrial fa
a high deg
Fig.
F
ility of elemen
ent scores wer risk in order t bility. The st acilities and i gree of sens
Arami & Own
17. Desertificatio
Fig. 18. The classe
nts at risk
re used for ea to determine t tudy area lac irrigation can sitivity. Road
nagh / Desert 2
on risk elements m
es of elements at
ach the cks als ds,
ra im ar an su Q
22-1 (2017)
51-map in Agh-band
desertification ri
angelands and mportant than rea are impor nd communi urrounding cit abus, Minood
67
d area
sk
d residential p the listed elem rtant for the p ication of v ties such as dasht and Mar
properties are ments. Roads passage of ve villagers wit
Gorgan, Gon ravetappe.
nbad-e-3.4.3.
Using value turnin
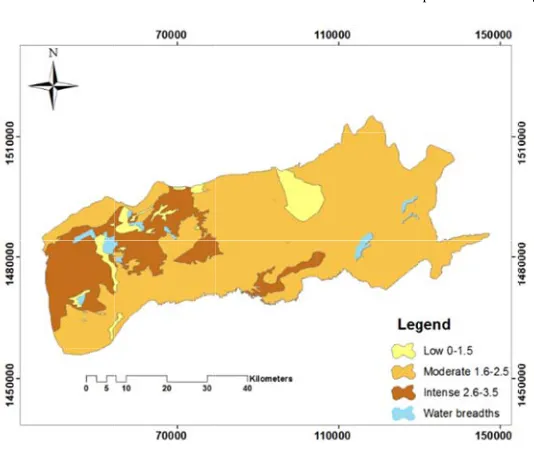
Risk of deser
g the general was calculate ng points of
Fig. 19. Vuln
rtification
equation (R = ed and classifi f the cumula
Arami & Own
nerability of elem
= H. E. V), ri fied based on t ative frequen
Fig. 20. Desertif
nagh / Desert 2
ments at risk to de
isk the ncy
cu hi sh w
fication risk map
22-1 (2017)
51-esertification in A
urves of pixel igh and very howed that ul was occurred at
of the study area
67
Agh-band area
ls in 4 classe y high (Fig. ltimately, 30. t high and ver
a
es of low, me . 20). The .03% of the ry high class.
63
Arami & Ownagh / Desert 22-1 (2017) 51-67 64
3.5. Policies and managerial plans for desertification risk
Management plans and solutions were devised on the basis of the risk classes in four activities to achieve sustainable development and to mitigate environmental conditions. Then the map of management plan was prepared accordingly (Table 8) (Ownegh, 2009).
3.6. The proposed management plans
3.6.1. Taking no plans
Areas that are included within this management plan embrace 14.43% of the total area including 5266.8 ha of agricultural fields, 33147.83 ha of rangelands, 7.7 km of main road, 10.23 km of rural blacktop and dirt road. For this reason, in these areas no particular program other than adapting to the traditional methods is recommended.
Table 8. The priority of desertification management plans
Management plan Risk class Vulnerability class Elements class hazard class Work unit cod
Non class I I I I (1-1-1) IIb II IV III II (1-1-2) I II III II II (2-1-2) I II III II II (3-1-2) Non class I III II I (4-1-2) I I III I III (1-1-3) Non class I I I III (2-1-3) I II III II II (3-1-3) Non class I I I II (4-1-3) Non class IV V III III (5-1-3) Non class I I I II (6-1-3) IIb II IV III II (8-1-3) Non class I I I III (9-1-3) I II III II II (10-1-3) I I III I III (11-1-3) Non class I I I III (12-1-3) IIIb IV V IV II (13-1-3) IIa II III III II (14-1-3) IIIb IV V III III (15-1-3) Non class I III I II (16-1-3) IIb II IV III II (17-1-3) Non class I I I III (18-1-3) Non class I I I II (19-1-3) IIIa III V II III (20-1-3) I II III II II (21-1-3) I II III II II (22-1-3) I II III III II (1-2-3) Non class I III I II (1-3-3) Non class I III I II (2-3-3) Non class I III I II (3-3-3) IIa II III V I (4-3-3) I II III IV I (5-3-3) I II III IV I (6-3-3) IIa II IV III II (7-3-3) IIb II IV III II (8-3-3) IIIa III IV IV II (9-3-3) I II III IV I (10-3-3) IIIb IV V IV II (11-3-3) IIb II IV III II (12-3-3) IIIb IV V IV II (13-3-3)
Table 9. Distribution of management activities in the study area
Management plan Management class Area (ha) Area ( percent)
No Plan Non class 44193.57 14.43
Maintaining Status quo I 110667.7 36.14
Hazard Avoidance II IIa 36934.84 IIb: 34129.04 12.06 11.14
Controlling measures III IIIb: 60072.19 IIIa: 20252.6 19.62 6.61
3.6.2. Maint for pa agricu facilit roads, blackt Impor Teppe Qami of des maint neces degra 3.6.3.
a: T agricu spring 12.17 paved villag are: D which Mana in th resista space b: Th lands, Maintain the
taining the st arts of the are ultural lands, ty, 16 wells an
, 19.81 km ru top and dir rtant villages eh, Chaparg
sh covering 3 sertification in taining the s sary measures dation of vege
Hazard avoid
This class e ultural lands, gs and wells km of rura d and graveled ges and Kalal Dykcheh, Sarli
h account for agement and hese areas is ant plants an
s at hazard. his class has
, 22825.17 ha
Fig. 21. M
e status quo I
tatus quo wa ea comprised
34124.12 ha nd springs, 53 ural dirt road,
rt roads and s here are ghoeime, Te 36.14% of tota
n these areas status quo a s to prevent l etation covers
dance II
encloses 327 2640.76 ha of , 43.45 km l dirt road, d road and 4 f
eh Town. Im i Makhtoom a r 12.6 percent prevention of accomplishe nd prevention
9139.39 ha a of rangeland
Arami & Own
Management plan
s recommend of 63572.13 of rangeland 3.53 km of ma
125.73 km ru d 46 villag Amman Q ngel and A al area. The ri
is controlled and taking t and use chang s and grazing.
737.66 ha f rangelands, of main roa 147.3 km ru facilities and mportant villag and Barbar Qa t of the regio f desertificati ed by planti n of occupyi
of agricultu ds, 1 springs a
nagh / Desert 2
ns map in the sem
ded ha , 1 ain ural ges. Qoli Aq isk by the ge, of 29 ds, ural 71 ges ale on. ion ing ing ural and w di w D re pr in th to 3. a: la w di ro in b: la sp ki an Im Ba 19 th in re co
22-1 (2017)
51-mi-arid region of A
ells, 20.7 km irt road, 4.48 hich account esertification ecommended
revention of o Due to the s n vegetation c hat it is essent o edaphic cond
6.4. Control m
This class en ands, 3405.18 ells, 0.37 km irt road, 31.3 oad, 1 facilit ncludes 6.61 p This class ands, 16712.14
prings and w ilometers of b nd graveled mportant villa
ahram Abad 9.62% of the a Due to the h he following ncreasing ve esistant to sa ontrol measur
67
Agh-band
of main road km rural pa
for 11.14 pe management by using re ccupying spac sensitivity of t cover in these tial to use hal ditions of regi
measures III
ncloses 16663 ha of rangela of main road 3 km rural p ties and 8 v ercent of stud has 25202.8 4 ha of range wells, 45.62 k
backtop roads rural roads ages are: Okh
and Okhi-tep area.
high sensitivi measures co getation by alinity and dr
res such as t
s, 17.16 km o aved and 6 v rcent of the r t in these ar esistant plant ces at hazard. the regions, in e areas is a p lophyte speci on.
.7 ha of agric ands, 6 spring ds, 1.17 km o paved and gr villages. This died region.
ha of agric lands, 4 facili km main road s, 28.3 km of s and 9 vi hi-teppeh Qa ppeh covering
Arami & Ownagh / Desert 22-1 (2017) 51-67 66
roads and drainage. Poor and deflected drainage leads to the reduction of the depth of the aquifer and waterlogging and due to the low quality of water, the evaporation of salty water and leaving alkaline soils behind the region will encounter a further qualitative and quantitative lack of vegetation in the region.
4. Discussion and Conclusion
Considering a three-step assessment process including hazard and risk assessment as well as developing management plans in semi-arid areas is of high practicality for the comprehensive management of land and environmental hazards management. Therefore, in this study, desertification risk and hazard was assessed in a semi-arid region (Agh-band, Golestan province) with a total area of 3062.5 km2 followed by the development of management plan.
The geomorphological investigation is the basis for other studies on the subject of renewable natural resources, and since the field of natural resources studies is vast and various sciences are included in it such as, botany, climatology, geology, hydrology, ecology, geology, etc. it is necessary for all other studies to be built on a similar basis that meets all of the basic requirements. This similar basis is the working unit map which is undeniably important to control and coordinate all efforts in investigating natural resources and desertification and developing managerial plans (Rezaei Rad, 2008). Building on the facts provided, desertification studies are no exception to other natural resources studies. Similarly, because of different standards used in the process and the need to evaluate each of these factors, the necessity of a comparable ground for all studies is felt more than ever that. Here, if facies can be defined according to the influential factors and can be adopted as the foundation, desertification studies will be led to a common goal and also errors caused by the lack of coordination between different standards will be avoided (Rezaei Rad, 2008). In this study, 9 criteria including climate, geology and geomorphology, vegetation, agriculture, erosion (water and wind), socioeconomic, groundwater, soil, urban and industrial development and technology were assessed to evaluate the desertification status of the semi-arid region of Agh-band by means of the IMDPA model. According to assessments made, between the criteria of desertification in the study area, the effect of vegetation is quite dominant; as a weighted average of 2.67 denotes a severe
Arami & Ownagh / Desert 22-1 (2017) 51-67 67
Mohammadi (2000) and Fallah Mehneh (2004) due to the applied management programs.
References
Abdi, Z.H., 2007. Investigation and Preparation of in desertification intensity map using IMDPA method with emphasis on water and soil Criteria in Abuzeid abad Region. M.Sc. thesis, Desert Region Management Dept., International Desert Research Center (IDRC), University of Tehran, Tehran, Iran. Abella, E.A., C.J. Van Westen, 2008. Qualitative landslide susceptibility assessment by multicriteria analysis: a case study from San Antonio del Sur, Guantánamo, Cuba. Geomorphology, 94; 453-66. Ahmadi, H., 2006. Calibration of measurement and standards of desertification in Iran, IMDPA model, Client: Department of Pasture and Soil of Forest, Rangeland and Watershed Management.
Ammann, W., 2016. Early Warning in Disaster Risk Reduction Needs and Potential. 7th International Conference on Integrated Natural Disaster Management-INDM 15-16 Feb, Tehran, Iran, pp. 9. Batterbury, S.P.J., A. Warren, 2001. Desertification in: Smelser N, Baltes P (Eds.). International Encyclopedia of the Social and Behavioral Sciences, Elsevier Press, pp. 3526–3529.
Bouabid, R., M. Rouchdi, M. Badraoui, A. Diab, S. Louafi, 2010. Assessment of land desertification based on the MEDALUS approach and elaboration of an action plan: the case study of the Souss River Basin, Morocco. Land Degradation and Desertification: Assessment, Mitigation and Remediation. Springer, Netherlands. pp. 131-145. Dolatshahi, R., 2007. Preparation of in desertification intensity map using IMDPA method with emphasis on vegetation, water and soil Criteria (Case study: South of Garmsar). M.Sc. thesis, Desert Region Management Dept., International Desert Research Center (IDRC), University of Tehran, Tehran, Iran. Fallah Mehneh, S., 2004. A Comparison of different methods of FAO-UNEP and Ekhtesasi-Mohajeri in desertification hazard zonation in order to Torbat Heidariye plain manage. M.Sc. thesis, Arid Zone Management Dept., Gorgan University of Agricultural Sciences and Natural Resources, Gorgan, Iran.
Farajzadeh, M., M.N. Egbal, 2007. Evaluation of MEDALUS Model for Desertification Hazard Zonation using GIS; Study Area: IyzadKhast Plain, Iran. Pakistan Journal of Biological Sciences, 10; 2622-30.
Gad, A., I. Lotfy, 2008. Use of Remote Sensing and Gis in Mapping the Environmental Sensitivity Areas for Desertification of Egyptian Territory. Earth Discuss,
3; 41-85.
Geeson, N.A., C.J. Brandt, J.B. Thornes, 2003. Mediterranean Desertification: A Mosaic of Processes and Responses. John Wiley & Sons, pp 456.
Hosseini, S.M., S. Sadrafshari, M. Fayzolahpour, 2012. Desertification Hazard Zoning in Sistan Region, Iran. Journal of Geographical Sciences, 22; 885-94. Jafarizadeh, M., 2010. Application of IMDPA Model to assess desertification intensity (Case Study: Mollasani-Ahvaz). M.Sc. thesis, Combating Desertification Dept., University of Tehran, Tehran, Iran.
Kunlong, Y.I., C.H .Lixia, G. Zhang, 2007. Regional Landslide Hazard Warning and Risk Assessment. Earth Science Frontiers, 14; 85-93.
Melchiade, B., 2009. Secretariat of the Convention to Combat Desertification. CSD-17 Intergovernmental Preparatory Meeting Panel on Desertification, New York. pp 150.
Mohammadi, M., 2000. A Comparison of the Efficiency of two Quantitative Methods of Desertification Hazard Zonation (Ekhtessassi-Mohajeri and Turkmenistan Desert Institute) for the Management of Bajestan Desert Area. M.Sc. theses, Arid Zone Management Dept., Gorgan University of Agricultural Sciences and Natural Resources, Gorgan, Iran.
Nazarinajad, M., 2010. Assessing ESAs and ICD Models for Desertification Hazard Mapping and Management Plans (Case study: Reza-Abad Region, Khartoran, Semnan Province). M.Sc. thesis, Arid Zone Management Dept., Gorgan University of Agricultural Sciences and Natural Resources, Gorgan, Iran.
Ownegh, M., 2009. Assessing Land Degradation Hazard Intensity and Management Plans Using Subjective Models and the Analytical Hierarchy Process in Gorgan, Iran. International Journal of Sustainable Development and Planning, 4; 35-45.
Remondo, J., J. Bonachea, A. Cendrero, 2008. Quantitative Landslide Risk Assessment and Mapping on the Basis of Recent Occurrences. Geomorphology, 94; 496-507.
Rezaee Rad, N., 2008. The Study of Desertification Potential Cheshme Khan Basin by IMDPA Method. M.Sc. thesis, Combating Desertification Dept., University of Tehran, Tehran, Iran.
Yang, X., K. Zhang, B. Jia, L. Ci, 2005. Desertification Assessment in China: An Overview. Journal of Arid Environments, 63; 517-31.