DEMOGRAPHIC RESEARCH
VOLUME 31, ARTICLE 9, PAGES 217−246
PUBLISHED 15 JULY 2014
http://www.demographic-research.org/Volumes/Vol31/9/ DOI: 10.4054/DemRes.2014.31.9
Research Material
Reverse survival method of fertility estimation:
An evaluation
Thomas Spoorenberg
© 2014 Thomas Spoorenberg.
This open-access work is published under the terms of the Creative Commons Attribution NonCommercial License 2.0 Germany, which permits use, reproduction & distribution in any medium for non-commercial purposes, provided the original author(s) and source are given credit.
1 Introduction 218
2 The method 219
3 Analytical strategy 222
4 Consistency 226
5 Sensitivity analysis 227 5.1 Fertility age patterns 227 5.2 Mortality levels and age patterns 229 5.2.1 Mortality levels 229 5.2.2 Mortality age patterns 230 5.3 International migration 231 5.4 Distorted population structure 233
6 Illustrations of the cases of Japan, Algeria, Mongolia, Ghana, and Kenya
235
6.1 Japan 236
6.2 Algeria 237
6.3 Mongolia 238
6.4 Ghana 240
6.5 Kenya 241
7 Conclusion 241
Reverse survival method of fertility estimation: An evaluation
Thomas Spoorenberg1
Abstract
BACKGROUND
For the most part, demographers have relied on the ever-growing body of sample surveys collecting full birth history to derive total fertility estimates in less statistically developed countries. Yet alternative methods of fertility estimation can return very consistent total fertility estimates by using only basic demographic information.
OBJECTIVE
This paper evaluates the consistency and sensitivity of the reverse survival method ‒ a fertility estimation method based on population data by age and sex collected in one census or a single-round survey.
METHODS
A simulated population was first projected over 15 years using a set of fertility and mortality age and sex patterns. The projected population was then reverse survived using the Excel template FE_reverse_4.xlsx, provided with Timæus and Moultrie (2012). Reverse survival fertility estimates were then compared for consistency to the total fertility rates used to project the population. The sensitivity was assessed by introducing a series of distortions in the projection of the population and comparing the difference implied in the resulting fertility estimates.
RESULTS
The reverse survival method produces total fertility estimates that are very consistent and hardly affected by erroneous assumptions on the age distribution of fertility or by the use of incorrect mortality levels, trends, and age patterns. The quality of the age and sex population data that is ‘reverse survived’ determines the consistency of the estimates. The contribution of the method for the estimation of past and present trends in total fertility is illustrated through its application to the population data of five countries characterized by distinct fertility levels and data quality issues.
1 United Nations, New York, U.S.A. E-Mail: [email protected].
CONCLUSIONS
Notwithstanding its simplicity, the reverse survival method of fertility estimation has seldom been applied. The method can be applied to a large body of existing and easily available population data ‒ both contemporary and historical ‒ that so far has remained largely under-exploited, and contribute to the study of fertility levels and trends.
1. Introduction
In order to study changes in fertility levels and trends in less statistically developed countries, demographers have developed a series of estimation techniques based on data from census counts and household surveys (Brass 1975, Moultrie et al. 2012, United Nations 1983). Since the launch of the World Fertility Surveys (WFS) program in the late 1970s (and especially since the implementation of the Demographic and Health Surveys (DHS) program), population specialists have mostly relied on the ever-growing body of household surveys that have collected full birth history to derive fertility estimates in these countries. Yet, as a recent study has shown (Avery et al. 2013), alternative methods of fertility estimation can return very consistent fertility estimates using only basic demographic information.
Among the existing methods of fertility estimation the reverse survival method is one of the most parsimonious. Based on population data by age and sex collected in one census or single-round survey, the method consists in ‘reverse surviving’ those no longer present in the population of a given age in order to derive the number of births that occurred n years ago, using a set of probabilities of child and adult survivorship and age-specific fertility rates (ASFRs). The reverse survival method of fertility estimation is very similar to the own-children method of fertility estimation (Cho et al. 1986), but its data requirement is even lower.
coverage (the whole national population), the population census remains a unique source for deriving fertility estimates for different geographic levels and/or socio-economic and cultural groups. However, given that the reverse survival method of fertility estimation is sensitive to migration, it should be stressed that its use at the local level may be limited (unless detailed migration data are available).
The present analysis is inspired by a series of studies of the own-children method of fertility estimation, the aim of which was to determine the effect of different factors on the fertility estimates (Cho 1973; Retherford, Chamaratrithirong, and Wanglee 1980; Abbasi-Shavazi 1997). The analysis pursued two main objectives. Using the Excel template FE_reverse_4.xlsx, provided with Timæus and Moultrie (2012),2 first the consistency of the reverse survival method of fertility estimation to estimate fertility levels and trends was investigated. Second, the sensitivity of the method to the effect of different types of data quality issues as well as erroneous assumptions (i.e., age patterns of fertility, levels and age patterns of mortality, effect of international migration, and age and sex population distribution) on the reverse survival estimates of fertility was assessed. In their presentation of the method, Timæus and Moultrie (2012) discussed briefly the use of erroneous mortality estimates, the importance of the quality of the age distribution, and the potential effect of international migration. No formal attempt was made to evaluate the effect of a series of distortions on the quality of the fertility estimates using the reverse survival method.
The paper is structured as follows: first the main computational steps of the reverse survival method of fertility estimation are introduced, following its presentation in Timæus and Moultrie (2012). Section 3 details the analytical strategy followed to test the consistency and sensitivity of the reverse survival fertility estimates. Section 4 presents the results of the consistency analysis, while the effect of each selected distortion is successively presented in Section 5. The contribution of the reverse survival method to the study of fertility levels and trends is then illustrated by the examples of five countries: Japan, Algeria, Mongolia, Ghana, and Kenya. The paper concludes with a discussion.
2. The method
This section borrows extensively from Timæus and Moultrie (2012).
In a population that is closed to migration, the births that have occurred n years ago can be estimated from the number of persons of a given age x and the mortality they were subject to. In other words, the population of age x are the survivors of the
2 The Excel template is available on-line:
children born n years ago. If the mortality experience of the children of a given age x is known, it is possible to estimate the number of births n years ago.
As explained in Timæus and Moultrie (2012), annual estimates of total fertility (TF) can easily be derived for a 15-year period preceding an inquiry from a population aged 0 to 14 by single years of age, a female population aged 10 to 64 by 5-year age group, a set of cohort survival probabilities, Lx, for children aged 0 to 14 for both sexes,
a set of survivorship ratios, 5Lx-5/5Lx, for adult women for each of the three 5-year
periods preceding the inquiry, and one or two age-specific fertility distributions, one of which applies to a date reasonably close to the index inquiry and the other to a date approximately 15 years prior to that.
The number of births in each year before an inquiry is first estimated using
𝐵𝑥+0.5= 𝑁𝐿𝑥 𝑥
𝑐 (1)
where x is the number of year before the inquiry, ranging from 0 to 14; Nx is the number
of children age x reported in the inquiry; and cLx a cohort survivorship that reflects the
age-specific mortality experienced in each year preceding the inquiry. Cohort survival can be estimated in different ways (from summary birth history data, full birth histories, etc.). In the Excel template provided with Timæus and Moultrie (2012), cohort survivorships are estimated from period mortality indicators using a relational logit system of model life tables.
Once the number of births in each year preceding an inquiry is estimated (numerator), a denominator—the mid-year number of women by 5-year age group ‒ needs to be estimated in order to compute a total fertility estimate. The mid-year number of women by 5-year age group for each period T+5 preceding an inquiry can be estimated from the number at T using
𝑁𝑥𝑓,𝑇+5
5 = 𝑁𝑥+5,𝑇
𝑓 5
𝑃𝑥,𝑇 5
(2) where x is the starting age of a 5-year age group, ranging from 10 to 60; T is the time period, ranging from 0 to 10; and 5Px,T is the survivorship between 5-year age groups at
time T computed as
𝑃𝑥,𝑇
5 = 5𝐿𝐿𝑥+5
5 𝑥
(3) The mid-year female population for each year preceding an inquiry can be estimated by linear interpolation between population estimates for each time period T
The estimates of total fertility for each year preceding an inquiry are obtained by distributing the number of births for a given year across the female 5-year age group populations of the same year. For each age group the proportion of total fertility needs to be estimated in order to derive the expected number of births to women in that age group if total fertility equalled one child per woman. The expected number of births is given by
𝐵𝑎∗,𝑥+0.5
5 = 5𝑁𝑎,𝑥+0.5∙ 5𝑓𝑎∗,𝑥+0.5 (4)
where x is the number of year before the inquiry, ranging from 0 to 14; a the age group, ranging from 15 to 45; and 5𝑓𝑎∗,𝑥+0.5 the percentage age-specific fertility rates (PASFR) scaled to one.
From equation (4) the total number of expected births for each year preceding an inquiry can be easily computed
𝐵𝑥+0∗ .5= � 𝑁5 𝑎,𝑥+0.5∙ 5𝑓𝑎∗,𝑥+0.5 45
𝑎=15
(5)
Using the number of births estimated for each year before the inquiry (equation (1)), the estimates of total fertility are finally obtained as
𝑇𝐹𝑥+0.5= 𝐵𝐵𝑥+0.5 𝑥+0∗ .5
(6) where x is the number of year before the inquiry, ranging from 0 to 14.
Since the method mainly relies on the population by age and sex, the poor quality (omission, age heaping, etc.) of the population data entering the computation will directly affect the resulting fertility estimates. Furthermore, important migration flows (both emigration and immigration) can also affect the estimation procedure by distorting the numerator and/or the denominator.
values of under-5 (5q0) and adult mortality (45q15) or of alpha and beta parameters
(defining the level of mortality relative to the standard life table and the slope of mortality in the standard life table, respectively).
3. Analytical strategy
A population was simulated to investigate the consistency and sensitivity of the reverse survival method. The simulation of a population allows for testing the effects of each parameter (mortality, fertility age patterns, migration, and distortions in age structure) entering the computation of the reverse survival fertility estimates. A wide range of situations found in contemporary populations can be considered.
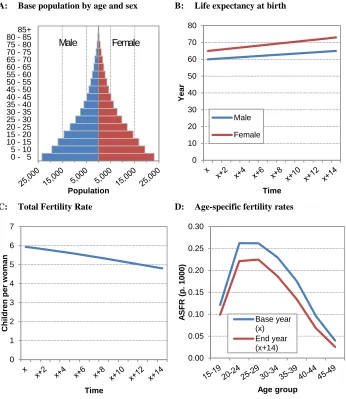
A simulated population was first projected over 15 years using a set of fertility and mortality age and sex patterns. The initial fertility age patterns return a TFR level of 5.935 children per woman and the age and sex mortality schedules correspond to a level of life expectancy at birth of 60 years for men and 65 years for women. The TFR and the life expectancy at birth by sex are projected linearly to reach 4.802 children per woman and 65 years for men and 73 years for women respectively at the end of the 15-year projection. The Coale and Demeny West Model life table was selected for age and sex mortality patterns. The population was projected assuming no international migration. The application PROJCT in MORTPAK was used to project the simulated population (United Nations Population Division 2013a). The resulting population by single age and sex obtained at the end of the projection horizon (15 years) was then reverse-survived to derive fertility estimates. Figure 1 summarizes the parameters used in simulating the population.
To estimate fertility using the reverse survival method, 5q0 and 45q15 were used as
Figure 1: Parameters used in simulating the population
A: Base population by age and sex B: Life expectancy at birth
C: Total Fertility Rate D: Age-specific fertility rates
Note: The Coale and Demeny West Model was used for age and sex mortality patterns
The analytical strategy consisted of two steps. The first step consisted of assessing if the reverse survival method produces consistent fertility estimates by comparing
0 - 5 5 - 10 10 - 15 15 - 20 20 - 25 25 - 30 30 - 35 35 - 40 40 - 45 45 - 50 50 - 55 55 - 60 60 - 65 65 - 70 70 - 75 75 - 80 80 - 85 85+
Population
Male Female
reverse survival estimates of fertility with the total fertility (TF) estimates that were originally used in projecting the simulated population. Given the ‘no international migration’ assumption, the reverse survival fertility estimates should be almost identical to the original TFRs. As we shall see later (Section 4), the application of the reverse survival method to the simulated population data did indeed produce highly consistent fertility estimates.
The second step consisted of testing the sensitivity of the fertility estimates given by the reverse survival method by incorporating different changes and distortions in the simulated population. First, the effect of assuming wrong age-specific fertility patterns on the reverse survival estimates of fertility was assessed. For this purpose a different set of age-specific fertility rates (ASFRs) was used to project the population. First, the percentage ASFRs (PASFRs) observed at the end of the projection period (Figure 1, Panel D) were held constant during the 15-year projection period. Second, a distinct set of fertility age patterns were used to project the population. The ASFRs that were originally selected present an early childbearing pattern (Figure 1, Panel D). Accordingly, a later childbearing pattern corresponding to the fertility age patterns of Italy in 1996 and 2010 was used (Human Fertility Database 2013).
Second, the effect of wrong mortality assumptions was investigated. Mortality levels and age patterns corresponding to the end of the projection levels were first held constant in the population simulation. To test the effect of assuming too low or too high mortality levels, mortality levels 10 and 20 years lower and 10 and 20 years higher were selected. The Coale and Demeny West Model life table was used in each assessment of the implication of wrong assumptions on the mortality level. The effect of the mortality age patterns was then tested by comparing the results given by each of the Coale and Demeny Model life tables.
In a third stage migration patterns were introduced in the simulated population in order to determine the effect of migration. Both emigration and immigration were considered. It was assumed that international migration reached a) 5% and b) 10% of the initial population, and follows a family-type Castro model (United Nations Statistics Division 2013a).
Finally, the effect of using a distorted age structure was considered. A distorted age structure was estimated based on population by single age and sex from 32 censuses conducted in 23 sub-Saharan African countries with a population above 680,000 between 1985 and 2003 (United Nations Statistics Division, n.d.) (Figure 2).3 The
3 The list includes 32 population censuses from 23 countries: Benin (1992 census), Botswana (1991 and 2001
distorted age structure shows a classic age heaping on age digits ending in 0 and 5, as well as an under-enumeration of young children and possibly of young male adults. As the application PROJCT in Mortpak requires 5-year age group population data for the base year population, the relative distorted age structure was applied to the simulated population obtained at the end of the projection period.
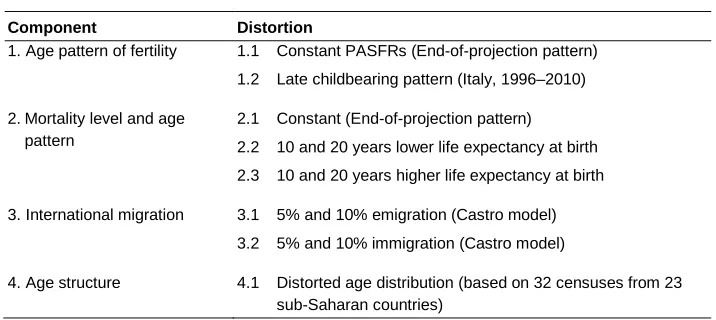
Table 1 summarizes each of the distortions discussed above.
The effect of each distortion was assessed separately (keeping the correct, original value for all other components) by comparing the simulated fertility estimates to the original reverse survival fertility values.
Figure 2: Distribution of the population by single age and sex based on 32 population censuses from 23 sub-Saharan African countries with a population above 680,000 between 1985 and 2003
Source: computed by author based on United Nations Statistics Division (n.d.)
census), United Republic of Tanzania (1988 census), Zambia (1990 census), Zimbabwe (1992 and 1997 census). 0.0 0.2 0.4 0.6 0.8 1.0 1.2 1.4 1.6 1.8
0 5 10 15 20 25 30 35 40 45 50 55 60 65 70 75 80 85+
Table 1: Selected distortions by demographic component
Component Distortion
1. Age pattern of fertility 1.1 Constant PASFRs (End-of-projection pattern) 1.2 Late childbearing pattern (Italy, 1996–2010)
2. Mortality level and age pattern
2.1 Constant (End-of-projection pattern) 2.2 10 and 20 years lower life expectancy at birth 2.3 10 and 20 years higher life expectancy at birth
3. International migration 3.1 5% and 10% emigration (Castro model) 3.2 5% and 10% immigration (Castro model)
4. Age structure 4.1 Distorted age distribution (based on 32 censuses from 23 sub-Saharan countries)
Both graphical examination and the mean percentage error (MPE) and its standard deviation (Std. dev.) were used to determine the goodness of fit of the distorted reverse survival fertility estimates. The results allow better understanding of the effect of each distorting factor on the reverse survival estimates of fertility.
Lastly, to illustrate the potential benefit of applying the reverse survival method to the large body of both contemporary and historical population data that are available to reconstruct fertility changes across the world, the method was applied to data from population counts in Japan, Algeria, Mongolia, Ghana, and Kenya. These countries were selected for their distinct fertility levels, data quality, and the large number of alternative fertility figures to which the reverse survival estimates could be compared.
4. Consistency
Figure 3: Total fertility estimates from the application of the reverse survival method to the simulated population and original total fertility values used to project the simulated population
Notes: see text for details.
5. Sensitivity analysis
In order to test the sensitivity of the reverse survival fertility estimates to the effect of different types of data quality issues as well as erroneous assumptions, the distortions presented in Section 3 were successively introduced, starting with the fertility age patterns.
5.1 Fertility age patterns
patterns in Italy in 1996 and 2010 was used (Human Fertility Database 2013). In the reverse survival method of fertility estimation, as the age-specific fertility rates are used in an ultimate step to distribute the number of births by women’s age group in order to compute total fertility estimates, they should play only a minor role in the estimation procedure and erroneous assumptions on this parameter should only marginally affect fertility estimates (Timæus and Moultrie 2012).
Figure 4 presents the percentage errors between the reverse survival estimates and the fertility estimates under the various assumptions in the age patterns of fertility. Mean percentage errors and standard deviations are given in the legend.
Figure 4: Effect of assuming wrong fertility age patterns on reverse survival estimates by time preceding the reference date
by assuming wrong age patterns of fertility have a maximum effect on fertility estimates of less than -0.075 children per woman.
5.2 Mortality levels and age patterns
5.2.1 Mortality levels
For the 15-year period preceding an inquiry, the reverse survival method of fertility estimation ‘reverse survives’ the population below age 15 and the female population aged 10–64 to derive fertility estimates under a set of mortality assumptions. Wrong mortality assumptions may potentially affect the levels of the fertility estimates. Hence, assuming too low a mortality level for the population under age 15 would result in an under-estimation of fertility, as less persons will be ‘resurrected’ during the 15-year period preceding an inquiry. To the contrary, if the assumed mortality under age 15 is too high, more persons are ‘resurrected’ and fertility will be over-estimated.
Five mortality distortions are examined. The first case examines the effect of keeping mortality constant at its level at the end of the simulation period. The second tests the effect of higher mortality levels by assuming sex-specific life expectancies 10 and 20 years lower than originally used to simulate the population. Finally, the effect of using levels of life expectancy 10 and 20 years higher than the original figures used in the simulation was considered.
According to the results presented in Figure 5, the effect of assuming wrong mortality levels has a somewhat larger effect on the fertility estimates. Yet taking mortality levels that depart significantly from the original levels produces a difference that reaches, at most, less than 2.5%. The error introduced by assuming wrong mortality levels has a maximum effect on fertility estimates of -0.136 children per woman—an error about double the one implied by assuming wrong age patterns of childbearing (see Section 5.1).
Figure 5: Effect of assuming wrong mortality levels on reverse survival fertility estimates by time preceding the reference date
The rather limited effect of assuming wrong mortality levels can be explained by the fact that the biases in the mortality estimates were introduced for both the population below age 15 and the female adult population that are reverse survived. Therefore, their respective effects on the estimates of total fertility largely cancel each other out.
5.2.2 Mortality age patterns
fertility estimates were computed using each family of the Coale and Demeny Model life tables (i.e., North, East, and South).
At a similar level of mortality, assuming the wrong mortality age pattern has an insignificant effect on the estimation of total fertility (Figure 6). The percentage error implied by selecting another Coale and Demeny Model life table reaches at most 0.15%; that is, less than +/-0.007 children per woman.
Figure 6: Effect of using inappropriate mortality age patterns on reverse survival fertility estimates by time preceding the reference date
5.3 International migration
estimates that are too high. To the contrary, in the case of an important selective female adult immigration the arrival of a large number of women without children would artificially inflate the denominator and under-estimate the total fertility level.
In order to test the effect of migration on the reverse survival fertility estimates, emigration and immigration were successively introduced in the simulated population, assuming that 1) international migration was following a family-type Castro model (United Nations Statistics Division 2013a); 2) international migration reaches 5% and 10% of the initial population4; and 3) migration is evenly distributed over the simulation period.
Migration has an important effect on the reverse survival estimates (Figure 7). In general, emigration has a slightly larger effect on the level of total fertility than immigration. If 5% of the base-year population is leaving the population over the 15-year horizon of the population simulation, the reverse survival estimates of fertility are on average 3.15% higher than the original reverse survival fertility values. This is due to the fact that a higher proportion of women of reproductive age are leaving the population compared to the population below age 15, and their departure produces an over-estimation of total fertility by artificially reducing the number of women included in the denominator. To the contrary, if 5% of the base-year population is added to the population over the 15-year horizon of the population simulation, the reverse survival fertility estimates are on average -2.73% lower than the original reverse survival fertility values, as more women of reproductive age are entering the population.
4 According to the Database on Immigrants in OECD and non-OECD Countries (OECD 2014), 102 countries
Figure 7: Effect of using various levels of international migration on reverse survival fertility estimates by time preceding the reference date
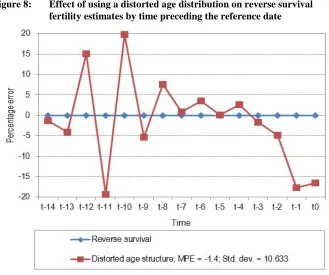
5.4 Distorted population structure
Fertility estimates from the reverse survival method are mostly driven by the quality of the population data entering the computation (Timæus and Moultrie 2012). As the previous sections have shown, the use of wrong assumptions in the age-specific fertility patterns and mortality levels and patterns only minimally affects the reverse survival estimates of fertility.
Figure 2 was applied to the simulated population obtained at the end of the projection period that is reverse survived.
The fertility estimates produced by the reverse survival of the sub-Saharan Africa-based saw-toothed age distribution are very different from the original series (Figure 8). The consistency of the reverse survival fertility estimates is mainly determined by the age distribution of the population below age 15. The reverse survival fertility estimates reproduce the problematic characteristics observed in the distorted population structure (i.e., classic age heaping on age digits ending in 0 and 5, and under-enumeration of young children).
6. Illustrations of the cases of Japan, Algeria, Mongolia, Ghana, and
Kenya
The cases of Japan, Algeria, Mongolia, Ghana, and Kenya were used to illustrate the potential gains of applying the reverse survival method of fertility estimation to a large body of existing data sources.
These five countries were selected for the distinct fertility situations they represent and the large number of alternative fertility figures to which the reverse survival estimates can be compared. Japan illustrates the application of the method to an ideal case: the quality of the age distribution and the fertility and mortality data is very high, and international migration is almost non-existent. Ghana and Kenya represent less statistically developed countries where data quality is more problematic. However these two countries are far from presenting the most inconsistent data, and their case is interesting as both countries have a large series of fertility estimates available from alternative sources against which the reverse survival fertility estimates can be compared. Algeria and Mongolia illustrate an intermediary situation where age distribution, fertility, and mortality data are of good quality (although not perfect) and where alternative fertility estimates are also available to assess the performance of the reverse survival method.
For Japan, fertility estimates were computed using the reverse survival method and the population data by age and sex given in the Human Mortality Database (HMD) and the observed age and sex mortality data and ASFRs from the HMD and the Human Fertility Database (HFD), respectively.5 For the other countries, age-specific fertility and mortality estimates from the World Population Prospects: The 2012 Revision
(United Nations Population Division 2013b) and population data by age and sex from various censuses were used. For these countries, the fertility estimation was performed using the Coale-Demeny West Model, calibrated on the national life expectancies at birth.
5 Reverse survival estimates of fertility were computed using the population by (single) age and sex every 10
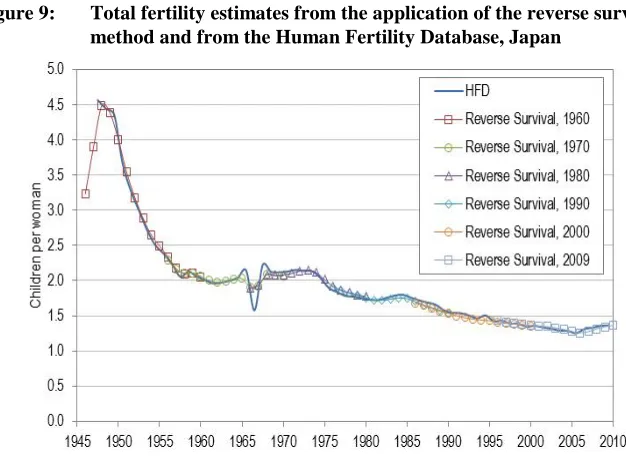
6.1 Japan
Figure 9 shows the fertility estimates resulting from the application of the reverse survival method to the Japanese population data by age and sex with total fertility estimates from the HFD serving as the ‘gold standard’. The two series of estimates are very close. Given that the reverse survival estimates were computed based on population data ten years apart, the fertility estimates from the reverse survival method (as implemented here) cannot, evidently, replicate all annual variations recorded in the period TFR series (e.g., the important variations between 1965 and 1967)6. Yet it succeeds in reproducing correctly the main fertility trends and levels. Indeed, the consistency between the two series is impressive. Furthermore, the reverse survival estimates of fertility are almost identical when two distinct series overlap.
Figure 9: Total fertility estimates from the application of the reverse survival method and from the Human Fertility Database, Japan
Source: Author’s computations based on HMD and HFD data.
6 These variations are due to popular beliefs related to the traditional astrological lunar calendar. 1966 was the
6.2 Algeria
For Algeria, the five most recent population censuses were used (i.e., 1966, 1977, 1988, 1998, and 2008).7 As only aggregated population data from these censuses are available (United Nations Statistics Division 2013b) these were first smoothed using the Arriaga method8 in the PAS spreadsheet AGESMTH.xls (U.S. Census Bureau 1994), before being interpolated using the Sprague osculatory method.9 These data allow reconstructing fertility estimates from 1951 to 2008 for Algeria.
Figure 10 shows the results of the application of the reverse survival method of fertility estimation to Algerian population census data. Total fertility estimates from other data sources and/or estimation methods are also given for comparison and consistency purposes.
First, there is an impressive consistency in the total fertility estimates computed from different methods and/or data sources. The reverse survival fertility estimates reproduce well the fertility levels and trends: the fertility decline is consistent with that successively reported by the vital registration system in the Annuaire Statistique de l’Algérie (Office National des Statistiques (ONS series on Figure 8)) as well as by various sample surveys (PAPCHILD, EASF, and MICS). Furthermore, the reverse survival fertility estimates also succeeded in consistently reproducing the recent fertility increase observed in the country (Ouadah-Bedidi and Vallin 2012).
While it is true that using smoothed and interpolated population data removes most of the variation between ages, the consistency between fertility estimates from successive censuses highlights the contribution of the reverse survival method to deriving fertility estimates solely from population data by age and sex.
7 Earlier census operations are either not easily available and/or covered only specific categories of the
population (Non-Algerians or Moslems).
8
The Arriaga method is a smoothing method that accepts the enumerated population in each 10-year age group. The formula assumes that a second-degree polynomial passes by the midpoint of each three consecutive 10-year age groups and then integrates a 5-year age group (Arriaga et al. 1994: 23–24).
9 The Sprague method is an osculatory interpolation method that is used to derive population data by single
Figure 10: Total fertility estimates from the application of the reverse survival method to population census data and estimates from other sources, Algeria, 1951–2011
6.3 Mongolia
For Mongolia, the population data by single year of age and sex from the seven most recent population censuses (i.e., 1956, 1963, 1969, 1979, 1989, 2000, 2010) were used to compute reverse survival fertility estimates (State Statistical Office of Mongolia 1994, NSO 2012). As the population data by age and sex are not smoothed and/or interpolated, the fertility estimates mirror the data quality recorded in the censuses.
Figure 11: Total fertility estimates from the application of the reverse survival method to population census data and estimates from other sources, Mongolia, 1941–2011
Given the simplicity of the method, the contributions of the reverse survival method of fertility estimation to the study of fertility changes are significant. Not only does the reverse survival method of fertility estimation provide fertility levels and trends that are consistent for recent periods, but it also allows assessing the quality of information on birth declarations recorded in the Mongolian civil registration system, as well as lifting the veil on what happened to fertility in periods (before 1960) for which no reliable estimates are available from the civil registration system. While the dip in total fertility observed in the mid-1940s should be interpreted in reference to quality issues of the age data, a total fertility level of 4–4.5 children per woman in pre-transitional Mongolia is likely.10
10 Coupled to high infant and child mortality, a total fertility level of 4–4.5 children per woman would be
6.4 Ghana
Population data by single year of age and sex from the 1960, 1970, 1984, 2000, and 2010 censuses of Ghana were used to derive reverse survival fertility estimates from 1945 to 2010 (United Nations Statistics Division 2013b; Ghana Statistical Service 2013). The reverse survival fertility estimates mirrored the quality of census data, especially the under-enumeration of young children and/or age heaping. Despite important annual variations, the reverse survival fertility estimates are fairly consistent with total fertility estimates derived from sample surveys and other indirect methods (Figure 12), and highlight the contribution of the method to studying fertility trends and levels in periods for which limited information is available.
6.5 Kenya
For Kenya, the population by single age and sex from the last five censuses (i.e., 1969, 1979, 1989, 1999, and 2009) was used to compute reverse survival fertility estimates (United Nations Statistics Division 2013b). Once more, while the patterns of under-enumeration of young children and age heaping are evident, the reverse survival fertility estimates are generally in line with alternative fertility figures (Figure 13).
Figure 13: Total fertility estimates from the application of the reverse survival method to population census data and estimates from other sources, Kenya, 1955–2009
7. Conclusion
patterns, the method could potentially be applied to a wide range of existing data sources, both contemporary and historical.
In order to assess the reverse survival method of fertility estimation, a population was first projected over 15 years. The projected population below age 15 was then reverse survived to obtain fertility estimates using the Excel template provided with Timæus and Moultrie (2012).
Confirming the consistency of the method, it was first shown that the reverse survival method produces fertility estimates that are very close to the original values used to simulate the population.
The sensitivity analysis confirmed that neither the selection of incorrect age-specific fertility patterns nor the use of incorrect mortality levels, trends, or age patterns significantly affect the reverse survival fertility estimates. However, international migration and a distorted age structure have a significant effect on the estimated figures of total fertility, as they directly modify the population by age and sex.
The five selected cases of Japan, Algeria, Mongolia, Ghana, and Kenya illustrate the contribution of the reverse survival method to estimating total fertility. The ‘ideal’ case of Japan shows that where fertility, mortality, and population data are of high quality and there is little international migration,11 the reverse survival method produces highly consistent total fertility estimates.
In the remaining four countries (Algeria, Mongolia, Ghana, and Kenya), the application of the reverse survival method to census data can serve to estimate fertility levels and trends and/or corroborate existing fertility estimates from other sources (sample surveys) for periods during which little is known. Therefore the comparison of fertility estimates from multiple sources works as a validation procedure for various independent estimates and can ultimately be used to produce a reference series of total fertility using a local smoother.
One might wonder whether there is a need to revive an indirect fertility estimation method based on census data. As we move into the future it is likely that vital registration systems will be developed and more sample surveys will be carried out in an increasing number of countries. Yet at present more than a third of global births are unregistered and in many countries the registration of birth information is incomplete (United Nations Statistics Division 2012). Sample surveys are not without problems, despite their evident role in and contribution to providing demographic data (Hull and Hartanto 2009, Spoorenberg 2014). Moreover, they cannot provide reliable fertility estimates for a series of disaggregated analytical levels due to sample attrition. However, as the reverse survival method of fertility estimation is sensitive to migration,
11 In small countries where international migration is more significant—as is the case, for example, in
it should be stressed that it may be of limited use at the local level (unless detailed migration data are available).
References
Abbasi-Shavazi, M.J. (1997). An assessment of the own-children method of estimating fertility by birthplace in Australia. Journal of the Australian Population Association 14(2): 167–185. doi:10.1007/BF03029338.
Arriaga, E.E., Johnson, P.D., and Jamison, E. (1994). Population Analysis with Microcomputers: Presentation of Techniques. Washington, D.C: Bureau of the Census.
Avery, C., St. Clair, T., Levin, M., and Hill, K.H. (2013). The ‘Own Children’ fertility estimation procedure: A reappraisal. Population Studies 67(2): 171–183.
doi:10.1080/00324728.2013.769616.
Azumi, K. (1968). The Mysterious drop in Japan’s birth rate. Trans-action 5(6): 46–48.
doi:10.1007/bf02818926.
Brass, W. (1975). Methods for Estimating Fertility and Mortality from Limited and Defective Data. Chapel Hill: International Program of Laboratories for Population Statistics.
Cho, L.J. (1973). The Own Children Approach to Fertility Estimation: An Elaboration. Paper presented at the International Union for the Scientific Study of Population, International Population Conference, Liège.
Cho, L.J., Retherford, R.D., and Choe, M.K. (1986). The Own-children Method of Fertility Estimation. Honolulu: University of Hawaii Press.
Ghana Statistical Service (2013). 2010 Population and Housing Census. Demographic, Social, Economic and Housing Characteristics. Ghana: Ghana Statistical Service.
Hodge, R.W. and Ogawa, N. (1991). Fertility Change in Contemporary Japan. Chicago: University of Chicago Press.
Hull, T.H. and Hartanto, W. (2009). Resolving contradictions in Indonesian fertility estimates. Bulletin of Indonesian Economic Studies 45(1): 61–71. doi:10.1080/ 00074910902836197.
Human Mortality Database (2013). Human Mortality Database [electronic resource]. University of California, Berkeley (USA), and Max Planck Institute for Demographic Research (Germany). www.mortality.org.
Judson, D.H. and Popoff, C.L. (1975). Selected General Methods. In: Swanson, D. and Siegel, J.S. (eds.). The Methods and Material of Demography. San Diego, CA: Academic Press: 677–732.
Kaku, K. (1975). Increased induced abortion rate in 1966, an aspect of a Japanese folk superstition. Annals of Human Biology 2(2): 111–115.
doi:10.1080/03014467500000651.
Kaku, K. and Matsumoto, Y.S. (1975). Influence of a folk superstition on fertility of Japanese in California and Hawaii, 1966. American Journal of Public Health
65(2): 170–174. doi:10.2105/ajph.65.2.170.
Moultrie, T.A., Dorrington, R.E. , Hill, A.G., Hill, K.H. , Timæus, I.M. , and Zaba, B. (eds.) (2012). Tools for Demographic Estimation. Paris: International Union for the Scientific Study of Population.
National Statistical Office of Mongolia (2012). 2010 Population and Housing Census of Mongolia. Chapter 1. Table 1.1. Population by age, sex and residence [electronic resource]. http://arcgis.nso.mn/census/.
Neupert, R. (1996). Population Policies, Socioeconomic Development and Population Dynamics in Mongolia. Canberra: Research School of Social Sciences, Australian National University.
OECD (2014). Database on Immigrants in OECD and non-OECD Countries: DIOC [electronic resource]. http://www.oecd.org/migration/Files%201-4_DIOC-E_3_ Full%20Dataset_new.zip.
Ouadah-Bedidi, Z. and Vallin, J. (2013). Fertility and Population Policy in Algeria: Discrepancies between Planning and Outcomes. Population and Development Review 38: 179–196. doi:10.1111/j.1728-4457.2013.00559.x.
Retherford, R.D., Chamratrithirong, A., and Wanglee, A. (1980). The impact of alternative mortality assumptions on own-children estimates of fertility for Thailand. Asia-Pacific Census Forum 6(3): 5–8.
Spoorenberg, T. (2014). Reconciling discrepancies between registration-based and survey-based fertility estimates in Mongolia. Population Studies forthcoming. State Statistical Office of Mongolia (1994). Population of Mongolia. Ulaanbaatar: State
Timæus, I.M. and Moultrie, T.A. (2012). Estimation of fertility by reverse survival. In: Moultrie, T.A., Dorrington, R.E. , Hill, A.G., Hill, K.H. , Timæus, I.M. , and Zaba, B. (eds.). Tools for Demographic Estimation. Paris: International Union for the Scientific Study of Population.
U.S. Census Bureau (1994). Population Analysis System [electronic resource]. Washington, D.C.: U.S. Census Bureau, International Programs. http://www. census.gov/population/international/software/pas/.
United Nations (1983). Manual X: Indirect Techniques for Demographic Estimation. New York: United Nations, Department of International Economic and Social Affairs.
United Nations Population Division (2013a). MORTPAK for Windows, Version 4.3 [electronic resource]. New York: United Nations. http://www.un.org/en/ development/desa/population/publications/mortality/mortpak.shtml.
United Nations Population Division (2013b). The World Population Prospects: The 2012 Revision. New York: United Nations.
United Nations Statistics Division (2012). Coverage of Birth and Death Registration [electronic resource]. New York: United Nations, Department of Economic and Social Affairs, Statistics Division, Demographic Statistics Section.
http://unstats.un.org/unsd/demographic/CRVS/CR_coverage.htm.
United Nations Statistics Division (2013a). Migration Worksheet – UNPD_Migration Age Patterns.xlsm [electronic resource]. New York: United Nations, Department of Economic and Social Affairs, Statistics Division, Available online (last accessed 30 January 2014): [http://unstats.un.org/unsd/demographic/meetings/ wshops/China/2013/docs/Session%2005%20Projecting%20age%20patterns/Mig /UNPD_Migration%20Age%20Patterns.xlsm]
United Nations Statistics Division (2013b). United Nations Demographic Statistics Database, Table B01. Population by sex and urban/rural residence. In: United Nations Statistics Division (ed.). Demographic Yearbook: Population Censuses' Datasets (1995–Present). New York: United Nations, Department of Economic and Social Affairs, Statistics Division, Demographic Statistics Section.