are some problems, please let us know and we will correct that.
Rothamsted Experimental
Station Report for 1971 Part
2
Full Table of Content
The Agdell Experiment, 1848-1970 Estimates of the P and K
Accumulated from Fertiliser Dressings Given Between 1848
and 1951, Their Recovery by Grass Between 1958 and 1970,
and Their Effect on the Response by Grass to New Dressings
of P and K
A. E. Johnston and A. Penny
The Agdell Experiment, 1848-1970 Estimates of the P and K Accumulated from Fertiliser Dressings Given Between 1848 and 1951, Their Recovery by Grass Between 1958 and 1970, and Their Effect on the Response by Grass to New Dressings of P and K, A. E. Johnston and A. Penny (1972) Rothamsted Experimental Station
Report For 1971 Part 2, pp 38 - 68 - DOI: https://doi.org/10.23637/ERADOC-1-37287
The Agdell Experimeng 1848-U)70
Estimrt€s of the
P
a
l
K
accumulated from fertiliser tlressings given between 1848 and 1951, their recoYery by grrss between 1958 and 1970,8
l their effect onthe response by grrss to new rlressings of P and K
A.
E. JOHNSTON andA'
PENNYIncreased agricultural production during the
l8th
and earlyl9th
centuries owed muchto the practice of growing crops
in
rotation. To tryto
explain someof
these benefits, Lawes and Gilbert started a rotation exlxriment on Agdell Fieldin
1848, to comparewith others in which the same crop was gtown each year. On six large plots they tested two crop rotations, only one phase each year, and three manurial treatments' One
rotation was the traditional Norfolk 4course:
roots, barley, clover or beans, winter wheat (the 'clover rotation'); in the other the legume was replaced by a fallow:
roots, barley, fallow, winter wheat (the 'fallow rotation').
The roots weri swedes or tumips, variety as on Barnfeld, the varieties of barley and
of
winter wheat were those used
on
Hoosfeld and Broadbalk. The clover was usuallyundersown in the barley on appropriate plots; when
it
failed,it
was replaccd by springbeans. The threc manurial treatments were: unmanured (plots 5 and 6); P only, changed
to PKNaMg in 1884 (plots 3 and 4); and NPKNaMg (plots
I
and 2), the N was given asa mixture
of
ammonium salts and rape cake, which also supplied some P andK.
Incontrast
to
the other Classical experimensin
which the same manures were applied every year, only the root crops were manured in the Agdell experiment.In
the Norfolk,l-couise rotation some
of
the nutrients appliedfor
the roots were recycledby
sheepeating the crop on the land, and Lawes and Gilbert compared this on half Plots with the
othei halves from which the crop was removed. The weattrer was often unsuitable for
folding sheep on the hea\T soil on Agdell and when this was so the roots and tops were sliced
ind
spread over the half plot. This comparison stopped for tlre l5th root crop in1904, since when the crop was removed from the whole plot.
Lawes and Gilbert presented detailed yields and nutrient uptakes from this experiment
only once (t awes
&
Gilbert, 1894), though they used both yields and soil analyses toi
uatrate arguments, especially about nitrogen, in other papers. Warren (1958) described the experimint up to 1957 and gave more detailed soil analyses. The rotation experiment endedin
l95l
because the manuring was no longer relevantto
modern farming, and yields of swedes on plotsI
and 2 were affected by soil acidity caused by repeatedly giving ammonium salts.Between 1951 and 1958 no further P and
K
were given; the plots were fallowed in1952 and grew barley without N in 1953. From analyses of soil samples taken in spring
1953, a soll pH map was prepared and a liming scheme suggested to neutralise acidity on plots
I
and 2 and the southern halves of plots 3 and 4. More chalk was applied in1959 ard 1967. The amounts (cwt,hcre) applied to plots
l,
2, 3 and 4 were:14
South
half
South halfl0
l0 to 3000
46
462
Alt
80 36 46
Plot
IYear
All19s4
601959
36THE AGDELL
EXPERIMENT, I848_1970 Between 1954 and 1957 the crops grown were barley in 1954 and spring wheatin
1955both with basal N, beans lvithout
N in
1956 and potatoes with basalN
in 1957. Cerealyields were small; Warren (1958) gave the yields
of
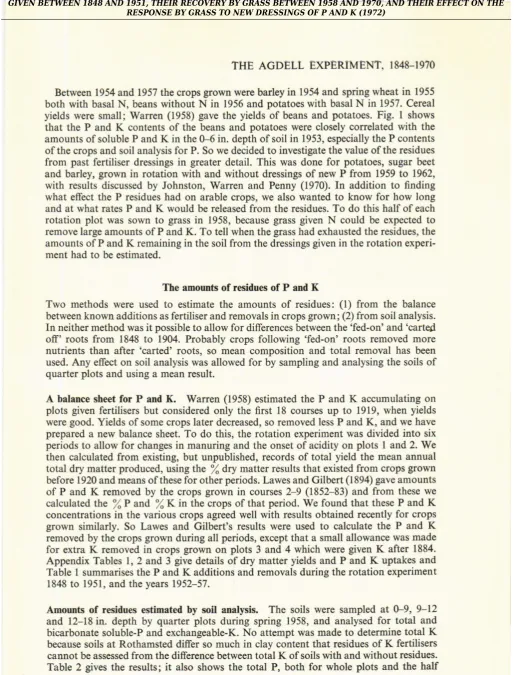
beans and potatoes. Fig.I
showsthat the P and
K
contentsof
the beans and potatoes were closely correlated with theamounts of soluble P and K in the 0_6 in. depth ofsoil in 1953, especially the P contents
ofthe crops and soil analysis for P. So we decided to investigate the value ofthe residues from past fertiliser dressings in greater detail. This was done
for
potatoes, sugar beetand barley, grown in rotation with and without dressings of new P from 1959
to
1962,with results discussed by Johnston, Warren and Penny (1970).
In
additionto
finding what effect the P residues had on arable crops, we also wanted to know for how longand at what rates P and
K
would be released from the residues. To do this half of eachrotation
plot
was sownto
grassin
1958, because grass givenN
could be expected toremove large amounts ofP and K. To tell when the grass had exhausted the residues, the amounts of P and K remaining in the soil from the dressings given in the rotation experi-ment had to be estimated.
The amounts of residues of P and
K
Two methods were used
to
estimate the amountsof
residues:(l)
from
the balancebetween known additions as fertiliser and removals in crops grown; (2) from soil analysis.
In neither method was it possible to allow for differences between the 'fed-on' and 'carted
off'roots
from
1848to
1904. Probably crops following 'fed-on' roots removed more nutrients than after 'carted' roots, so mean composition and total removal has been used. Any effect on soil analysis was allowed for by sampling and analysing the soilsof
quarter plots and using a mean result.
A
balance sheet for P ardK.
Warren (1958) estimated the P andK
accumulating on plots given fertilisers but considered only thefirst
18 courses upto
1919, when yieldswere good. Yields of some crops later decreased, so removed less P and K, and we have prepared a new balance sheet. To do
tlis,
the rotation experiment was divided into six periods to allow for changes in manuring and the onset of acidity on plots 1 and 2. We then calculated from existing, but unpublished, records of total yield the mean annual total dry matter produced, using the % dry matter results that existed from crops grownbefore 1920 and means ofthese for other periods. Lawes and Gilbert (1894) gave amounts
of P and
K
removed by the crops grown in courses 2-9 (1852-83) and from these wecalculated the yoP and
/"K
in
the crops of that period. We found that these P andK
concentrations in the various crops agreed well with results obtained recently for cropsgrown similarly. So Lawes and Gilbert's results were used
to
calculate the P andK
removed by the crops grown during all periods, except that a small allowance was made
for extra
K
removed in crops grown on plots 3 and 4 which were givenK
after 1884.Appendix Tables 1,2 and 3 give details
ofdry
matter yields and P andK
uptakes andTable 1 summarises the P and
K
additions and removals during the rotation experiment1848
to
1951, and the years 1952-57.Amounts
of
residues estimated by soil analysis. The soils were sampledat
0_.9,9-12and 12-18
in.
depth by quarter plots during spring 1958, and analysedfor
total and bicarbonate soluble-P and exchangeable-K. No attempt was made to determine totalK
because soils at Rothamsted differ so much in clay content that residues ofK
fertiliserscannot be assessed from the differenct between total K of soils with and without
residues-Table 2 gives the results;
it
also shows the total P, bothfor
whole plots and the halfROTHAMSTED REPORT
FOR I97I,
PART 2 Bean grainPotato tubers
o
I
o
;30
oo
E
i20
I
Y
a
o
c.
;10
oo
E
o o
G
i-s
o.
o
o
.E 10
E(,
o
E E
o o
\R
o-o
510
150
100
200
2soP, ppm, solubh in
O.5M-NaHCO3
K, pprn, solubb in lf,_ ammonium acetate- Frc.-I. _Rcla_tioDship b€tween P and K coDtent of beans and potato€s aDd rcadily soluble-p and -K itr the soil of Agdell Field, Rothamsted, 195G57.
41:t
s
.Eloo
!,
o
E
(,
E
(,
(o
i-so
THE
AGDELL ,1848-1970s8
3$
R8
I
I
I
I
.J
r6
-{
{
h E :r<h@\oo\ F !r 00o0r-6
'i E G;;:..l.l
:G&+A:
3o
++++
I
a+a+
ll
Ei: o oo.r.r \a o
I >r Fht.l.{ -!
rtoa6\oc^-Sl
+++
I'I
I
i+i+
l?
€gi
Sssxa=
*BE;eB
-E6 Fh-FN-
^rFtho.l
EEE +++i'lr
T+;+l-i
F
z
4..
o\
I
\i
t
\
.s
!aF <B
Fr-\t
E
s
ct
.s
"d
v
q
Iri
o\
!P
- 90
i gE
xi
:
!z .s
I
U
o\oi\ooca -Fto\6F
oo-oa 6r \osfF<.Far\ \oa h \oe{- 60\@F oal
03
ii()5
t.o.o +--
D-.-*..--or
Y
N:e{-.l td
tFh\otsO hh!t666 = -F\OrlO^r E F
.c < ..r 6
i=eft+iii55++ti
F
-
22XX22
22*X22
*e
*r
F
2
E
I
88oooc
"
3 eeoooo
-B
++
,E
Baaaoo
<E
:c9
o,:4.9=; {AE9 io
? z
a
zE
o E
E
--e
- u
d
cc
': c
.
':0
5
-a -
Ea-
3€
F-
b=o.ato.>6e>o-A>
xo.6o=EA=o
o=
c. F
F, }'
4t
ROTHAMSTED REPORT
FOR I97I,
PART 2plots.where grass was later grown, and exchangeable
K
in lb/acre for the 0-18 in. depthof soil. We used 2 348 000 and 2 448 000 lb/acre as the weights of fue soil for the
0-f
in.ald
9-18in.
depths respectively, as given by Hall (1905). These weights are less thanthose of the soils on Broadbalk because the Agdell soils contain more stones.
Soil analyses related to nuhietrt bshnces
Phosphorus. Fig. 2 shows a satisfactory agreement b€tween the gains and losses of
p
between 1848 and 1958 and the total P in the 0-18 in. depth of soil. There are too few
results to relate satisfactorily mean annual gains and losses with bicarbonate soluble-p,
-4OO -3OO -2OO
-lOO O
l0O
2OO 3OO
/loo 5(x) 600
?OO 8OO Crains(+)and losses(-)ot P. lb/acre, 1a/8- 1958Frc. 2- Relationship bet$een loss€s and gaiDs of phosphorus 0b/acre) between lg48 and 1957 and the
total P (lb/acre) in the 0-18 in. depth of soil io 1958 on Agdell Fiild, Iiothamstcd.
as Williams and Cooke (1971) did for the Rotation
I
soils at Saxmundham. However,their results and ours
for
Agdell can be combined. Fig. 3 shows that the relationshipbetween annual gains and losses of P and bicarbonate soluble-P in the 0-9 in. depth
of
soil is linear, confirming Williams and Cooke's deduction. Fig. 3 also shows that, from
these combined results, the soils
will
contain 9 ppmof
sodium bicarbonate soluble-p when losses in crops are just balanced by additions of fertiliser-P, a value slightly lessthan the 10 ppm obtained from the Saxmundham results alone. 42
@
:
€
;
o
>
d
THE AGDELL
EXPERIMENT, 1848-1970Potassium. Fig-
4
showsa
linear relationship betweel- exchangeableK-in.the
0_,
i;l;il
oi i"oitin
tsst
and the calculated mean annual balance between additionsofi"rtifi"i-f
unaf
removed in the crops between 1848 and 1957. Fig. 4 also comparesilil".;;;rG
given by Williams and Cboke (1971) for the. soilsof
RotationI
atSax-;rrdi;;;d'Lilofio.to,
(1969)for
the droadbalk soils a-t Rothamsted'with
allih;;;"rp".i-;r;t'there
is a linear ielationship but the slopes of the lines differ' and theo
z
*zo
o .;f
91o
OL
-5
Gains (+, and lc€sF, of P. lb/.crc, edl
F{
Frc. 3. RelatiotrshiD betlve€n .troual Saios and losses of phosphorus ob/aqe) aod P soluble itr sodium bicarbonate solution in thc 0-9 io. depth of soil.
.)
sermutrdhao Rotation I 189-f969 soils sampled 1969i
notlimsr"a ega"u l84E-1957 soils sa$pled 1958'Saxmundham soil differs from ttre other two more than they from
€ch
other' However'i;;;;;il;t
*h""
K
removed in crops is balanccd bvK
added as fertiliser, all threeof
iL"."
oiaa..tt"
toils would containiround
150 ppm of exchangeableK'
The grass exPeriment' 1958-70The six plots of the rotation experiment were divided into west and east halves in spring
i958;;e;;;
was grown on oie half of each plot from 1958 to 1970' The gass was given 0'8 cwt N/acre for each cut taken at silage stage.The experiment can be divided into two periods:
(l)
1958to
1963 when the grass measured the combined effects of P andK
residues:ROTHAMSTED REPORT
FOR I97I.
PART 2E
.E
E
200E
E
s
!E
I
looY
cains(, arld losses (_) of K. tb/acre,each year
- -Frc. 4. Rrlatio,ship betweetr aDnual gaiDs-atrd lo.ses of potassium 0b/a6e) atrd K exchangeabre to
llv-ammo um acetate in the 0-9 io. depth of soil.
O Saxmutrdhao RorarioE I1899_t969 soils samDled t969,
^
Rothassted Agdeu 1848_t957 soils saEDled l'gss_A
Rotbaosted Broadbajk I8,t+_1957 soils;ampled 1966,(2)
1964to
1970 when the separate effectsof
p
andK
residues were measured bv givingK
and P, in addition to N, to sub-plots testing p andK
respectively. Three amounts each of new p andK
were also tested.The first period, 1958_6j
Italian.ryegrass (!22) was grown
in
1958-59, cocksfoot (S3Z)in
196H3,
and Table 3show the yields of dry grass each year.
Italian ryegrass
(sx2),19*-59.
Sown in spring 195g the ryegrass established welr andtwo cuts were taken 0ate July, rate october). Table 3 shows
ihit,
with each old manurial treatment, yields were much the same whether after the fallow or clover rotation. Thestarv€d soils produced
a
little
more than 30 cwt/acreof
dry
gass, whereas thepK
and NPK plots yielded 45 and 53 cM/acre respectively.
Tablj
l-shows that bothNpK
plots contain more P than the corresponding pK plots, whereas the NpK- and pK_fallow
plots contain more
K
than the NpK- and pK-clover plots. The larger yields of g"sso,
the
NPK
plots, irrespectiveof
previous rotation, therefore s"pp-ort- Warren,i ll9SSy4
oL_
THE AGDELL
EXPERIMENT, I&E_T970TABI.E 3
Yielils (cwtlacre\ of dry grass on Agdell, Rothatnsted, 195843
Old trestrelt!, 18,t8-1951
NPK
NooeItalian ryegass (S22)
Rotatioo ivith fallow Rotatioo with clover
1958 (2 cuts) 1959 (3 cuts)
MeaD annual yield, 1958-62
Effecr of residues
34.1 45-9
53.843.1 63.6
66.831.4
41.6
52.4
22.0
59.6
58.7.0
36.1
45.033-6 62.6
59.630.5 60'0
68.62.1
5.6
6.125.7 52-4
56.926.7
31.2Cocksfoot (S37) 1960 (2
cuts)'
7'l
35.4
49'31961 (3
cuts)
37.7 4.8
71.31962 (3
cnts)
403
67'4
69'91963 (1
cut)
3.8
45
2.132.5 55.2
4.2
D..7
29.7* Two cuts from NPK plots, only one from olher plots.
deduction, from the yields of beans and potatoes, that shortage of P rather than
of K
limited yield on the other plots.
In
1959 three cuts were taken, in late May, early July and late August. Theunmanured-fallow plot yielded 43 cwt/acre of dry grass, but the unmanured clover plot only 22 cwt/
acre. This difference must be because the uDmanured-fallow plot still had more P and K
than the unmanured-clover plot from which the legumes removed P and
K
during therotation experiment. Yields were more than doubled by the residues but they were 4 and
8 cwt/acre smaller after clover than after fallow on the PK and NPK plots respectively. Thus, after growing grass for one year the larger PK residues on the fallow rotation plots
were affecting yield. More than halfthe yield in 1959 came from the first cut and the third
cut produced only 3-12 cwt/acre, so the ryegrass was ploughed in during November.
CocLdoot (S37),
196H3.
Cocksfoot was sown in earlyApril
1960 and dressed with N in May. The grass established well on the NPK plots but badly on the others and parts of them were resown late in June. On the NPK plots the grass was cut and weighed latein July, when on the others it was topped to encourage tillering, and all were topdressed with N.
All
plots were cut late in September, so yieldsfor
1960 (Table 3) are from twocuts on the NPK plots and one on the others. Yield on the starved soil was only 7 cwt/
acre after the fallow and I
I
cwt/acre after the clover rotation. The clover plot probablyyielded more because the grass established better. Later, when once established, the grass
yielded more on the unmanured-fallow
plot
which contained more P andK.
Yields on the PK and NPK plots were 36 and 47 cwt/acre respectively.In
196l the cocksfoot was wel[ established on all plots and the first cut was taken at mid-May, followed by cuts in July and September. Table 3 shows that the starved soilsproduced five times as much as
in
1960 after the fallow rotation (38 cwt/acre) and threetimes as much (34 cwt) after the clover, but, even so, the residues in the PK plots
in-creased yields to 63 cwt acre after both rotations. Yield was further increased to
7l
cwt/acre by the residues on the NPK-fallow plot.
Table 3 also shows that total yields from three cuts
in
1962 (early June, mid-August and early October) were much the same asin
1961. The unmanured-fallow plot yietdedt0 cwt/acre more than the unmanured-clover plot and the residues increased yields to
between 60 and 70 cwt/acre.
ROTHAMSTED REPORT FOR
I97I,
PART 2The severe winter of 1962-63 killed much ofthe cocksfoot and after one cut, maximum yield was only 6 cwt/acre, the grass was destroyed
with
paraquat and the land wasploughed during the autumn.
Mean yields, 1958-62. Table 3 shows mean annual yields
of
dry grassfor
the years1958-52. On the unmanured, PK and NPK plots after the fallow rotation
felds
were6.8, 2.8 and 5.3 cwt/acre more each year respectively than after the clover rotation,
because the fallow plots had lost less P and K during the rotation experiment l348-1951. The mean annual gains from the PK residues were 22.7 and 26,7 cwtlacre on the
pK-plots and 29.7 and 31.2 cwtlacre on the NPK-plots after fallow and clover respectively.Averaged over all treatments, the annual gain from the PK residues was 27.6 cwt/acre
ofdry
grass, i.e. the PK residues doubled the yield obtained on unmanwed plots. This result can be compared with the effects of the residues on beans (an extra 14.1 cwtlacre grain)in
1956 and on potatoes (an extra 9.5 tons/acre tubers)in
1952. The residuesincreased the yield of beans by three times and of potatoes by 3.5 times.
Nutrients removed, 1958-63. Table 4 shows the amounts of P and
K
removed by thegrass between 1958 and 1963 and the extra uptake from the residues.
TIELE 4
Amounts
ofP
and K removed each yearb,
,he grass gtown on Agdell,Rothomsted, 195843
Rotation with fallow Rotation with clover
t.2 5-2 5.9 0.6 4.5 26.9 PK 14.1 13. I
104 t4-2
14.5
1.2
18.4 15.
l
14.6 16.2 16.5 0.6 13.6 81.4 54.5 NPK 16.7 t2.lt2.l
t3-2 14.9 1.5NPK
NoDeP removed, ob/acre)
Italian rye8Jass
1958 1959 Cocksfoot 1960 r96l 1962 1963
P removed annually 1958-63
Total P removed Extra P from residues
Italiao ryeSrass 1958 1959 Cocksfoot 1960 1951 1962 1963
K r€moved annually
r 95&63
Total K remoYed Extra K from residues
5.9
t2.l
3.5
ll.5
I
.6
8.54.8
tt.4
4.4
10.80.3
t-27-6
6.4
|.2
61.s
&.6
3-4
9.2
t1.820.s 55.5
70.535.0
50.0ll1
171
19345
t49
15329
104
t0854
118
r0534
74
E3275
46
104
108275
623
A7348
372144 865 533
ll5
15290
170t8
12561
16244
lt4
47
55
122332
730398
K removed, (lb/'acrc) 187 189 t7t 184 131 3
Phosphorus. From plots not given P since 1848, the grass removed 4.5Ib p/acre each
year after the fallow and 3.41b P after the clover rotation. The extra amounts
ofp
removed each year from the residues ranged from 5.8-9.1 lb p/acre. The extra p taken 46
THE AGDELL
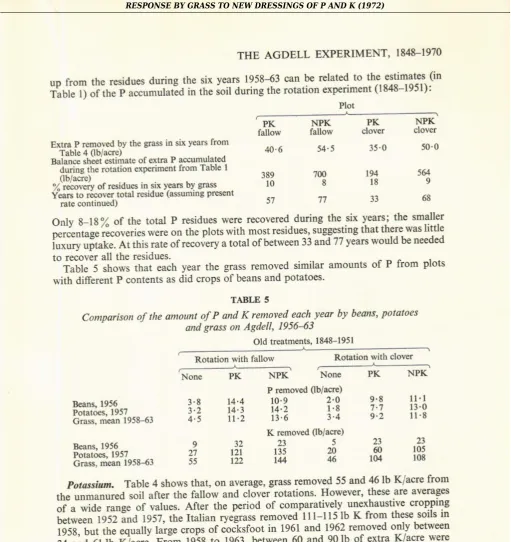
EXPERIMENT, I848-1970uD from the residues during the six years 1958-63 can be related
to
the estimates (inilir.
rl
J'iihfi;***nlrr"iEii"
tt.
ioit during lhe rotation experiment (l8tl8-1951): NPKfallow
Extia P removed by the grass io sii y€rs from
Table 4 Ob/acre)
n"i,.'cr stt;;i esdmate of extra P accumulated
--aGog itre toratioo experiment from Table I
(lb/acre)
:z recoverv of residues in six years by grass Y'ears to ricover total residue (as.suhin8 present
rate continued)
s4.5
35.0
50'0onlv
8-18%of
the total P residues were recovered during the six yearq the smaller;;";;;;:;;i..
*"* .*tt.
plots with most residues, suggesting that there was littleir-r.y
"iilt".
et
tnis rate ofrecovery a total ofbetween 33 and 77 years would beneeded to -- recover all the residues.
i"li"
s
shows that each year the grass removed similar amountsof
P from plotswith different P contents as did crops of b€ans and potatoes'
TABI.E 5
Comoarison of the amount of P and K removeil each year by beans' potatoes
and grass on
Aglell,
195643PK
fallow
389 10 51
NPK
clover
40.6
Rotation with fallow Rotation with clover
None
PK
NPKNone
PK
NPKP removed ob/acre)
5@ 9 68 194
l8
33 700
8 77
E€ans, t956 Potatoes. 1957
crass, mean 1958-63
3.8 14.4
10'93.2 r4.3
l4'z
4.5 ll.2
13'62.0
9'8
ll'1
1.8
7.7
l3'03.4
9.2
ll'8
Beans.
1956
I
32F"t"i
;;-
rssz
27
t2l
i;iii,
nieantss8jl
55
122Extra K removed by the Sxass in six yeals from
Table 4 flb/acre)
Baia-nci shiit estimate of extra K accumulated
--a*ing rtre .otation experiment from Table I
0b/acre)
% recovery of residues in six years by Srass
K removed 0b/aqre)
235
135
2!t44
4623
2360
105r04
I08PK
NPK
PK
NPKf;6w
fatto*
clover
clover398
533
348
312703 53
r/06
na9
53128
41
66Potssshtm. Table 4 shows
tlat,
on average, grass removed 55 and '16Ib K/acre fromtf,"
,r."rr*a
soil after the fallow and clover rotations' However' these are averages;i"-;il';"rc;;i
uutr,"t.,ut"t
the periodof
comparatiYely. unexhaustive croppingi"*".. isri"t
1957, the Italian ryegrassremoved-ltl-1l5lb
K
from these soils iniSi8,
brt,lr"
equally large crops of coJksfootin
1961 and 1962 removed only betweeni+
"ii
orlt
xl""i".
r.J-
1938to
1963, between 60 and90lb of
extra K/acrewere
;#;;i il";.rf
each year from the piots with residues' The total extraK
taken upi;;; i;;
;;idr";
euring tire six vears can be related to the estirnates (in Tablel)
of theK
accumulated in the soil during the rotationexPeriment'
,,o, Plot
Old tratments. 1848-1951
ROTHAMSTED REPORT
FOR
197I, PART 2Much more (28-66 %) ofthe estimated K residues were recovered than ofthe p residues
and it seemed that only another five or so years would be neeaea to rer:over au the residues
on some plots.
Table 5 shows that,
in
contrastto p,
the grass extmcted much rnoreK
from theunmanured soils than did the beans- or potatois, but tt ut it e potatoe, removed
much
the same amount from soils with residues, except from
the pi_[l,over plot.
The second period, 196{_70
After the cocksfoot was killed
in
1963 the.plots were ploughed and sown with timothy(s5l) in 1964. Eacn grass half-plot was divided into
.igit.,iuprotrio
test four amounts each of new P and K with basal dressings off
ana p-respectilviv.-Treatments and symbols were:
Nutrients as P2Ob and KzO (cwtlacre) given as triple superphosphate
and potassium chloride
"
o'rtb?dott
*ro
*
*!",Btrr'oo
*,o
none fg
p{Xo 16
01
!g
PrKr
t6
,.s
.9
!q
prKr
rr
5.016
t0
p&
ie
rodPoKa
PrKr
PzK,r PrKa
Thus from 1964 to 1970 the eflects- of th-e residues
ofp
andK
were measured separately.lpryi*-
T:!l;.:4
and 5 show yietdsofdry
grass each ye"r.fo
rrruint n the differences lD sollr
ano.K
between the sub-plots, the p andK
removed in the grasswas refurned
as an equivalent amount of fertiliser p and K., except that
,oUpiot
t"rting poKowere
not given.P and_rhose testing paKo vere not given
(.
afr",
irliO+in"
".";[;;ii-;i;;
were sil,rilarly-divided into eight sub-plots, *-hi"h
*.r"
gi""oil"
orn.
combinationsof
P and
K
fertilisers. Between 1964 ana 1969 thesesu'pioti
wer"i"ito*"a
aror".riuJ
no additional fertiliser.
Timoth,y
(S5l),
19&47.
Tbe Timothy_was sown early
in
May
1964. r.arge benefitsfrom all amounts ofnew p (up to l6 cwi pzos/acre)
arJ;;
K
(,1p;o l0 cwt KzO/acre)showed soon after the grass emerged, but dry weather aft"i
l*.
Jr-naf.Agrofih
and thegrass was cut only once, late in August. The timothy estaUtistreJ so budiy
"ra
;;;;
slowly withor.rt new P (p6Ka treatments) that yield;";d-;;ib"
-*sured
on plotswithout residues and were small with. More important, wu, tfr"t-Jn"o
*itn
tUe fuigp.i
amounts of new fertiliser given (16 cwt pzOs/acrO, yielal n
"."
t*i""
u. _uch on the oldNPK-plots as on the starved soils:
New fertiliser, 1964 (cwvacre)
Otd treatmenrs. t848-195t Mean offallow and clover rotaiions
LE
PK
NPKDry grass (cwti acre) 1964
PeOs 0
t6
KzO
l0
10 08.4
ll.0
1.0 18.85.2Thus newly-sown grass responded, both much as the arable crops did
in
1959_{2.to
the residues and the new dressingsof
p,.. Giving new-
K
had-irregular efects but the smallest amount usually doubled yield and there was no benefit from givingmore-By 1965 the timothy was well estabtished and three cuts were taken, at mid-May,
Iate
June and early October. plots, which in the
previo*
y""i
Vi"fJ.a O_i cwt ary grasVacre,
THE AGDELL
EXPERIMENT, 1848_1970now yielded 57-108 cwt/acre. On the P test sub-plots after the fallow rotation, yields
without new P were 83, 86 and 108 cwt/acre on the unmanured,
PK
andNPK
plotsrespectively. New P was most effective on the old unmanured and PK plots, increasing
yield by lG18 cwtiacre, but even so yields were less than the I l7 cwt on the NPK Plot. After the clover rotation, yields \vithout new P were 57, 84 and 92 c,N acrc on the un-manured, PK and NPK plots respectively. Yields on all the clover rotation Plots were increased by new P and were as large on the unmanured plot as on the PK and NPK
plots. For all tests, there was little or no benefit from more than the smallest dressing
of
new P (4 cwt PzOs/acre). Appendix Table 4 also shows that, on the
K
test sub.plots in 1965, the grass yielded 89 cwt/acre on the unmanured-fallow plot without newK
andstill more (97 cwt) with residues
ofK
on the NPK plot. On the clover rotation plots there was little benefit from residues. Given newN
and P, but notK,
the unmanured-clover plot yielded 90 cwt/acre even after croppingfor
I 17 years wittroutK
manuring. NewK
increased yield little on the starved soils but gave moderate increases in the presence
of
K
residues. Hence, with newK,
yields were 10-13 cwt/acre more on plots with oldK
residues than on those without. The smallest amount of newK
was usually enough.In
1966 the grass was cut four times, at May, late June, August and mid-October. Total March to September rainfall was much the same in both years, 19.0 in.in 1965 and 17.6 in 1966, but on the impoverished soils, yields (cwt/acre) were much less
in
1966 than in 1965:Without fresh P
Without fresh K
Unmanwed.clover plots Unmanured-fallow
plots
1965
l%656.6
29.O90.4
55.81965
196683.1
41.288.8
59.4This suggests that, on these impoverished soils, the P and
K
released by weathering and not used by the very small crops in 1964 remained to supply the crop grown in 1965;however, weathering was too slow to maintain
in
1966 the large yieldsin
1965.In
1966the much smaller yields on the starved soils made the single and combined eflects
of
residues and new P and
K
seem much larger than in 1965, but Appendix Table 4 shows that maximum yields with residues and new dressings ofboth P and K were similar to thosein
1965.By 1967 the timothy was badly infested with couch grass and was cut only once, early
in June. The couch made yields iregular but they followed the pattern of the previous
two years (Appendix Table 4). The land was ploughed and then rotary cultivated four
times during July and August
to kill
the couch. Timothy was sown againin
earlySeptember.
Timothy (S51), 1968-70. By spring 1968 the timothy was well established except where
new P was not applied
in
1964 (PoKr sub-plots); however,of
these sub-plots, growthwas least bad on the NPK-fallow plot, which consistently yielded the most between 1964
and 1967. Timothy was resown on the PoKl sub-plots on the starved soils in mid-April. The grass was not cut on these subplots,
or
on thePoKl
sub-plotof
the PK-clover rotation, at the fust cut in May. Second and third cuts were taken in July and October and by October yields on all PoKa plots were much the same. Total yields (Appendix Table 5) from the three cuts were increased by P residues on the NPK plots from23-65 cwt/acre after the fallow rotation and from 26-46 cwtlacre after clover. Though resi-dues on fallow rotation plots were again more effective than on clover rotation plots, maximum yield was the same (87-88 cwt/acre) after both rotations when new P was
given. New P was less effective on the starved soils, increasing yields to only 73 cwtlacre. Both old and new
K
had much smaller effects than old and new P, because on the starvedROTHAMSTED REPORT
FOR I97I,
PART 2soils yields on the PaKo sub.plots were much larger than on the
pjKa
sub.plots. Thisconfirmed previous deductions that shortage of p rather than of
K
limiiedyi;ld
on this soil. App€ndix Table 5 shows thatK
residues on thepK
plots increased- yields from56
ta
67 cwtla.,e after the fallow rotation and from 65to
12 cwtlacre afte; the cloverrotation. In 1968 the K residues on the NPK plots were less efective than those on the
pK
plots. After the fallow rotation this was probably just chance, because
in
1969 yields onthe PaKg sub-plots were, as usual, better after NPK-fallow than afler pK-fallow. After the
clover rotation, yields on the PaK6 sutr.plots were smaller on the
NpK
plot than on the PK plot from 1966, by as much as 20 cwt/acrein
1968 and 1969. possibly this is relatedto release of soil-K because the soil of the NPK-clover plot contains less clay. However,
yields were the same on both plots when new
K
was given.In
1969 the grass was again cut three times,in
early June, early August and mid-October. Yields (in Appendix Table 5) were much the same asin
1968 except thatsub-plots without new P yielded rather better.
The plots testing new P were ploughed during autumn 1969
to
measure with arable crops the effects of the P residues built up in these soils under grass and fallow. The sub-plots testing K rcmained in grass in 1970. Only two cuts were taken, in June and August, before this grass also was ploughed becauseit
had again become infested wittr couch.The yields are in Appendix Table 5.
Mean yields, 1964-69. Table 6 shows the mean annual yields, from 19&
to
1969, F.yenby each combination of P residues and new P and
of K
residues and newK
when the P andK
removed in each crop were returned as equivalent amounts of fertiliser, exc€ptthat the PoKl subplots got no P and the PaKs sub-plots no K. Only one cut was tak,n
in two of the six years so maximum mean yields were only a little larger than 70 cwt dry
grass/acre. Giving basal dressings of P and
K
to sub-plots testing K0 and p0 respectively, TABLE 6Mean adnual yields of dry grass (cwtlacre) from combinations of residues of okl
p
with new P and from combinations of residues of oldK
with new K, 196449New treatments io 1964 Rotation with fallow Rotation with clover
PK
0
I
2 4 4 4 4 4
4
33-3 48.6
A.14
62.2 66.E
71.44
65.4 55.8
71.84
65-6 68.1
72.80
50.6 52.5
57-3l
65.6 A.7
69.22
63.6 63.4
69.54
61.6 A-3
73-lu-6
4.6
52.962.8 65.9
59.r66.1 59.8
71.865.6 67.8
70.146.5 59.8
48.165.4 69.4
69.864.3 65.5
70.365.8 58.1
13.1Po
:
ooPzQs
P!:
4 cwtP2o5/acre
Pz:
8 cwtPuOs/acre
P.:
16 cwt pros/acreKo
:
noKzO
Kr:
2+ o*'tKro/acre
K,:
5 cwtKro/acie
Ie
l0 crrt KrO/aiie showed that yields were restricted much moreby
shortageof
p
thanof
K
residues.Residues of
I
in the PK plots increased yield by 15 cwt/acre and intle
NpK
plots by30 cwt/acre. Compared with the first period when combined
pK
effects were miasured,ttre P residues in the PK plots increased yield less during the second period but the yield
was increased by the same amount during both periods on the
NpK
plots. By conirast,K
residues increased yield by only 2 and 7 cwlacre on thepK-
and NpK-fallow plots50
E40
I
rt
(o9-
30c
(!E20
,tic
t,'
i
t
!*
.c
6
270
E
o
c
(3
t60
o48
16new P, cwt P2O5/ acrc
THE AGDELL
EXPERIMENT, I848-1970falhlltr rotation plcts
clover rotation plots
o
2.s 5.O
10 nelv K, cwt K2Ol acreFrc. 5- Relationship betwe€o yield of dry grass (crvt/acre) 195'H9 aEd fresh di€ssiDgs of-P--l!d
!(
ou the Agdell rotatiori experimen-t plots whiih were, unmanuted, x ; or Siven PK, O ; or Siven NPK,tr'
from 1848 to 1951.
ROTHAMSTED REPORT
FOR I97I,
PART 2and by 13 and,2cwtfacre on the
pK-
and NpK-ctover plots. These increases bear little1el1!on 10 those during the fust period and suggest that soil-K rather than residual
fertiliser-K was more effective in controlling yield.
The results in Table 6 were used to plot the response by grass to new p and new
K
on each of the old plots, after both fallow and clover (Fig. 5y.1he grass responded much more to new P than to new
K
but there was little response to more than the smallestamount_of either
P or
K
tested, bothwith
and without residues. The shapesof
the curves show no loss of yield even at the largest amounts of bothp
(16 cwt i2O5/acre) andK
(10 cwt KzO/acre) tested.Nuhi€trts remoyed,
196l_70.
Appendix Table 6 shows the amounts of p andK
removedby the gass each year between 1964 and 1970 from the
p
andK
test sub-plots, andTable 7 the average annual removal
ofP
and K. Table 8 shows the amountsolp
andK
removed on the sub-plots without new dressings of p or
K
fertil.iser between 1964 and1970.
TABIJ 7
Aterage amounts of P and K remowd each year by the grass grown on Agdell,
Rothamsted, 1964_70
RotatioD with clover None
5.6
16.4 19.0 2t -4
New tr€atmedt 1964 Rotatiotr with fallow
NPK None
P removed (lb/acre), 1964-{9
57
90
63t76
186
176174
192
208197
22t
22962
78
88164
182
185l8l
184
m42lo
2M
2u
4 4 4 4 0 I 4 0 I 2 4 4 4 4 4 NPK
l0.l
@.4 4t-2 6344
40TABLE 8
Amounts
ofP
remoted by grass grown.teithout newp
and o!K
removed bygra:ts gtown without new
K
on Agdell, Rothamsted, 1964-709.9
15.221.9
24.522.0
26.026.0
21.63.2
17.3
198
22.2
3-2
7-lt9.2
42- 523-3
7.1
r0.ll8.l
m.618.9
23.422-5
24.0K removed (lb/acre), 1964-70
None P (lb/acre), 1964-69
Rotatioo with fatlow Rotation with clover
Mean annual removal
Total P rcmoved
Extia P from residues
Mea.u aonual removal Total K rcrnoved ExEa K from rcsidues
Notre 5.5 33.8 PK 9.9 59.4 25.6 15.2 91.1 57.3 m 630 230 615 t82
62
?8433
546113
K flb/acre), 1964-70
88
57g
Phosphorts. Table 7 shows that the grass removed 5.6lb p/acre from the unmanured
plots after fallow and 3.2lb P/acre after clover: much the same amounts, 4.5 and 3.4Ib
Old treatments, 1848-1951
Old reatments, I 8,18-1951
I
zooE
I
d,
o
o.E
(,
{
roo-o
v
o
9zo
E
o o o
I
o
.E qt
a
>10
o.^
(E
E
IB
o
o
I
o
.E
3,*
(0
n
Y
20
G
o
t
o o o
.E 10
d
-o
o-tallor{ rotaiim pbts
clover rotalion plots
48
ner
P, cwt P2O5f ar're2.5
50
new K, cwt K2O/*.rcFrc. 6. Relatiooship betweeD tbe meatr aEounts of P (lb/acre, 1964-69) aod of K (lblaqe,1964-70)
rcmoved ill the crop each year aod frcsh &€ssings of P aod K on the Agdel rotation €xperiment plots which were, unmanured, x ; o. givetr PK, O; o. givcn NPK, tr from 1848 to 1951,
53
ROTHAMSTED REPORT
FOR I97I,
PART 2P/acre, were removed during 1958-63 (Table 4). During the second, as during the first period, the extra amounts of P removed each year from the residues ranged from
3.9-9'6lb
P/acre.An
extra9-l4lb
P/acre was removed from the first dressingof
new Ptested; the amount was almost independent of the P present in the soil as residues. With
the largest amount of new P some, but not all, of the differences between uptake caused
by residues had disappeared; most P was removed from soils with most residues. Fig. 6 shows the relationship between P uPtake and P applied.
The extra P taken up from the residues between 1964 and 1969 can be related to an
estimate of the amount of residues remaining in 1964:
NPK
clover Extra P lemoved by gass during 1964-69 Crable 8)
0b/acre)
Estirnate of exrra P in 1964 0b/acre) [exlra P from rotatioo experiment (Table l) minus P removed 1958-53 Clable
4I
7" recovery of residues in six years by Srass
25.6
PK
NPK
PKfallow fallow
clove.159
514148
348
64679
57.3 23.3
41.2The proportion of the residues recovered during 196,1-69 was much the same as during
1958-63, so the P remained as available as previously. The recovery
of
the residues isdiscussed further in relation to the estimates of their amount from soil analysis results.
Potassl,um. Table 7 shows that, on average, 62 and 57
lb
K/acre were removed byttre grass from the unmanured plots after the fallow and clover rotations during 19&-70, slightly more than during 1958-63. Though shortage
of
P may have slightly limited growth on these plots during the first period, the close similarityof
theK
removals (62 and 57 lb K/acre second period, 55 and 46lb
K/acre first period) suggests that thegrass removed all the
K it
could get and that, on average, this soil releases around 55 lbK/acre annually.
In
contrastto
the fust period, lvhen the grass removed an extra60-90lb
K/acrefrom
the plotswith
residues, only G33lb
extra K/acre were removed each year during the second period. Also, whereas the percentageof
theP
residuesrecovered was much the same during both periods, the Percentage recovery
of
the estimatedK
residues during the second period rangedfrom
11-125%. However,it
isinteresting
to
look at the total recoveryof
the estimatedK
residues oYer the l2-yearPeriod:
PlotPK
NPK
PKfallow fallow
cloverNPK
clover 103 412 59 Balatrce sheet estimate of the extra K accumulated duriDg
lhe rotation expeEment from Table I
(lb/acre)
l&6
1289
531Er(tra K rcmoved by lhe grass itr 12 years from Tables 4
and 8
(lbiaqe)
5ll
715
578% recovdry of the residues by
gass
36
55
109The larger the amount of the estimated residue, the smaller was the percentage recovery.
It
seems improbable that much moreof
theK
residues would be recovered were the experiment continued, because the grass removed so very much lessof
them during1964-7O than previously. The amount
of
K
removed from these sub-plots was limited only by lackofK
because twice as muchK
was removed on sutlplots given newK.
If
the estimates
of
theK
accumulated during the rotation experiment are reasonablyco
ect, the fate of some of thisK
requires explaining.It
may simply have been leachedso far down into the soil that the grass roots failed to reach it. Alternatively, as the release
and fixation of
K
in soils are reversible reactions,it
may have be.come fixed so that its54
THE AGDELL
EXPERIMENT, I848_1970release is now no faster than that of'native' soil-K. Whatever the explanation,
it
seemsthat 40-&7" of the larger
K
residues are not available even to such an exhausting cropas grass,
Table 7 shows that with new
K,
the grass removed much more. From the smallestdressing ofnew K (2'5 cwt K2O/acre), it removed 100 lb K/acre after each old treatment. From the other two amounts (5'0 and 10 cwt KzO/acre),
it
removed only a further 2G-rl0 lb K/acre each year. Fig. 6 shows the relationships betweenK
uptake andK
applied.The retationship betwe€n yield
a
t soil amlysisPhosphorus. Fig. 7a and b shows that both the total mean annual yield
of
dry grassfrom 1958-{3 (Fig. 7a) and the mean annual uptake of P by the grass (Fig. 7b) are corre-lated with the amount of readily soluble P in the soil of the plots
in
1958 measured by extraction with 0'5M-NaHCO3. Fig. 7c and d shows that the average yield of dry grassand the P removed during the years 1968 and 1969 were similarly correlated with the
readily soluble P in the soil
in
1969. During the first period, but not in the second, the response curve became much flatter after about l0 ppm bicarbonate soluble-P.In
therange 8-10 ppm bicarbonate soluble-P each
I
ppm increase gave an extra 0'8 and 2'5 cwt dry grass/acre in the two periods resp€ctively. The much smaller value during the first period (1958-63) on Agdell may be because the mean yields included two very poor yieldsin
1960 and 1963. Mattingly etal.
(1911) have reported thatfor
Italian ryegrass in196668, on Sawyers
II
and Delharding fieldsat
Rothamsted, they obtained an extra3'2
and5'l cwt dry
grass/acre respectivelyfor
each Ippm
increasein
bicarbonatesoluble-P at a mean soil value of 8-9 ppm.
Table
9
shows the changesin
the bicarbonate soluble-P between 1958 and 1969.Although betlveen 40 and 60 lb P/acre were removed from the unmanured plots of the clover and fallow rotations there was very little change in soluble-P content of the soils
TABLE 9
Amounts ol soluble-P in the soils of the Agdell grass experiment, 195849
*,['
&'ft
:3*B'"#
$.:#*S?t*
1961 1961
196913.6 ll.4
I1.88.2
5.8
8.09.0
7.7
5.64-6
4-4
4.02.5
4.4
4.0r'9
3.9
4.sbetween 1958 and 1969, the bicarbonate soluble-P tending to increase slightly. On the other four plots, which had residues
of
P, the bicarbonate soluble-P decreased as theextra P from the residues was removed' With one exception, the decrease in bicarbonate
soluble-P was related to, but did not account for all, the extra P removed. The exception
was
plot 3
@K-fallow), which had anomalously much solubleP
in
1958;by
1969'however, the soluble-P remaining was well related to the estimate ofthe total P residues.
Table
l0
shows that the extra P taken up from the residues was not only well relatedto the estimate of the P remaining in the soil from the balance sheet shown in Table
l,
but also to the estimate of the amount ofthe residues from the analyses for total P itr theG-18 in. depth of soil sho*n in Table 2. During the years 1958-69 the grass recovered on
average 20 and l8 % ofthe P residues estimated by the two methods. The only discordant
resultls the apparently better than average recovery ofP on the PK-clover plot, when the
55
Plot
I
2
3
4
5
6
TreatmeDt
1848-1951
1958NPK-fallow
20'8NPK---rlover
l 3 '0PK-fallow
15 6PK---{lover
6'0None-fallow
3 0o o
520
ro{,
o
Hlo
i
a
3o
o
370
!
o
960
.9
o.
o
.E
o o
E
o
i
(!
d
t
P
P,ppm, soluble in
O.slt-
Na H@3Frc. 7. Retationship betwced bofh yi€ld ofdry glass (cwt/acre) and P 0b/ac.e) rcmoved in the exass and
sodium bicarboMte soluble-P io the &-9 io, depth of soit oo Agdell Field,
RotharDsM-(a) Mean amual yield 1958-63 and soluble-P in soil in 1958.
(b) Tohl P reooved 195H3 atrd soluble-P in soil
h
1958.(c) Mean aDnual yield 196&-69 and soluble-P in soil in 1969.
(d) Total P Emoved
l
M9
and soluble-P itl soilh
1969.56
70
THE AGDELL
EXPERIMENT, I848_1970TABIT 10
Relationship between the P removed by grass between 1958 and 1969 and the
estimdes of the total P resiilues in the soils of the Agdell grass expeiment
in
1958Rotation with fallow Rotation with clover None
Total P removed by grass
1958-69
obiaqc)
@'7Extra P from the residues Estimat€s of extra P itr the soil
0b/aq€)
(a) from the balance shcet
flable
l)
Y, rqavery
(b) from the aoalys6 for total
P iD the soil 0-18 in. deep) of the gass plob Crable 2)
)( rt,covery
39.1 98.0
130.958.3
9t-21967
ll6
r00 t3ltl2
9lll0
1969 136 l14 r26 t29 103tt2
t94
5A30
162N
5952l
t5389
700t7
t6349
7t6t9
t6126-9
172.56.2
1r 1.8l96l r05 8l r24 105 94 123
balanc€ sheet estimate for the P remaining in the soil is used. Probably the P removed
during the rotation experiment has be€n over-estimated. The 'error' is less than
I
lbP/acre each year, probably no vorse than actual analys€s of all crops would have given.
However, whereas crop analyses would have positive and negative errors, any errors in our calculations have apparently always overestimated the amount of P
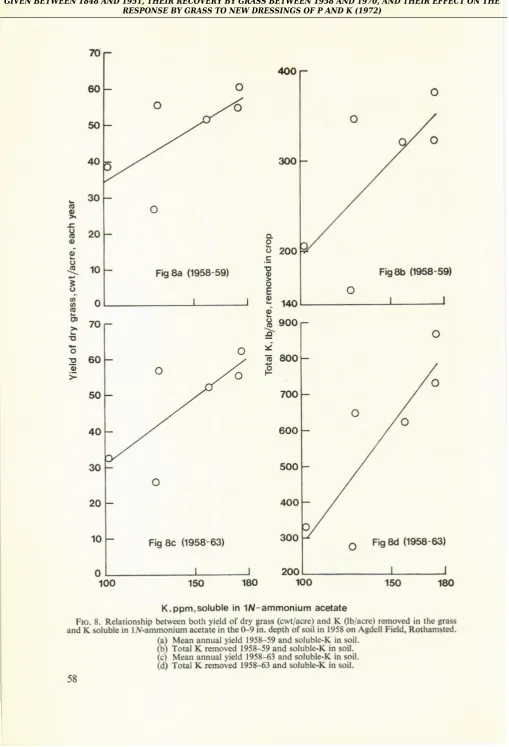
removed-Potassium. Fig. 8 shows that both the yield
of
dry grass and theK
removed by the grass were not well relatedto
exchangeable soilK,
either during the fust two years(Fig. 8a and b) or from 1958-63 (Fig. 8c and d). Table I
I
shows the amountofexchange-able
K
in the 0-9 in. depth ofsoil on five sampling occasions; there are some unexplainedanomalies
in
the 1969 samples, possibly sampling error. On average the amountsof
exchangeable
K
in the unmanured soils changed little between 1958 and 1970 though670 and 760Ib K/acre were removed from these soils by the grass. Table 12 shows that an extra 412-7l5lb K/acre was removed by the grass from plots with residues and the
amount of exchangeable
K
decreased (Table Il)
but the two were not related. TABLE 11Amourrs of soluble-K in the soils of the Agdell grass expeiment, 195849
K, ppm, soluble in lN-ammonium acetate Soils. 0-9 in. deep, not giveD new K in
l
4 PIot I 2 3 4 5 6 Treatment 1848-1951 NPKlallow NPK-dover PK-fallow PK---4lover None-fallow None---{lover 1958 176 ,30 t75 t58 toz t28 196r'. 101 108 103 111 97 119We intend to inyestigate further \ryhy both crop yield and
K
removed by gass in this experiment were not closely correlatedwith
the initially exchangeableK
in
the soil, eitherfor
a shortor
long periodof
cropping. We expecteda
better correlation thanwe found especially as we have shown that the amount of residues remaining in the soils
from the rotation experiment is correlated with their contents of exchangeable K. AIso,
when Arnold and Close (1961) exhaustively cropped samples ofthe surface soils (0-9 in.)
o,
I
()
200.E
!(,
o
E
9-
raoE
I
9OO-.
Y6
8()0 P-30
(!
o
E
Hzo
o
d
{-
10]
o
io
to
3ro
!
o
o6O
.c50
ol-100
K,ppm,soluble in 1rr-ammonium ac€tate
Frc.8. RelatioDship betwee[ both yield ofdry gass (cwt/acre) and K ob/acle) rcmoved io the Srass and K soluble in I rv-ammonium acetate io the 0-9 in. depth of soil in 1958 on Agdell Field, Rothafisred.
(a) Mean aDnua.l yield 1958-59 and soluble-K itr soil.
(b) Total K rcmoved 1958-59 aDd soluble-K iD soil.
(c) Meao aDoual yield 195k3 aDd soluble-K itr soil.
(d) Total K Emoved 195H3 and soluble-K in soil. 58
rc
60 50
&
Fig
8c
(1958-63)THE AGDELL
EXPERIMENT, 1848-1970TABIT TI
Relatiofiship berween the
K
remoted by grass between 1958 otd 1970 add theestimak
;f
the K rcsidue tu the soils of the AgfulI grass experimentin
1958None
Total K Emoved by 8rass,
1958-70
obiaca€)
165 Extra K from the residuesEstidates of extra K irl the soil 0b/acle)
(a) from the balarce sheet
Gable
l)
%, rqover!
(b) from the amlyses for
exchangsable K itr the soil (0-18 in. deep) Cfable
2)
-t( rcc.overy
Nooe 675
from these Agdell plots with ryegrass in pots, they found that the
K
removed was well relatedto
initially exchangeableK,
even though the grass also removed much initially non-exchangeable K. Arnold and Close also calculated from their results the equivalent amount ofeitra K/acre removed from the surface soils ofplots with residues. The amounts are much less than our estimates of the amounts of the residues and in this resp€ct theirresults confrm our deduction that some of the
K
residues have been 'lost'.In
the field factors other than the amount of exchangeableK
or the amount of residues influence the amountof
K
available to a crop. Obviously the release of soilK
is important but probablynot
as important as the relative amountsof
topsoil and subsoil and theircontents of available
K
which can be explored by crop roots.Conclusions atrd futue work
The amounts of P and
K
accumulated in the Agdell soils from fertiliser dressings weremuch smaller than
in
some other Classical experimentsat
Rothamsted. However, an estimate of the residues derived from the gains and losses of P andK
between 1848 and1958 were correlated with the results of analyses of the 0-18 in. dePth of soil for
total-and bicarbonate soluble-P total-and exchangeable
K' In
1958 half of each rotation plot wassown with grass, with two objectives; the first was to find the value of the residues
for
grass and \vhether grass given much
N
could exhaust them; the second was to increaseihe organic matter of the soils so that arable crops could later be glown on soils con-taining similar amounts of P and K but different amounts of organic matter. The experi-ment was modifled in 1964 when the halfplots were further divided to test new dressings
of both P and
K.
Grass behaved much as arable crops grown on this soil' Residues not only increased
yields but did so even when fresh dressings of P and
K
were given. The reason for this is not clear, but in addition to providing nutrients well distributed throughout theculti-vated layer, soils may haye better physical properties when they have long produced large crops than when they have produced poor ones. P residues were recovered at a
faiily
constant rate during 12 years and probablyall
the residues would have beenrecovered had the experiment continued long enough.
In
contrast,it
seems improbablethat all the
K
residueswill
be recoverable, possibly because they haYe been leached toodeeply or because they are released no faster than 'native' soil K. This suggests that over-generous
K
manuring may lose someK.
Thusin
practiceit
may be important when59
Rotation with clover
PK
NPKt253
1087587
4r2PK
NPKt276
t4805ll
7151406 lx9
53t
70336
55
-
109
59217
268
146
170184
267
196
242Old treatments, 1848-1951
ROTHAMSTED REPORT
FOR I97I,
PART 2manuring with K to balance the K requirement of the crop, aDd pay regard to the amount the soil may release during the
gro*th
of the crop.Much work has been done in other experiments to relate crop responses to new fertiliser
with
soil analyses. Too often the results havenot
been encouiaging, because manysites in diferent localities were needed to get a range of soil values large enough to te;t each method
of
analysis. However, soluble soil-P and-K
probably do not chinge con-siderably from year to year, and weather and maoagement are much more variable. Toexamine the value ofsoil analysis in well-defined conditions, this experiment was modified
in
1964.At
two amounts of soil organic matter,it
provides 24 soils containing different amounts of both bicarbonate soluble-P and exchangeableK.
Using a rotation of three arable crops, we hope to define the minimum amountsof
soil P andK
at which the crops would not b€ expected to respond to new dressings of P and K. This informationwill then be used to modify the P and
K
manuring on those fields on Rothamsted farmused for experiments other than those testing P and K. This work is also being extended
by similar experiments at Woburn and Saxmundham.
Summary
l.
The four-course rotation experiment on Agdell Fieldfrom
1848-1951 compared alegume
or a
fallowin
thethird
year: roots, barley, legumeor
fallow, winter wheat. Three manurial treatments were tested, unmanured, PKNaMg, NPKNaMg; the manureswere given to the root crop only. About
lrl0lb
N was given as a mixture of ammomum salts and rape cake. The initial superphosphate dressing supplied 30lb P/acre but later ones 38lb
P; ttre rape cake supplied 20 lb P/dressing- FertiliserK
was also inreasedduring the experiment, from 120 to 200 lb K/acre, but tlle rape cake always supplied about
20lb
K/acre. Dressingsof
sodium, 14lb
Na,
and magnesium, l0lb
Mg/acre, weresmall.
2.
A
nutrient balance made for P andK
showed that the amounts that accumulated in the soil depended not only on the manuring but also on the crop rotation, especiallyfor
K
because of the amount removed by clover.3. Total soil P, soil
P
solublein
0.5M-NaHCO3 and exchangeableK
were linearly related to the estimates of the balance between P andK
removed in the crops and the gains from fertiliser dressings. These relationships are compared with others for experi-ments at Saxmundham and Rothamsted. Were losses and gains exactly balanced, bothsoils would contain 9 ppm of bicarbonate soluble-P and lzlo-160 ppm ofexchangeable K.
4.
Grass was grown from 1958to
1970 on half-plots of the rotation experiment;it
hadto be resown in spring 1960 and 1964 and autumn 1967.
It
was always cut at silage stageand 0.8 cwt N/acre was given for every cut. Between 1958 and 196j, P and
K
iere
n-otgiven and the combined effects
of
P andK
residues were measured. From l96zt-?0,P was given to sub.plots testing K, and K to sub-plots testing P residues, to measure their
effects separately.
In
1964 new dressings of P (0, 4, 8, l6 cwt PzOs plus l0 cwt K2O/acre) and ofK
(0, 2.5, 5-0, l0 cwt KeO plus 16 cwt PzOs/acre) were also tested on sub-plots. To maintain differences in soil P andK
b€t\yeen sub-plots, the P andK
removed in thegrass were replaced by equivalent amounts of P and
K
as fertilisers, except on sub-plots PoKa and PaKo which got Do P and noK
respectively.5. The residues always had large effects on the newly sown grass. These effects were smaller after the grass was well established, but obtained even when new dressings of
p
and
K
were given. Without such new dressings, clover-rotation plots always yielded lessthan corresponding fallow-rotation plots, because of the P and