R E V I E W
Open Access
An Overview of Methods for
Reconstructing 3-D Chromosome and
Genome Structures from Hi-C Data
Oluwatosin Oluwadare
1, Max Highsmith
1and Jianlin Cheng
1,2*Abstract
Over the past decade, methods for predicting three-dimensional (3-D) chromosome and genome structures have proliferated. This has been primarily due to the development of high-throughput, next-generation chromosome conformation capture (3C) technologies, which have provided next-generation sequencing data about chromosome conformations in order to map the 3-D genome structure. The introduction of the Hi-C technique—a variant of the 3C method—has allowed researchers to extract the interaction frequency (IF) for all loci of a genome at high-throughput and at a genome-wide scale. In this review we describe, categorize, and compare the various methods developed to map chromosome and genome structures from 3C data—particularly Hi-C data. We summarize the improvements introduced by these methods, describe the approach used for method evaluation, and discuss how these advancements shape the future of genome structure construction.
Keywords:Hi-C, 3-D chromosome and genome structure, Chromosome conformation capture, 3-D genome, Contact-based modeling, Distance-based modeling, Optimization
Background
After decades of research about the organization of the nucleus of the eukaryotic cell, there exists substantial evidence that the genome architecture plays a key role in nuclear functions. [1–8]. For instance, the spatial ar-rangement and proximity of genes has been linked to biological functions such as gene replication, regulation and transcription. [6,9–11].
The impact of genome architecture on nuclear pro-cesses spans multiple hierarchical levels including the
spatial compartmentalization of the process, the
higher-order organization of chromatin and the arrange-ment of the genome within the nucleus. Despite the dy-namic nature of their process components, processes such as transcription and DNA repair have been shown to be constrained to specific spatial locations rather than randomly dispersed throughout the nucleus. Genes tend to be more active in sparse euchromatin than dense het-erochromatin, purportedly due to the impact of folding
density on regulatory factor availability. The homoge-neous topology of chromatin has potential to capture nuclear proteins, affecting their probability of interaction with binding sites. Small, kilo-base sized chromatin loops can localize promoters with upstream elements while larger mega-base sized loops can spatially segre-gate nuclear regions imposing independence on different processes.
Understanding the 3-D organization of the
eukaryotic genome is essential to explain the import-ant chromosomal activities within the cell. Hence, a fundamental question in genome and biological stud-ies is how the spatial conformation of the chromo-some in the nucleus affects a number of genetic and biological functions such as gene regulation [12, 13], gene expression [14], transcription regulation [15],
DNA repair, and DNA replication [16, 17].
Early studies of chromosome conformation relied on the use of cytogenetic techniques. An example of the which is fluorescence in situ hybridization (FISH), employed to detect the presence of a specific chromo-some region and the proximity between two regions in a
genome sequence [18, 19]. Fluorescence in situ
© The Author(s). 2019Open AccessThis article is distributed under the terms of the Creative Commons Attribution 4.0
International License (http://creativecommons.org/licenses/by/4.0/), which permits unrestricted use, distribution, and
reproduction in any medium, provided you give appropriate credit to the original author(s) and the source, provide a link to the Creative Commons license, and indicate if changes were made. The Creative Commons Public Domain Dedication waiver
(http://creativecommons.org/publicdomain/zero/1.0/) applies to the data made available in this article, unless otherwise stated.
* Correspondence:[email protected]
1Department of Electrical Engineering and Computer Science, University of
Missouri, Columbia, MO 65211, USA
2
hybridization uses fluorescent probes that bind to specific regions of a chromosome with a high degree of sequence complementarity. Using fluorescence microscopy, the lo-cation of the loci or DNA sequence with which a probe is expected to bind may be determined. This method is espe-cially useful, as it allows direct one-to-one estimation of genome loci proximity. However, due to technical limita-tions such as low-throughput, low resolution of FISH data, and probe requirements for every analysis, it is not opti-mal for examining multiple positions simultaneously. As a result, the method is not used when studying the organization of chromosomes at a genome-wide scale. Other microscopy techniques that have been developed to study the chromatin organization aimed at providing de-tails about the genome positioning and activities. Some of these methods are called the super resolution microscopy strategies, as they were developed to provide imaging at a high resolution. Examples are saturated structured illu-mination microscopy (SSIM), stimulated emission deple-tion (STED), and ground state depledeple-tion (GSD)[20, 21]. The introduction of Stochastic super-resolution micros-copy techniques such as Photo-activated localization mi-croscopy (PALM or FPALM) and stochastic optical reconstruction microscopy (STORM) produced a different set of ways for investigating the chromatin organization [22, 23]. Generally, the microscopy techniques for study-ing the chromatin organization could be categorized as light and electron microscopy-based techniques. The more detailed description of the microscopy-based tech-niques for studying genome organization is given in the
section “Genome Organization by microscopy-based
techniques”.
In 2002, Dekker et al. [24] developed 3C, a
high-throughput methodology that can be used to generate IFs between nearby genomic loci in a cell population. Since then, a number of 3C variants [25–27] such as 4C [28], 5C [29], Hi-C [30], TCC [31], ChIA-PET [32,33] and, later on, single-cell Hi-C [34], have been developed to study the 3-D organization of the chromosome and genome. The development of 3C techniques has substantially benefited the study of the spatial proximity, interaction, and genome conformation of a number of cells. Today, Hi-C is the most widely used and well-known 3C variant. Using next-gener-ation sequencing strategies such as high-throughput and parallel sequencing, Hi-C enables researchers to profile read-pair interactions on an all-versus-all basis—that is, to profile interactions for all read pairs in an entire genome. It also allows them to detect and compute the number of in-teractions between fragments within a chromosome—i.e., the intra-chromosome interaction frequency (IF)—or be-tween different chromosomes—i.e., the inter-chromosome interaction frequency. Fragments, alternatively known as bins or genomic loci, are the regions to which a chromo-some have been divided into. Each fragment has a defined
length or size which is the number of base pair (bp) in it. The size of the fragment is determined by the resolution, e.g. a 1 MB resolution signifies that 1,000,000 bp are con-tained within each fragment.
The IFs obtained are commonly represented in a two-dimensional matrix, also known as a contact matrix, with rows and columns representing the number of frag-ments in the chromosome or genome.
The Hi-C technique is especially relevant because the IFs it yields can be used to construct 3-D chromosome and genome structures. These structures, in turn, help explain a series of events such as genome folding, gene regulations, the connection between regulatory elements and the higher-order structural features in the nucleus of a cell [1,2,14,35,36].
Within the past decade, a number of computational methods and algorithms have been proposed for the construction of chromosome and genome 3-D structures from Hi-C data. Most of these methods adopt different strategies for 3-D structure prediction, have different technical requirements for algorithms, and use different noise reduction techniques to analyze Hi-C data. In this review, we categorize these methods based on how they model IF from Hi-C data, highlight a common approach to method evaluation and validation, and finally point to the future direction and challenges of chromosome and genome 3-D structure prediction.
Description of the Hi-C Experiment and Chromosomal Contact Map
Using next generation sequencing technology, the emergence of the Hi-C technique, an extension of 3C, has enabled the identification of the chromosome con-formation at a genome wide scale [26, 27, 30, 37, 38]. Compared to other variant of the 3C technique, the Hi-C technique is the first method [30, 38] to capture
chromosome conformation on a “all versus all” basis
—that is, it can profile interactions for all read pairs in an entire genome. Hi-C protocol begins by using formal-dehyde to crosslink the cells, which results in the cova-lent linking of the chromosomal loci through their protein-DNA interactions. The cross-linked chromatin segment is then cut out with a restriction enzyme, and the segment restriction ends are marked by filing in with biotin-labeled nucleotides [25, 30]. Next, the resulting blunt-end segments are ligated randomly under
appro-priate condition for ligation events between the
contact map [39]. Notable tools that support the map-ping of the sequenced pair reads to generate contact map are GenomeFlow [40], Juicer [41], HiC-Pro [42], Hi-Cpipe [43], and HiCUP [44].
Interaction frequency, sometimes referred to as con-tact frequency, is a measure of the number of interac-tions between a pair of chromosomal or genomic regions in the Hi-C data [45–48]. The combined contact counts for all pairwise regions or loci may be repre-sented as a symmetric matrix to form an IF matrix of all interacting fragments. The IF matrix is sometimes re-ferred to as a contact matrix or contact map [30,47]. A chromosome contact matrix is a n-by-n matrix repre-senting the interaction of loci or chromosomal regions as captured in the Hi-C experiment [27,30,31,49]. The rows and columns of the matrix correspond to the index of the equal-sized regions which partition the chromo-some. The length of one equal-sized region (e.g., 1 Mb base pair) is referred to as the resolution [30]. Each entry in the matrix represents a count of read pairs that con-nect two corresponding chromosome regions in a Hi-C experiment [30]. Alternatively, the contacts can be
rep-resented in a 3-column sparse matrix [49], where
col-umns 1 and 2 refer to the genomic location or the fragment number of the interacting loci and column 3 represents the IF between them.
Polymer Model
Polymer models are based on the underlying idea that interactions between molecular subunits such as mono-mers result in large molecular structures known as poly-mers. This approach was adopted from polymer physics, a branch of statistical physics [50–52]. Polymers pro-duced by living organisms are referred to as biopoly-mers. Two well-known examples of biopolymers are DNA and proteins, with nucleotides and amino acids as their monomers, respectively. Polymerization involves the combination of small molecules through chemical bonding to form a network at equilibrium called a poly-mer. Various authors have adopted two states of the polymer to model the architecture of chromosomal re-gions in a cell: the equilibrium globule [53, 54] and the fractal globule [37, 55, 56]. A characteristic feature of the equilibrium globule model is that it is highly knotted [30]. Mirny [37] has pointed out that this configuration is disadvantageous, as it restricts genomic processes such
as unfolding—an important property for gene
activa-tion—or refolding [57]. Alternatively, Barbieri et al. [55] showed that polymer collapse after exposure to a topo-logical constraint can result in the formation of a long-lived, untangled, non-equilibrium configuration state called a crumpled or fractal globule. A fractal glob-ule is knot-free, and it is organized such that it allows for unfolding or refolding processes while in a highly
compact state. Hence, the polymer exhibits a “
beads-o-n-a-string” configuration, with beads representing
monomers connected by linkers; DNA connections in eukaryotic chromatin are similarly configured. The frac-tal globule can be illustrated as a dense multicolor ball of yarn, where each color has its own end, but one can pull out threads with a specific color and put them back in, without disturbing the structure of the overall ball at all. This important property makes the fractal globule suitable for organizing chromatin in a cell because this topology facilitates rapid and easy unfolding, refolding [58], and large-scale opening of genome loci loop that affects and explains biological processes, e.g. the connec-tion of distal single-nucleotide polymorphisms (SNPs) with their target genes, gene activation, gene repression, or the cell cycle [59–63].
When studying these two globules, two biophysical properties are considered: the genomic distance between two loci and the probability of contact between them. It is worth noting that genomic distance (s) is measured by FISH and contact probability is obtained from chromo-some conformation methods such as Hi-C. The equilib-rium and fractal globules yield different estimates for these properties, and therefore also varying predictions on the three-dimensional distance between pairs of loci.
Lieberman-Aiden et al. [30] and Mirny [37] reports,
through simulation, that equilibrium and fractal globule scaling for three dimensional-distance are s1/2
and s1/3 (s: genomic distance - number of nucleotides between two loci), respectively. Equilibrium and fractal globule scaling for contact probability are s−3/2and s−1, respect-ively. As shown in [37], the properties exhibited by the fractal globule model make it more effective at fitting Hi-C data than the equilibrium globule.
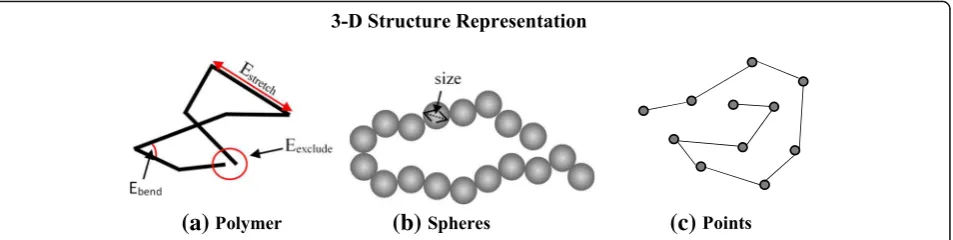
Some methods adopt the knowledge about polymer chain for chromosome structure representation by simu-lating a physically realistic, bead-chain polymer model of the 30-nm chromatin fiber [64, 65]. As a result, when constructing either a chromosome structure for instance, a locus for a chromosome is represented using a conven-tional beads-and-spring polymer model, where each bead represents a specific genomic location with well-defined initial and final genomic coordinates. Hence, viewing the chromatin fiber as a polymer model implies that conformation energies such as bending, stretching, and excluding energies of chromatin seg-ments needs to be considered and integrated with the IF for 3-D structure reconstruction (Fig.1a).
Spheres and Points
in a simplified model, where the spheres [66–68] or points [45,46,69,70] are synonymous to a chromosome
region or loci of a chromosome (Fig. 1b, c). Using a
beads on string configuration, each bead is modeled as a spherical shape with a defined radius, and an excluded volume used to penalize overlaps between two spheres. The defined radius and the sphere volume could conse-quently be considered as a restraint to be satisfied dur-ing the algorithm’s 3-D structure reconstruction process. The Points representation represent the chromatin re-gion simply as a point, with no radius nor volume, to mark the presence or absence of a loci.
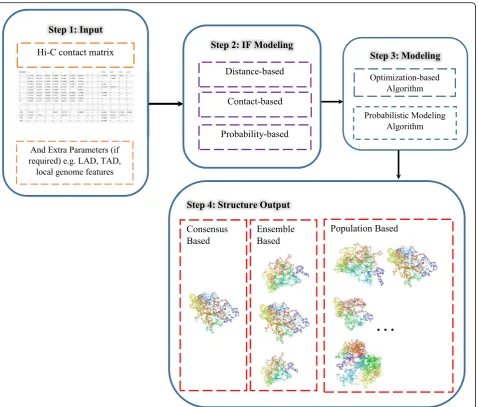
Methodologies for Chromosome and Genome 3-D Structure Reconstruction
The methods for chromosome and genome 3-D struc-ture inference are categorized below based on the IF modeling adopted by them. All methods adopt a step-wise approach to achieve the 3-D structure reconstruc-tion, and a summarization of these steps is provided in Fig. 2. In addition, the key properties of these methods are summarized in Table1.
Distance-Based Methods
Over the years, a number of approaches have been pro-posed for chromosome 3-D structure inference from Hi-C contact data. A group of these methods involve a two-step process: (1) IF is converted to distance, ultim-ately defining the problem of 3-D genome or
chromo-some structure reconstruction as a problem of
converting distances into 3-D coordinates; and (2) non-linear optimization is subsequently applied to the problem in order to find the genomic coordinates that satisfy converted distances. The most notable differences between these proposed methods are: (1) the way in which IF is converted into distance, and (2) the optimization technique used to infer the 3-D structure from loci distance. The aim of a distance-based model-ing is to create a map that shows the relative spatial po-sitioning of a number of objects whose inter-point
distance is known. Additionally, representing chromo-some structure prediction as a distance-based modeling problem is tempting because methods based on dis-tances are simple and clear: there is no ambiguity re-garding metric definition and proximity between objects can eventually be derived. In relation to 3-D genome structure prediction, the distance-based approach makes it easier to handle a large spectrum of modeling prob-lems at different Hi-C data resolutions.
The distance-based approach attempts to reproduce the original metric or distance as accurately as possible. The earliest application of the metric multi-dimensional
scaling (MDS) [82, 99] to chromosome 3-D
conform-ation construction, known as 5C3D [45], assumed that
the relationship of IF to distance between DNA frag-ments or loci follows an inverse relation; it then used an optimization approach to find the best 3-D conform-ation through a misfit objective function of the con-verted distance and the 3-D Euclidean distance between points. While this method was applied to the 5C variant of 3C data, it could be applied to Hi-C datasets as well. Similarly, in their work based on yeast 3-D genome
structure reconstruction, Duan et al. [66] designed a
metric that estimated the corresponding Euclidean distance from the mean of the curves obtained from two restriction enzyme libraries for each contact frequency. To aid modeling and ensure that intra- and inter-chromosomal features (e.g., centromeres), distance, and properties were satisfied [66, 67], researchers introduced a series of constraints such as minimum and maximum distances between adjacent beads, minimum distances between pair beads to avoid overlapping and clashes, specific positioning of RNA coding regions, telomeres, and centromeres to guide the construction of the 3-D model; this constituted an improvement over the
previous method. Duan et al. used IPOPT [71], an
open-source software for nonlinear constrained
optimization problems, to minimize the objective func-tion; this ensured that the predicted coordinates of two interacting loci, from which the distance between said
(a)
(b)
(c)
loci in the 3-D structure is derived, closely matched the expected distance obtained from IF. Tanizawa et al. [67] developed a method similar to [66] to construct the 3-D structure of the fission yeast genome.
Although Lieberman-Aiden et al. [30] showed that IF
can be used to determine the spatial distance between interacting loci, certain factors regarding this conversion are still worth considering. As shown by [76, 100–102] in their work, the IF-distance correlation might vary from one dataset resolution to another, and from one or-ganism to another. Hence, an efficient method is re-quired for a distance-based approach to generate a more reliable distance estimate from IF data. To solve this problem, Zhang et al. [76] made two novel propositions
for the two-step genome structure prediction pipeline. First, they used a modified version of the golden section search method [103] to determine the best scale param-eter, conversion factor (α), to convert IF to its approxi-mate distance equivalent:Dij∝Fij−α; this ensures that an appropriate conversion factor is obtained for each data-set. Secondly, for the 3-D structure prediction from a distance matrix, they presented an algorithm called ChromSDE (Chromosome Semi-Definite Embedding).
Unlike earlier methods, ChromSDE relaxed the
optimization problem to a semi-definite programming (SDP) problem. The proposed approach to IF-distance conversion defined by Zhang et al. introduced a new convention for defining the IF-distance relationship,
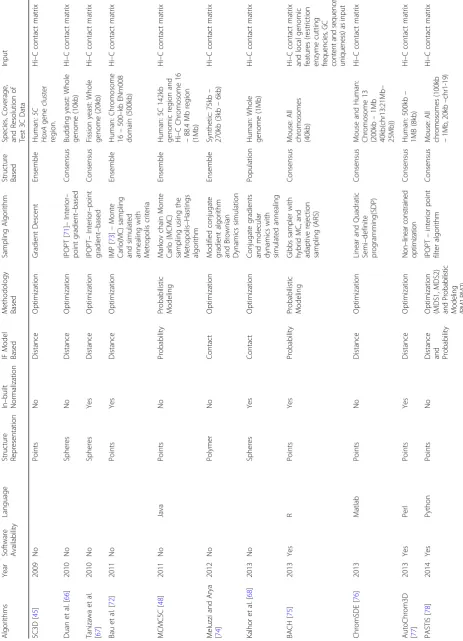
Table 1 A comparison of the methods for reconstructing 3-D chromosome and genome structure from Hi-C data Algorithms Year Software Availability Language Structure Representation In – built Normalization IF Model Based Methodology Based Sampling Algorithm Structure Based Species, Coverage, and Resolution of Test 3C Data Input 5C3D [ 45 ] 2009 No Points No Distance Optimization Gradient Descent Ensemble Human :5 C HoxA gene cluster region. Hi – C contact matrix Duan et al. [ 66 ] 2010 No Spheres No Distance Optimization IPOPT [ 71 ] – Interior – point gradient – based Consensus Budding yeast: Whole genome (10kb) Hi – C contact matrix Tanizawa et al. [ 67 ] 2010 No Spheres Yes Distance Optimization IPOPT – Interior – point gradient – based Consensus Fission yeast: Whole genome (20kb) Hi – C contact matrix Bau et al. [ 72 ] 2011 No Points Yes Distance Optimization IMP [ 73 ] – Monte Carlo(MC) sampling and simulated annealing with Metropolis criteria Ensemble Human: Chromosome 16 – 500 – kb ENm008 domain (500kb) Hi – C contact matrix MCMC5C [ 48 ] 2011 No Java Points No Probability Probabilistic Modeling Markov chain Monte Carlo (MCMC) sampling using the Metropolis – Hastings algorithm Ensemble Human: 5C 142kb genomic region and Hi – C Chromosome 16 – 88.4 Mb region (1Mb) Hi – C contact matrix Meluzzi and Arya [ 74 ] 2012 No Polymer No Contact Optimization Modified conjugate gradient algorithm and Brownian Dynamics simulation Ensemble Synthetic: 75kb – 270kb (3kb – 6kb) Hi – C contact matrix Kalhor et al. [ 68 ] 2013 No Spheres Yes Contact Optimization Conjugate gradients and molecular dynamics with simulated annealing Population Human: Whole genome (1Mb) Hi – C contact matrix BACH [ 75 ] 2013 Yes R Points Yes Probability Probabilistic Modeling Gibbs sampler with hybrid MC, and adaptive rejection sampling (ARS) Consensus Mouse: All chromosomes (40kb) Hi – C contact matrix and local genomic features (restriction enzyme cutting fr eque n cie s, G C con te nt and sequence uniq ueness) as inpu t ChromSDE [ 76 ] 2013 Matlab Points No Distance Optimization Linear and Quadratic Semi – definite programming(SDP) Consensus Mouse and Human: Chromosome 13 (200kb – 1Mb 40kb(chr13:21Mb – 25Mb)) Hi – C contact matrix
AutoChrom3D [77
] 2013 Yes Perl Points Yes Distance Optimization N o n – line ar constrained optimizatio n Consensus Human: 500kb – 1MB (8kb) Hi – C contact matrix PASTIS [ 78 ] 2014 Yes Python Points No
Table 1 A comparison of the methods for reconstructing 3-D chromosome and genome structure from Hi-C data (Con tinued) Algorithms Year Software Availability Language Structure Representation In – built Normalization IF Model Based Methodology Based Sampling Algorithm Structure Based Species, Coverage, and Resolution of Test 3C Data Input ShRec3D [ 79 ] 2014 Yes Matlab Points No Distance Optimization Shortest-path Floyd-Warshall algorithm Consensus Human: Chromosome 1 – 30Mbp region (3kb -150kb) Hi – C contact matrix MOGEN [ 49 , 80 ] 2014 Yes Java Points No Contact Optimization Gradient descent Ensemble Human: All chromosomes and whole genome (200kb -1Mb) Hi – C contact matrix FisHiCal [ 81 ] 2014 Yes R Points Yes Distance Optimization SMACOF algorithm [ 82 ] Consensus Human: Whole genome (1Mb) Hi – C contact matrix
InfMod3DGen [64
] 2015 Yes Matlab Polymer No Distance Probabilistic Modeling Gradient ascent Ensemble Yeast: All chromosomes – 12.1Mb genome (10kb) Hi – C contact matrix Gen3D [ 83 ] 2015 Yes C++ Points No Contact Optimization Adaptation, Simulated annealing and Genetic algorithm Consensus Human: All chromosomes (1Mb) Hi – C contact matrix MBO [ 84 ] 2015 Yes Matlab Points No Distance Optimization Manopt – manifold optimization Consensus Mouse: Chromosome X (50kb -600kb) Hi – C contact matrix TADbit [ 85 ] 2016 Yes Python Spheres Yes Distance Optimization Simulated Annealing and Monte Carlo Sampling Ensemble Drosophila Fly: 52Mb region (10kb) Hi – C contact matrix HSA [ 47 ] 2016 Yes R Points Yes Distance Optimization GLM framework with Hamiltonian dynamics with simulated annealing Consensus Human and Mouse: All chromosomes (25kb -1Mb) One or more raw contact maps or normalized Hi – C contact matrix.
Chromosome3D [46
Table 1 A comparison of the methods for reconstructing 3-D chromosome and genome structure from Hi-C data (Con tinued) Algorithms Year Software Availability Language Structure Representation In – built Normalization IF Model Based Methodology Based Sampling Algorithm Structure Based Species, Coverage, and Resolution of Test 3C Data Input EVR [ 97 ] 2018 Yes C, Python Points No Distance Optimization Error-Vector Resultant algorithm Consensus Bacteria: All chromosomes (10kb) Hi – C contact matrix
Hierarchical 3DGenome [98
followed by a series of distance-based algorithms that were subsequently developed.
According to Yaffe and Tanay [104], raw Hi-C data ob-tained from 3C experiments may contain numerous sys-tematic biases, such as GC content, length of restriction
fragments, and mappability between fragments. L
ong--range frequencies are typically noisy and unreliable; this represents a substantial drawback for the construction
of 3-D chromosome and genome structures. In order to
overcome these limitations, a number of methods have been developed to pre-process Hi-C data through normalization [9,42,104–108] before using the data for 3-D reconstruction. Alternatively, certain algorithms for 3-D structure construction incorporate bias removal.
Peng et al. [77] proposed a normalization approach to
reduce experimental sequencing depth bias, which af-fects the IF yielded by Hi-C data and makes it hard to compare structures from data obtained from different experiments. The method, called AutoChrom3D, pro-vides an automated pipeline for 3-D modeling, enabling structural comparison at various data resolutions. Two linear transformations were used to determine the frequency-distance correlation, and structure was pre-dicted through nonlinear constrained optimization.
Sha-vit et al. [81] designed an MDS-based optimization
approach that used FISH distance to guide the conver-sion of IF to Hi-C loci distances; this approach aimed to reduce noise, improve the data quality, ensure the consistency of data used for 3-D structure construction, and cover key functionality features in the Hi-C and FISH datasets, which will eventually overlap if these fea-tures are vital. Zou et al. [47] designed a flexible
algo-rithm capable of handling biases introduced by
restriction enzymes during Hi-C data sequencing. Re-striction enzymes are known to have various cutting sites across the genome, so combining different Hi-C tracks provides further information about genomic loci for modeling. The tool developed by Zou et al., called HSA, takes advantage of the uniqueness of the contact map obtained from different restriction enzymes in Hi-C experiments; it creates a generalized linear model through an iterative algorithm that combines simulated annealing and Hamiltonian dynamics. By using HSA, Zou et al. discovered that the obtained 3-D structure fits the contact map obtained from different restriction
en-zymes. Bau et al. [72] performed a log transformation
and the Z-score computation to normalize the contact counts. They converted observed interactions between loci to points and spatial restraints, and used the
Inte-grative Modeling Platform (IMP) [73] to produce
pos-sible confirmations that satisfies their defined
constraints and maximizes their structure to fit the IF data. Each loci was first represented as a point con-nected by a “string” to create a pairwise interaction in
which the length of the string depended on the number of interactions between the loci.
To date, a number of other distance-based methods have been developed. These algorithms create 3-D models by first converting contact frequency to distance [9, 46, 69, 70, 77, 88, 97, 109, 110] and then apply optimization to predict chromosome structure. Usually, these methods perform chromosome 3-D reconstruction by first defining a random 3-D structure; this structure coordinates are then updated by an objective function that is iteratively optimized until a convergence condi-tion is satisfied. Chromosome3D [46], applied a modified version of the distance geometry simulated annealing (DGSA) based method for chromosome and genome 3-D structure reconstruction from Hi-C data. The DGSA method has been popularly used for protein structure construction over the years and implemented in the Crystallography & NMR System (CNS) suite [111, 112]. The Hi-C distances are used as restraints for the defined simulated annealing (SA) optimization pipeline. SA is carried out through multiple steps of temperature change until the defined structure energy is optimally minimized. Because Chromosome3D uses one of the rigorously tested approaches in protein structure to in-ferring chromosome and genome 3-D structure, it is re-liable and robust against noise in Hi-C data.
LorDG [69] introduced a novel method to address
in-consistent chromosomal contacts generated from
multi-cell Hi-C data. It used a nonlinear Lorentzian function as the objective function—to enforce the satis-faction of consistent restraints, which is resistant against noisy distance restraints. Unlike the square error func-tion that is susceptible to outliers, LorDG aims to maximize the satisfaction of realistically satisfied re-straints rather than unsatisfiable noisy ones. The object-ive function is optimized by the highly scalable adaptobject-ive step-size gradient descent method. Its resilience against noisy contacts and scalability make it a suitable method for constructing the structure of the entire genome
in-volving noisy inter-chromosomal contacts. 3DMax [70]
defined a maximum likelihood objective function for chromosome 3-D structure inference from Hi-C data. It is based on the simplified assumption that the contact data is normally distributed and that each Hi-C data point is conditionally independent given a structure. A log likelihood objective function for chromosome struc-ture reconstruction was defined in order to determine the structure that maximizes the likelihood function. 3DMax uses a variant of gradient ascent called Adagrad
[113] that adapts the learning rate to each objective
miniMDS [92] and Hierarchical3DGenome [98] are the distance-based algorithms that reconstruct high-resolution 3-D models at the topologically associating domain (TAD) level. Eventually, these TAD models are assembled to form a complete, high-resolution 3-D chromosomal structure. After the assembly of TAD models, Hierarchical3DGenome uses the contacts be-tween all regions in a chromosome to further refine the assembled whole chromosome model, which leads to high-resolution (e.g. 5 KB) models of good quality.
The conformational space of a chromosomal structure is large, given that Hi-C data are drawn from a popula-tion of cells, each with its own independent and unique 3-D structure. Hence, an ensemble of predicted struc-tures obtained through so-called ensemble-based model-ing appears to provide a better representation of chromosomal structure than a single structure obtained through consensus modeling. Unfortunately, like Hi-C data at large, this dataset contains a number of biases: the fact that it is noisy, coupled with other technical fac-tors, makes it extremely difficult to determine the vari-ous unique 3-D structures of cells used in Hi-C experiments. Due to the drawbacks involved in using multi-cell Hi-C data, studying single-cell Hi-C data has become increasingly relevant [34]. In particular, it does not require designing an algorithm to satisfy the variabil-ity of each cell used in the Hi-C experiment. As ex-pected, single-cell Hi-C datasets are sparser than multi-cell Hi-C datasets. Hence, conventional distance-and restraint-based methods are not suitable for 3-D structure reconstruction based on these data. Carstens et al. [90] extended Rieping et al.’s [114] Bayesian prob-abilistic framework to statistically infer ensembles of 3-D chromosome structures from single-cell Hi-C data using MCMC sampling. They combined single-cell Hi-C con-tact information with FISH data and a coarse grained model of the chromatin fiber. Lesne et al. [79]
formu-lated a two-step algorithm known as “shortest-path
re-construction in 3-D” (ShRec3D), which combines the
shortest-path distance between two points from graph theoretic methods with MDS to achieve chromosome
reconstruction. This method is designed for both
multi-cell and single-cell Hi-C data. In the case of single-cell Hi-C data, instead of distances between two points, binary numbers signify the presence or absence of interaction. ShRec3D+ [96] extended Lesne et al.’s al-gorithm by using a golden-section alal-gorithm (an ap-proach similar to Zhang et al. [76]) with an adaptable distance conversion factor for different Hi-C chromo-some datasets. Wang et al. [64] proposed a method that combined knowledge of the conformational energy model of a chromatin structure and a Bayesian inference approach. They represented the chromosome structure as a polymer model with a conformational energy, and
integrated the IF data as input for an expectation maximization based algorithm under a Bayesian like framework. They took advantage of the prior informa-tion about the conformainforma-tion energy to construct a Bayesian inference of the chromatin structure. An
ap-proach proposed by Paulsen et al. [84] employed
manifold-based optimization (MBO), which is basically the application of optimization techniques to the mani-fold of positive semi-definite matrices of fixed rank
[115]. Paulsen et al. reported that MBO is capable of
generating a consensus 3-D chromosome structure con-sistent with the original contact map.
Another approach for solving the distance-based
prob-lem is called non-metric multidimensional scaling
(NMMDS), which assumes that only distance ranks are known; distances themselves are not provided. The method aims to yield a map of these ranks [116, 117]. Using this approach, Ben-Elazar et al. [118] developed a method for structure prediction based on the hypothesis that a pair locus A with a higher IF is closer in 3-D space than any other locus pair B with a lower frequency. Varo-quaux et al. [78] also proposed an optimization method to
solve the NMDS problem by minimizing the
Shepard-Kruskal scaling cost function [119].
Contact Based Methods
Certain methods do not convert IF but use it directly for modeling. These methods are regarded as contact-based methods [15,80,83,91,93]. MOGEN [49,80] used con-tact directly and designed an optimization-based
ap-proach that relied mostly on Hi-C intra- and
inter-chromosomal contact data to build an ensemble of 3-D conformations for genome and chromosome struc-tures. The contact-based optimization is carried out by the adaptive step-size gradient descent/ascent method that is highly scalable and therefore is well suited for large-scale genome structure modeling. MOGEN does not require two contacted regions to satisfy a specific distance as the distance-based approach does. Instead it only tries to make the distance between the two contact regions below a threshold (i.e. in contact). MOGEN is capable of producing ensemble models that are highly consistent with each other. MOGEN is also robust against noise in the data, particularly the noise in inter-chromosomal contacts, and therefore it is able to build 3-D structures of large genomes such as the entire
human genome. Gen3D [83] used a series of
geometry embedded in a high-dimensional (Hi-C) space, while satisfying certain defined conformation energy re-quirements. An improvement over this method inte-grates Hi-C data with FISH data for 3-D structure inference [94]. To ensure the modeling of realistic struc-tures consistent with cellular organization, Paulsen et al.
[91] introduced Chrom3D, a genome-modeling
algo-rithm that combines Hi-C and Lamina-associated do-main (LAD) information from ChIP-seq data to generate an ensemble of 3-D genome structures in which loci and TAD positioning and interaction requirements are satisfied.
On the other hand, certain methods convert contact frequency into defined spatial restraints. As is the case with distance-based approaches, these restraints are sat-isfied through an optimization method. In their seminal study, Kalhor et al. [68] developed a 3C variant known as tethered conformation capture (TCC), aimed at in-creasing the signal-to-noise ratios in conformation cap-ture experiments. This is relevant because it allows for a more accurate representation of IF, especially for gen-ome structure analysis, where low inter-chromosomal interactions are recorded using existing approaches. Using TCC data, researchers proposed a novel modeling approach whereby a variety of genome structures were generated. This approach, called population-based mod-eling, produces a population of structures representative of genomic configuration and consistent with contact probability. Serra et al. [85] followed certain constraints in order to transform IF into spatial restraints; for in-stance, consecutive and non-consecutive loci were treated differently. As in the case of Bau et al. [72], these restraints were satisfied by using the IMP.
Probability Based Methods
Methods in this category define a probabilistic measure for contact frequency, hence their name. Using a probabil-istic approach to model 3-D structures has a number of advantages; key among them is that such an approach al-lows uncertainties in experimental Hi-C data to be easily
considered through probabilistic representation. In
addition, statistical calculations of specific structural prop-erties or noise sources can be carried out. Due to the fact that Hi-C data are drawn from cell populations, IF can be considered as an average; most probability-based methods assume that an ensemble of structures underlies a contact map. In addition, they consider the problem of 3-D struc-ture inference as either a Bayesian inference problem or a maximum likelihood problem. However, some probabilis-tic modeling may be more time consuming than other methods.
Rousseau et al. [48] developed the first method in this category, called MCMC5C. They defined a probabilistic model of IF and used a Markov chain Monte Carlo
(MCMC) sampling to generate an ensemble of struc-tures. MCMC5C through a Gaussian model based on Hi-C data, whose variance was estimated using an im-provised approach. A MCMC sampling-based algorithm was selected over alternatives methods because of its in-herent ability to estimate the distribution of various structural properties. As previously mentioned, raw Hi-C data contain a number of systematic biases such as GC content, restriction enzyme cutting frequency, and sequence uniqueness [104]. These factors all need to be considered when designing a 3-D genome reconstruc-tion method. To overcome these limitareconstruc-tions, Hu et al.
[75] proposed two Bayesian models for 3-D genome
structure reconstruction from Hi-C data. Their methods combined bias removal with 3-D genome structure con-struction. They corrected known biases and used a Pois-son model to fit contact data, an improvement over MCMC5C when it came to estimating the Gaussian variance. Varoquaux et al. [78] also defined a probabilis-tic model of IF. Similar to the model defined by Hu et al., it defined the structure inference problem as a max-imum likelihood problem and used an optimization method to solve it.
A typical drawback of high-resolution Hi-C data is the sparsity of long-range contacts on the contact matrix and the high proportion of zero-contact counts between loci in the matrix. Hence, certain existing methods might be incapable of modeling at a higher resolution. Park and Lin [87] proposed an algorithm that is robust to resolution specification and corrects known system-atic biases. They modeled the contact count using a Poisson distribution and addressed excess zero problems in high resolution datasets. They suggested that these problems could be solved by adjusting the Poisson distri-bution adopted for modeling.
Nagano et al. and Stevens et al. [34, 120,121] applied a simulated annealing technique to sample single-cell datasets, while sometimes using contacts as distance re-straints at different data resolutions. A novel study by Tjong et al. [86] has proposed a population-based
mod-elling approach called PGS. Different from the
ensemble-based approach—where a variety of structures
with different variabilities are generated to simulate the
heterogeneity of cells in the Hi-C experiment—the
population of genome structures generated by PGS is consistent with the normalized contact probability matrix. Tjong et al. have formulated a probabilistic framework that uses an EM algorithm with constraint assignment at the E step and optimization of the struc-ture population through simulated annealing and conju-gate gradient descent at the M step. This method takes advantage of other external experimental data, such as lamina information for improved modeling. Rosenthal et
contacts in single-cell Hi-C contact maps by filling miss-ing parts with structures obtained from the correspond-ing cell populations, while imposcorrespond-ing certain penalties on the generated structures.
Correcting Biases in Hi-C Data by Data Normalization
As is the case for most sequencing experiments, raw Hi-C data contain several systematic biases that could potentially affect the 3-D genome reconstruction. An inexhaustive list of these systematic biases include GC content, distance between restriction sites, restriction enzyme cutting frequency, sequence uniqueness, and ex-perimental artifacts [104]. In a Hi-C experiment proto-col, a minimum of 25 million cells was used to produce a Hi-C library [27, 30, 38, 69] with the goal of analyzing the contact frequencies between genomic sites in a cell population. One of the reasons for using a population of cells in Hi-C experiments is more sequence reads can be produced from a population of cells than a single cell.
The number of paired-end reads linking two genomic regions is interpreted as the interaction frequency be-tween two genomic regions. This implies that a higher interaction frequency on a contact map means that a higher read count was observed, and that the two re-gions are spatially close to each other. However, many of these systematic biases affect the observed Hi-C read counts for two interacting regions (or fragments) on a contact matrix [106]. Hence, when these biases are left unhandled, the 3-D model construction is predicated on inaccurate information and consequently may be ad-versely affected. Additionally, if the effect of duplication, deletion, inversion and ploidy is significant in the pair reads, this could cause a direct effect on the number of paired-end reads linking two genomic regions which will alter the derived contact map. Because the Hi-C contact data is used for 3-D genome modeling, the level of cor-rectness of the Hi-C data largely determines the accur-acy of the generated model.
To overcome these limitations, most 3-D reconstruc-tion methods apply normalizareconstruc-tion methods that focus on removing biases introduced by experimental proce-dures and by intrinsic properties of the genome to pre-process the data [9, 42, 104–108]. With the application of a normalization and pre-processing technique before 3-D genome reconstruction, the noise and systematic biases introduced by external factors, such as DNA shearing, and cutting, during the Hi-C experiment makes the Hi-C data more suitable for chromosome/ genome 3-D structure reconstruction. Alternatively, some probability-based reconstruction methods handle the noise and biases differently by taking the biases into consideration in their algorithm design [75].
A common problem observed in some Hi-C data is the omission of the contact frequency of some genomic positions in the contact matrix. When this occurs, the reconstructed 3-D model from this data varies across the different tools due to difference in the way the methods represent omissions in their 3-D model. Gener-ally, this leaves some doubt about which 3-D model is better when this occurs.
Validation and Evaluation
According to the literature on chromosome and genome 3-D construction methods, algorithms are most often validated by a simulated dataset to assess their recon-struction ability, the consistency with the Hi-C data, known genome and chromosome structural features [49], or Fluorescence in situ hybridization (FISH) data. In the simulation case, most methods use a 3-D polymer model meant to serve as a gold standard model with which to compare the final 3-D reconstructed structure. A set of chromosomal contact data is then simulated from this structure, and a certain degree of Gaussian noise is often added to the data as well. The noise is usually added to assess the methods’responsiveness and accuracy to noisy data. Eventually, the algorithms’ability to reconstruct the true model is tested. A commonly used synthetic dataset is the one generated by Trussart et al. [122]. Trussart et al. created a series of simulated Hi-C contact matrices in which genomic architectures are pre-defined, and the noise level and structural vari-ability (SV) are both simulated.
FISH provides a powerful tool for identifying the loca-tion of a DNA sequence. It is used to study the 3-D organization of chromosomes and genomes and deter-mine the proximity of a gene relative to other genes through the use of fluorescent probes [123]. It has been determined to be much more accurate, simple, and reli-able than all other molecular profiling techniques [124]. Hence, it is often used to determine the distance be-tween loci in a genome and for single-cell analysis of gene and loci positioning [125–128]. However, its major limitations are low throughput and resolution at higher scales, such as the entire genome or an ensemble of cells. Nonetheless, FISH data can be used to validate the distance between loci in a reconstructed 3-D structure at a lower scale. Given that the FISH method is consid-ered reliable, it is useful in the study of chromosomal and genomic 3-D spatial organization when loci in the structure being evaluated are physically proximal.
and the Euclidean distance of the 3-D chromosomal structure. Since these metrics are obtained for distance, they are sometimes referred to as the distance Pearson correlation coefficient (dPCC), the distance Spearman Correlation Coefficient (dSCC), and the distance root mean square error (dRMSE). The value of dSCC and dPCC is in the range of−1 to + 1, with higher values be-ing preferable. In the case of dRMSE, on the other hand, a lower value is preferred. The latter may vary between 0—which signifies no difference between distances—and a large upper limit dependent on the number of frag-ments in the structure being compared when they are completely different. The dRMSE is also an appropriate metric to assess the similarity between 3-D structures. In order to do so, a linear transformation that includes translation, orthogonal rotation, and rescaling is per-formed on one of the structures, so that they are at the same 3-D-coordinate scale as in [49].
Let the pairwise distance between Hi-C data IF be rep-resented by the vector {Di,…, Dn} and the Euclidean dis-tance between loci in a 3-D chromosome model be represented as {EDi,…, EDn}, where n is the number of loci pairwise distances. The dSCC, dPCC, and dRMSE can be computed as shown below:
(1) The dPCC is defined as:
dPCC¼
Pn
i¼1 Di−D
0
EDi−ED0
ffiffiffiffiffiffiffiffiffiffiffiffiffiffiffiffiffiffiffiffiffiffiffiffiffiffiffiffiffiffiffiffiffiffiffiffiffiffiffiffiffiffiffiffiffiffiffiffiffiffiffiffiffiffiffiffiffiffiffiffiffiffi Pn
i¼1
Di−D0 2P
n
i¼1
EDi−ED0 2 r
where:
DiandEDiare single distance samples indexed with
i,
nis the number of loci pairwise distances,
D0and ED0 represent sample means. D0¼1
n Pn
i¼1Di,
ED0 =1nPni¼1EDi .
(2) The dSCC is defined as:
dSCC¼
Pn
i¼1 Ai−A0
Bi−B0
ffiffiffiffiffiffiffiffiffiffiffiffiffiffiffiffiffiffiffiffiffiffiffiffiffiffiffiffiffiffiffiffiffiffiffiffiffiffiffiffiffiffiffiffiffiffiffiffiffiffiffiffiffiffi Pn
i¼1 Ai−A0Þ2Pni¼1 Bi−B0Þ
2
r
dSCC is calculated by converting distance variable Di andEDiinto ranked variablesAiandBi i, and then, com-puting the dPCC between the ranked variables. Hence,
the pairwise distances Di and EDi are converted into
ranked variablesAiandBirespectively, where:
AiandBiare the ranks of two distances,DiandEDi
respectively.
A0 andB0 represent sample means of rank.
A0¼1 n
Pn
i¼1Ai,B
0
=1
n Pn
i¼1Bi.
(3) The dRMSE is defined as:
dRMSE¼
ffiffiffiffiffiffiffiffiffiffiffiffiffiffiffiffiffiffiffiffiffiffiffiffiffiffiffiffiffiffiffiffiffiffi 1
n
X
Dij−EDij
2
r
whereDijandEDijrepresent the pairwise distance
between loci i and j of the Hi-C IF data and 3-D structure Euclidean distance
nis the number of loci pairwise distances.
Microscopy-Based Techniques for Studying Genome Organization
Although this review highlights the methods for genome structure reconstruction from Hi-C data, it is note-worthy to examine the complementary imaging methods used for studying the genome organization before and after the emergence of high-throughput sequencing techniques. For many years, the structure of the genome has been studied through various microscopy techniques [23, 129–134] which can be broadly divided into elec-tron and light microscopy.
The light microscope alternatively referred to as the optical microscope is a well-known research tool that uses visible light to detect small objects. Over the years, light microscopy has greatly enhanced the study of the events and the structural details in the cell nucleus. However, the light microscopy techniques have a well-known limitation for being unable to overcome the diffraction barrier. As a solution to this, several strat-egies have been proposed to bypass the diffraction bar-rier of light microscopy and increase resolution. These strategies are called the super resolution microscopy strategies. They include saturated structured illumin-ation microscopy (SSIM), stimulated emission depletion (STED), and ground state depletion (GSD) [20, 21]. The introduction of Stochastic super-resolution microscopy techniques such as Photo-activated localization micros-copy (PALM or FPALM) and stochastic optical recon-struction microscopy (STORM) ushered in a new wave
135]. These techniques allow obtaining images at a higher resolution because they are not limited by the diffraction barrier in optical microscopy. These methods use flores-cent probes for imaging in multiple colors and support the selection of many fluorescent molecules at a very high resolution to build point by point images that display the
relationship between points [135]. The STORM and
PALM techniques elevated the visualization of the gen-ome structure to an incredibly high resolution. Ricci et al.
[136] used the STORM technique to visualize the
chro-matin fiber structure of different cells at a nanoscale reso-lution, single cell level, which revealed nucleosome groups along the chromatin fiber which they called“nucleosome clutches”
One type of light microscopy technique, fluorescence microscope, uses fluorescence and phosphorescence to study the properties of and visualize an object or cellular component of a cell. The fluorescence microscopy tech-nique uses a light intensity that is significantly higher
than other light microscopy techniques [137–139].
Fluorescence microscopy technique is effective at visual-izing fluorescent dyers stains [140–142] as well as auto-fluorescence cellular structures i.e. biological structures which naturally emit fluorescent light [139]. The tech-nique is also used when studying the expression and the localization of proteins using fluorescent antibodies in a biochemical strategy called immunofluorescence. The fluorescence dyers stains are used to determine cellular structure and identify specific targets of interest within a cell. A major limitation of the fluorescence microscopy technique is photobleaching. Photobleaching causes the fading of the dye or a fluorophore molecule making it lose its fluoresce properties, hence rendering the protein molecules or object invisible. Fluorescence recovery after photobleaching (FRAP) [143,144], and Fluorescence loss in photobleaching (FLIP) [145] analysis are fluorescence microscopy technique used to examine diffusion and molecular movement respectively in a cell. FLAP, FRET and FLIM are also advanced fluorescence microscopy techniques that are used in biological and biomedical research [146].
For some time, the 3-D genome organization was largely discovered through the fluorescent in situ hybridization (FISH) technique. The FISH [2, 18, 19] technique uses a florescence probe to detect specific DNA (or RNA) sequences or selected genome loci in single cell nuclei by light microscopy. Today, there are different types of FISH, each with their specialized
func-tion e.g. DNA-FISH, RNA-FISH, cryo-FISH e.t.c. [147].
These variants are more prolific than FISH because of their accuracy, and reliability. FISH techniques allow the conceptualization of the arrangements of genetic mate-rials in the cell nucleus. The FISH technique has re-vealed that the chromosomes occupy discrete territories
in the cell nucleus, referred to as chromosome territories (CT) [2,148], CT intermingle significantly in the nucleus of human cells [149], the influence of gene density and tran-scription on chromosome organization in the nucleus [150, 151], and the genome organization in the nucleus based on the partitioning of the chromosomes regions according to the gene distribution [152, 153]. The findings have in-creased the understanding about the genome architecture and behavior in the nucleus of the cell. However, the FISH technique can only be used to examine predetermined regions in cells. To resolve this, a fully automated FISH-based imaging pipeline called High-throughput im-aging position mapping (HIPMap) was developed to perform high-precision, high-throughput, automated fluor-escent in situ hybridization imaging of the spatial location of genome regions at large scale [154].
Electron microscopes uses a beam of high energy elec-trons to examine objects and obtain information about that object or a specimen. This provides the information about the surface characteristics, composition of the ele-ments that makes up the object, the particles within the objects, and the arrangement of the atoms within the object. It was developed due to inability of the light microscope to examine the information about structure of smaller objects. The development of the electron microscope improved the resolution so that tiny objects e.g. atom can be observed under this microscope. To examine objects only observable at the higher resolution e.g. the examination of a cell nucleus, the Electron microscopic techniques such as the, Transmission Elec-tron Microscope (TEM) where instead of using light to illuminate the specimen, a high energy electric beam is used. The scanning electron microscope (SEM), reflec-tion electron microscope (REM), scanning transmission electron microscope (STEM), and the cryo-electron mi-croscopy (Cryo-EM) are other forms electron micro-scopes techniques each with the unique method for how the structure and composition information is gained from the object [155–159]. Cryo-EM especially has pro-duced very useful insights by enabling the determination of atomic resolution level macromolecular structures [160–162]. In protein structure research, Cryo-EM has been used to capture protein structure in its native state. Some methods have been developed to complement the
microscopy techniques. Ou et al. [163] combined
elec-tron microscopy with a labeling method to reveal the 3-D organization across multiple scales in the cell nu-cleus They developed a method called ChromEMT that reveals the 3-D packing of the DNA in cells, and through their method reveled information about the DNA folding as it relates to the genome compaction in the cell nucleus.
organization and architectural arrangement in the nu-cleus while providing explanation for nuclear posi-tioning in the cell nucleus. Some of these findings
include: the discovery of chromosome territories [2],
the organization of gene clusters and their influence on transcription in the nucleus [51, 52], the segmen-tation of chromatin in the cell nucleus, for example, the active euchromatin and inactive heterochromatin
occupy separate environments in the nucleus [164],
and the existence of unique compartments that influ-ences functional interaction [165–168].
These methods provide valuable information regarding the genomes organization that can be used as base infor-mation when constructing models with Hi-C data. For example, it is common practice to use the results of FISH experiments as validation for chromatin conform-ation models generated by Hi-C experiments. This can be done by verifying that the spatial distances observed between multiple FISH probes are consistent with the predicted distance between the corresponding genome bins found in the Hi-C conformation model.
Despite the advancements in the FISH and the micros-copy approaches, they are limited to studying a region of genome, and do not provide a universal and
comprehen-sive view of the 3-D genome architecture [169] of the
whole genome. The need to study the genomic organization at a genome wide scale led to the develop-ment of the chromosome conformation capturing techniques. However, it is worth noting that the chromosome conformation capturing techniques and the imaging techniques of probing genome/chromosome structures are complementary and the latter can experi-mentally validate the former.
Summary and Future Insights
Our review of the methods for reconstructing the 3-D structure of the chromosome and genome has revealed that these methods can be largely categorized into three groups (distance-based methods, contact-based methods and probability-based methods) according to how IF is modeled. For each category, we have discussed their po-tential strength and weakness in reconstructing 3-D chromosome and genome structures. Although we have primarily grouped methods based on IF modeling, there are other ways they could be categorized. For instance, their classification could be based on the type of struc-ture they generate [72,78]. Methods that generate a sin-gle representative structure for a Hi-C dataset are consensus-based methods [66, 67]. Those that generate a variety of structures to represent the heterogeneity of Hi-C data are ensemble-based methods [45,48]. Finally, population-based methods [68,86,89] generate a popu-lation of structures that, as a whole, is statistically con-sistent with the Hi-C data.
Despite the improvement in 3-D structure modeling approaches, the lack of a real structure with which to contrast these models remains a challenge. In particular, it is currently difficult to confirm the true modeling cap-ability of 3-D genome methods. Although the introduc-tion of 3-D-FISH data and Hi-C data for joint modeling has received some attention recently [94], there is no sufficient 3-D-FISH data to guide most modeling on Hi-C data and to thoroughly validate the quality of com-putational models. The development of more advanced genome/chromosome imaging techniques will further improve the validation of 3-D genome models. In addition, other high-throughput sequencing data such as functional genomics and epigenomics data can be used to validate the biological validity of 3-D genome/ chromosome models by exploring their correlation with 3-D genomes.
Another challenge is to reconstruct high-resolution 3-D models of large genomes from Hi-C data,
which are needed for studying detailed interactions be-tween genes and regulatory elements, due to enormous time complexity and data sparsity associated with
high-resolution modeling. Only a few methods [98] was
designed to build high-resolution (e.g. 5 KB) models. Finally, it is important to make 3-D genome modeling methods easy for biomedical scientists to use in their re-search. To this end, a few tools have been designed to visualize 3-D genome models [88, 89, 170–174].
Re-cently, GenomeFlow [40] provides a comprehensive
graphical environment for users to process Hi-C data, generate chromosomal contact maps, build 3-D models, and apply 3-D models to integrate various omics data. More efforts of making 3-D genome modeling accessible to general users are still needed.
Abbreviations
3C:Chromosome conformation capture; 3-D: Three-dimensional; CNS: Crystallography & NMR System; dPCC: Distance Pearson correlation coefficient; dRMSE: Distance root mean square error; dSCC: Distance Spearman’s correlation coefficient; FISH: Fluorescence in situ hybridization; Hi-C: The name of a method an extension of 3C method that is capable of identifying read pair interactions on an“all-versus-all”basis—that is, it can profile interactions for all read pairs in an entire genome; IF: Interaction frequency; IMP: Integrative Modeling Platform; LAD: Lamina-associated domain; MDS: Multidimensional scaling; NMDS: Non-metric multidimensional scaling; TAD: Topologically associated domains; TCC: Tethered conformation capture
Acknowledgements Not applicable.
Funding
This work was supported by the National Science Foundation (NSF) CAREER award (grant no: DBI1149224) to JC.
Authors’Contributions
OO and JC designed the manuscript outlines. OO drafted the manuscript, and MH and JC revised it. All authors read and approved the final manuscript.
Ethics Approval and Consent to Participate Not applicable.
Consent for Publication Not applicable.
Competing Interests
The authors declare that they have no competing interests.
Publisher’s Note
Springer Nature remains neutral with regard to jurisdictional claims in published maps and institutional affiliations.
Received: 15 January 2019 Accepted: 1 April 2019
References
1. Misteli T. Beyond the sequence: cellular organization of genome function. Cell. 2007;128(4):787–800.
2. Cremer T, Cremer C. Chromosome territories, nuclear architecture and gene regulation in mammalian cells. Nat Rev Genet. 2001;2(4):292.
3. Branco MR, Pombo A. Chromosome organization: new facts, new models. Trends Cell Biol. 2007;17(3):127–34.
4. Hakim O, Misteli T. SnapShot: chromosome conformation capture. Cell. 2012;148(5):1068–e1.
5. Osório J. Chromosome biology: moving a TAD closer to unravelling chromosome architecture. Nat Rev Mol Cell Biol. 2015;16(12):701. 6. Dekker J, Mirny L. The 3D genome as moderator of chromosomal
communication. Cell. 2016;164(6):1110–21.
7. Shen Y, Yue F, McCleary DF, Ye Z, Edsall L, Kuan S, Wagner U, Dixon J, Lee L, Lobanenkov VV, Ren B. A map of the cis-regulatory sequences in the mouse genome. Nature. 2012;488(7409):116.
8. Makova KD, Hardison RC. The effects of chromatin organization on variation in mutation rates in the genome. Nat Rev Genet. 2015;16(4):213.
9. Cournac A, Marie-Nelly H, Marbouty M, Koszul R, Mozziconacci J. Normalization of a chromosomal contact map. BMC Genomics. 2012;13(1): 436.
10. Wasserman WW, Sandelin A. Applied bioinformatics for the identification of regulatory elements. Nat Rev Genet. 2004;5(4):276.
11. Taberlay PC, Achinger-Kawecka J, Lun AT, Buske FA, Sabir K, Gould CM, Zotenko E, Bert SA, Giles KA, Bauer DC, Smyth GK. Three-dimensional disorganization of the cancer genome occurs coincident with long-range genetic and epigenetic alterations. Genome Res. 2016;26(6):719–31. 12. Dekker J. Gene regulation in the third dimension. Science. 2008;319(5871):
1793–4.
13. Dekker J, Marti-Renom MA, Mirny LA. Exploring the three-dimensional organization of genomes: interpreting chromatin interaction data. Nat Rev Genet. 2013;14(6):390.
14. de Laat W, Grosveld F. Spatial organization of gene expression: the active chromatin hub. Chromosom Res. 2003;11(5):447–59.
15. Gorkin DU, Leung D, Ren B. The 3D genome in transcriptional regulation and pluripotency. Cell stem cell. 2014;14(6):762–75.
16. Woodcock CL, Dimitrov S. Higher-order structure of chromatin and chromosomes. Curr Opin Genet Dev. 2001;11(2):130–5.
17. Chromatin WA. San Diego: Structure and Function. San Diego, CA: Academic Press; 1998.
18. Langer-Safer PR, Levine M, Ward DC. Immunological method for mapping genes on Drosophila polytene chromosomes. Proc Natl Acad Sci. 1982; 79(14):4381–5.
19. Amann R, Fuchs BM. Single-cell identification in microbial communities by improved fluorescence in situ hybridization techniques. Nat Rev Microbiol. 2008;6(5):339.
20. Westphal V, Rizzoli SO, Lauterbach MA, Kamin D, Jahn R, Hell SW. Video-rate far-field optical nanoscopy dissects synaptic vesicle movement. Science. 2008;320(5873):246–9.
21. Hell SW, Wichmann J. Breaking the diffraction resolution limit by stimulated emission: stimulated-emission-depletion fluorescence microscopy. Opt Lett. 1994;19(11):780–2.
22. Betzig E, Patterson GH, Sougrat R, Lindwasser OW, Olenych S, Bonifacino JS, Davidson MW, Lippincott-Schwartz J, Hess HF. Imaging intracellular fluorescent proteins at nanometer resolution. Science. 2006;313(5793):1642–5.
23. Huang B, Babcock H, Zhuang X. Breaking the diffraction barrier: super-resolution imaging of cells. Cell. 2010;143(7):1047–58.
24. Dekker J, Rippe K, Dekker M, Kleckner N. Capturing chromosome conformation. Science. 2002;295(5558):1306–11.
25. de Wit E, de Laat W. A decade of 3C technologies: insights into nuclear organization. Genes Dev. 2012;26(1):11–24.
26. Han J, Zhang Z, Wang K. 3C and 3C-based techniques: the powerful tools for spatial genome organization deciphering. Mol Cytogenet. 2018;11(1):21. 27. Schmitt AD, Hu M, Ren B. Genome-wide mapping and analysis of
chromosome architecture. Nat Rev Mol Cell Biol. 2016;17(12):743. 28. Simonis M, Klous P, Splinter E, Moshkin Y, Willemsen R, De Wit E, Van
Steensel B, De Laat W. Nuclear organization of active and inactive chromatin domains uncovered by chromosome conformation capture– on-chip (4C). Nat Genet. 2006;38(11):1348.
29. Dostie J, Richmond TA, Arnaout RA, Selzer RR, Lee WL, Honan TA, Rubio ED, Krumm A, Lamb J, Nusbaum C, Green RD. Chromosome conformation capture carbon copy (5C): a massively parallel solution for mapping interactions between genomic elements. Genome Res. 2006; 16(10):1299–309.
30. Lieberman-Aiden E, Van Berkum NL, Williams L, Imakaev M, Ragoczy T, Telling A, Amit I, Lajoie BR, Sabo PJ, Dorschner MO, Sandstrom R. Comprehensive mapping of long-range interactions reveals folding principles of the human genome. Science. 2009;326(5950):289–93. 31. Kalhor R, Tjong H, Jayathilaka N, Alber F, Chen L. Genome architectures
revealed by tethered chromosome conformation capture and population-based modeling. Nat Biotechnol. 2012;30(1):90.
32. Fullwood MJ, Liu MH, Pan YF, Liu J, Xu H, Mohamed YB, Orlov YL, Velkov S, Ho A, Mei PH, Chew EG. An oestrogen-receptor-α-bound human chromatin interactome. Nature. 2009;462(7269):58.
33. Li G, Fullwood MJ, Xu H, Mulawadi FH, Velkov S, Vega V, Ariyaratne PN, Mohamed YB, Ooi HS, Tennakoon C, Wei CL. ChIA-PET tool for comprehensive chromatin interaction analysis with paired-end tag sequencing. Genome Biol. 2010;11(2):R22.
34. Nagano T, Lubling Y, Stevens TJ, Schoenfelder S, Yaffe E, Dean W, Laue ED, Tanay A, Fraser P. Single-cell Hi-C reveals cell-to-cell variability in chromosome structure. Nature. 2013;502(7469):59.
35. Ron G, Globerson Y, Moran D, Kaplan T. Promoter-enhancer interactions identified from Hi-C data using probabilistic models and hierarchical topological domains. Nat Commun. 2017;8(1):2237.
36. Fraser P, Bickmore W. Nuclear organization of the genome and the potential for gene regulation. Nature. 2007;447(7143):413.
37. Mirny LA. The fractal globule as a model of chromatin architecture in the cell. Chromosom Res. 2011;19(1):37–51.
38. Van Berkum NL, Lieberman-Aiden E, Williams L, Imakaev M, Gnirke A, Mirny LA, Dekker J, Lander ES. Hi-C: a method to study the three-dimensional architecture of genomes. J Vis Exp. 2010;6(39):e1869.
39. Ay F, Noble WS. Analysis methods for studying the 3D architecture of the genome. Genome Biol. 2015;16(1):183.
40. Trieu T, Oluwadare O, Wopata J, Cheng J. GenomeFlow: a comprehensive graphical tool for modeling and analyzing 3D genome structure. Bioinformatics. 2018;https://doi.org/10.1093/bioinformatics/bty802. 41. Durand NC, Shamim MS, Machol I, Rao SS, Huntley MH, Lander ES, Aiden EL.
Juicer provides a one-click system for analyzing loop-resolution Hi-C experiments. Cell Syst. 2016;3(1):95–8.
42. Servant N, Varoquaux N, Lajoie BR, Viara E, Chen CJ, Vert JP, Heard E, Dekker J, Barillot E. HiC-Pro: an optimized and flexible pipeline for Hi-C data processing. Genome Biol. 2015;16(1):259.
43. Castellano G, Le Dily F, Pulido AH, Beato M, Roma G. Hi-Cpipe: a pipeline for high-throughput chromosome capture. bioRxiv. 2015:020636.
44. Wingett S, Ewels P, Furlan-Magaril M, Nagano T, Schoenfelder S, Fraser P, Andrews S. HiCUP: pipeline for mapping and processing Hi-C data. F1000Research. 2015:4.