on Complex Networks
Ana Paula Appel, Adriano Arantes Paterlini, Caetano Traina Junior Computer Sciences Department, ICMC, University of S ˜ao Paulo
Av. Trabalhador S ˜ao-carlense, 400 - Centro
Postal code: 668 - CEP: 13560-970 - S ˜ao Carlos - SP - Brazil (anaappel, paterlini, caetano)@icmc.usp.br
Abstract. Complex networks are intrinsically present in a wide range of applications. Real world networks have several unique properties, such as, sparsity, node degree distribution, which follow a power law and a large amount of triangles that further form larger cliques. Triangles and cluster coefficient, which are usually used to find groups, are not always enough to distinguish a different node neighborhood topology. By using cliques of sizes 4 and 5, it is possible to study how triangles become involved to form large cliques. To retrieve these cliques calledκ4andκ5a novel technique called “FCR - Fast Clique Retrieval” has been developed, taking advantage of the data management and optimization techniques of a relational database management system and SQL to query cliques of sizes 4 and 5. This paper demonstrates that cliques (3, 4 and 5) follow interesting power laws that allow identifying nodes with suspicious behaviors. It also presents an extension of the cluster coefficient formula, which may become a valuable equation to identify nodes that most influence the network first eigenvalue.
Categories and Subject Descriptors: H.2 Database Management [H.2.8 Database Applications]: Data Mining
Keywords: cliques, cluster coefficient, graph mining, power law, RDBMS
1. INTRODUCTION
Complex networks, such as biological (protein, DNA), academic (DBLP, Arxiv) and social (Facebook, LinkedIn), have been increasing in size very quickly. Furthermore, complex networks have attracted the in-terest of research communities with very inin-teresting findings over the past years. Finding patterns in complex networks is extremely important, given that they help detecting abnormalities (outliers) and interesting regions in these networks. If most of the nodes in the network closely follow a power-law, then the few deviations that do exist are probably outliers. To find such patterns, there exists a large number of interesting tasks in complex network mining, such as node degree distribution, betweenness, cluster coefficient, among others [Newman 2003].
The fact that the majority of networks have a high number of triangles [Watts and Strogatz 1998] is common knowledge. For instance, in complex networks, especially in social ones, friends of friends are friends them-selves. Plenty of research has investigated the behavior of triangles on a network and how they can indicate the existence of larger cliques [Tsourakakis 2008], [Du et al. 2009].
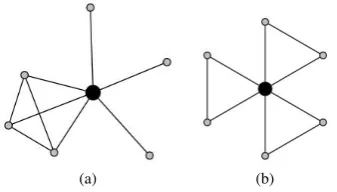
Cluster coefficient measures the percentage of a node’s neighbors that are neighbors to one another [Watts and Strogatz 1998]. It measures the degree of “cliquishness” of a graph. Figure 1 shows two nodes with the same cluster coefficient value (= 0.2), but different topologies. The distinction among different topologies is important, given that they can help, for instance, personalizing product recommendation.
Also, when the cliques, speciallyκ4andκ5, are analyzed on a network, what patterns do they follow? If someone has many “contacts” that are cliquesκ4andκ5, does that indicate popularity? The study ofκ4and
Authors would like to thanks the support of FAPESP, CNPQ and CAPES to the project.
κ5allows evaluating the overlapping among the several social circles that one frequents. An example is shown in Figure 1. The two nodes in black represent the differences between the node topology even when they have the same cluster coefficient.
(a) (b)
Fig. 1. Two graphs (a) and (b) showing a black node with the same cluster coefficient0.2, but distinct neighborhood topology. The node in (a) might be more popular that the node in (b).
It is straightforward that cliques of larger sizes, such as sizes 4 and 5 (here calledκ4 andκ5) can be very useful to spot nodes with different topologies given that their topology shows how the relationship of a node with its neighbors is. Besides, one can have a better picture of the social circles that a network has and also quantify how important a node is to the first eigenvalue. This task is a very important, specially for immunization in epidemics [Chakrabarti et al. 2008] and network resilience [Albert et al. 2000]. In this context, this paper proposes the extension of the cluster coefficient,Generic Cluster Coefficient, allowing the distinction of nodes in situations like the one depicted in Figure 1 and identification of nodes that most influence the complex network first eigenvalue.
Another interesting contribution of this work is theDegree Clique Law, which shows that not only triangles (κ3), but also cliques of other sizes, such asκ4andκ5, follow a power law correlated with the node degree. Moreover, the relations between the cliques and clique distribution follow the power laws namedPower Clique
LawandClique Distribution Law. These power laws help to investigate nodes with suspicious behaviors like
spammers. For example, a fake user could mimic a small social circle (triangles) by adding a person and some of his/her friends, however it would be more difficult to mimic a large social circle (cliques of size 4 and 5).
Considering that complex networks can be already stored in a relational table, the aim is to verify how feasible it is to use an RDBMS to retrieveκ4andκ5cliques. The last 40 years have proven how database query languages are valuable to access a large amount of data. SQL queries are easier to modify and understand [Rustin 1974]. Also, all of the modern Relational Database Management System (RDBMS) use hash or B-tree indexes to accelerate data access. Most database systems also support multiple indexes per table. Thus, the query optimizer can decide which index to use for each query or whether to simply perform a brute-force sequential search [Pavlo et al. 2009].
To findκ4andκ5a novel technique calledFCR - Fast Clique Retrievalhas been proposed. It is based on a RDBMS and allows users to use SQL to find these cliques in a faster way. This technique breaks the network into small ones to findκ4andκ5more efficiently and can be up to5xfaster forκ4and12xfaster forκ5than the direct processing, named here Standard Approach.
This paper is organized as follows: Section 2 introduces the graph terminology and the symbols used in the paper; Section 3 presents the existing related work; Section 4 proposes the Generic Cluster Coefficient; Section 5 explains the proposed method; Section 6 presents the FCRscalability; Section 7 discusses the laws found over real-world complex networks and, finally, Section 8 concludes the work.
2. TERMINOLOGY
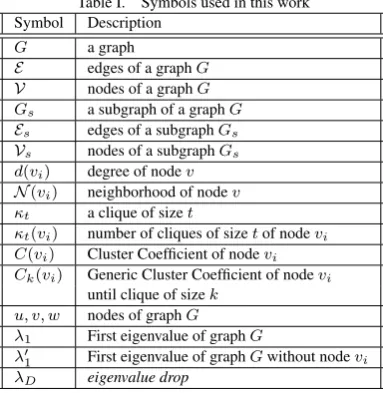
Table I. Symbols used in this work Symbol Description
G a graph
E edges of a graphG V nodes of a graphG Gs a subgraph of a graphG Es edges of a subgraphGs Vs nodes of a subgraphGs d(vi) degree of nodev N(vi) neighborhood of nodev κt a clique of sizet
κt(vi) number of cliques of sizetof nodevi C(vi) Cluster Coefficient of nodevi Ck(vi) Generic Cluster Coefficient of nodevi
until clique of sizek u, v, w nodes of graphG λ1 First eigenvalue of graphG
λ0
1 First eigenvalue of graphGwithout nodevi λD eigenvalue drop
N(vi) ={(vi, w)|vi, w∈ V ∧(vi, w)∈ E}is defined as the neighborhood of nodevi. The number of edges
in the neighborhood of nodeviis called itsnode degreed(vi).
DEFINITION 1. Subgraph:Gs= (Vs,Es)is a subgraph ofG= (V,E)ifVs⊆ VandEs⊆ E.
DEFINITION 2. Induced Subgraph:Gsis an induced subgraph ofGifVs⊆ VandEscontains all edges
ofEthat connect nodes inVs.
DEFINITION 3. complete graph or clique:κtis a graph withtnodes such that for every node pairu, v∈ V
there is an edge(u, v)∈ E.
In a graphG, a subset of nodesVs ⊆ V is a clique of size t(κt) if the induced subgraphGs onGis a
complete graph of sizet. A clique of sizet= 4is calledκ4andt= 5isκ5. The number of cliques of sizet that a nodeviparticipates in is represented asκt(vi).
The clustering coefficientC(vi)of a nodevi, given by Equation 1, is the proportion of edges between the
node within its neighborhood divided by the number of edges that could possibly exist between them.
C(vi) =
2∗κ3(vi)
d(vi)∗(d(vi)−1)
(1)
whereκ3(vi)is the number of triangles containingvi.
3. RELATED WORK
There exist a significant amount of research related to the problem in focus, which we categorize as cliques and other subgraphs, triangles, cluster coefficient, communities structure, and power law distributions.
Cliques and other subgraphs: The retrieval of either quasi-cliques or the largest clique in a graph have been studied by a large number of researchers [Liu and Wong 2008], [Zeng et al. 2007], [Modani and Dey 2008], [Stix 2004], [Du et al. 2009]. However, these works aimed to find maximal or quasi-cliques of any size, while the present work focuses only on cliques of sizes 4 and 5. One of the most pursued recent tasks in graph mining is how to discover subgraphs that frequently occur over a database with several graphs [Wang et al. 2005], [Han et al. 2007]. Many works, such as [Chakravarthy et al. 2004] and [Chakravarthy and Pradhan 2008] use a Relational Database System (RDBMS) to find the FSG (Frequent SubGraph), however, an FSG does not need to be a clique.
Triangles, cluster coefficient and Communities Structure: The network transitivity can be measured through the cluster coefficient [Watts and Strogatz 1998]. It is found that, in many networks, if nodev is connected to nodeuand nodeuto nodew, then there is a high probability that nodevwill also be connected to nodew. In social networks, this means that a friend of your friends is also likely to be your friend. In terms of network topology, transitivity means the presence of many triangles in the network, which is a triad of three nodes connected among themselves.
Several recent works, such as [Becchetti et al. 2008] and [Tsourakakis 2008], have aimed to count triangles without identifying them. For instance, the eigenvalue multiplication is used to find out the total number of triangles. In [Latapy 2008], the author proposes a fast algorithm to count triangles in graphs with a degree distribution that follows a power law. A triangle is also a cycle of size 3, as in the works of [Fronczak et al. 2002], [Caldarelli et al. 2004], which proposed a different cluster coefficient to count cycles of different sizes. However, those techniques count cycles, not cliques.
The cluster coefficient tends to be considerably greater for real networks than for a random graph with similar numbers of nodes and edges. The cluster coefficient is also known to be dependent on the node degree [Dorogovtsev et al. 2002], [Ravasz and Barabsi 2003]. The cluster coefficientC(vi)of a nodevidecreases as
its degreed(vi)increases, by following a power law for models like scale-free networks[Ravasz and Barabsi
2003]. This means that low-degree nodes tend to form highly connected groups, which are connected to each other and form larger groups. The presence of these larger groups, that is, cliques of size larger than 3, explains the “Small World” phenomenon [Watts and Strogatz 1998] and how the “Diameter evolves over time” [Leskovec et al. 2007]. In a social network these groups are seen as communities, where the edges between nodes represent friendship and nodes represent people. This property corresponds to the fact that people are more related to people from their own communities and less connected to people outside them.
In [Leskovec et al. 2008], the authors show that communities tend to be quite small, with no more than approximately 100 nodes, and barely connected to the rest of the network. Value 100 is known as Dunbar’s number, which is the number of connections that a person can handle [Dunbar 1998]. Also, most graphs exhibit
ajellyfishpattern [Tauro et al. 2001], which is a graph with a core that is a clique of high-degree nodes, and
also a first layer whose nodes are adjacent to the core. Nodes in the first layer have more one-degree nodes connected to them than to the core.
Power law distributions:Power-law distributions occur in many types of graphs of scientific interest and have significant consequences to the understanding of both natural and man-made phenomena. The growth of city populations, earthquake intensities and power outage ranges are very well known examples that follow power-law distributions. In graphs, we can highlight the node degree distribution [Chakrabarti and Faloutsos 2006], triangles distribution over node degree [Tsourakakis 2008], eigenvalue distribution [Faloutsos et al. 1999] and others all following power-law distributions. A distribution is a Power law if its probability density function (PDF) is as follows:p(x) ∝ x−α, wherep(x)is the probability ofxandαis the power law exponent
4. GENERIC CLUSTER COEFFICIENT
The analysis of a node neighborhood topology is an important task in social network mining. The Cluster Coefficient of a node indicates how strong the connectivity among its neighborhoods is. However, nodes that have the same degree and/or the same number of triangles are not always equivalent in terms of topology and connectivity, as the traditional Cluster Coefficient forces a social homogenization among the nodes of the network.
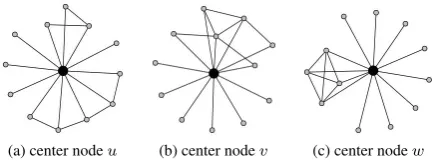
Figure 2 presents three subgraphs centered at nodes u, v and w. They have the same degree (d(u) = d(v) =d(w) = 12) and the same number of triangles (κ3(u) =κ3(v) =κ3(w) = 6), hence the same cluster coefficient12∗2(12∗6−1) = 0.09. However, they have different numbers ofκ4(κ4(u) = 0,κ4(v) = 1,κ4(w) = 4). In a social network, nodes can be viewed as people and edges as friendship. Nodeu shows a stronger connectivity with a selected group of neighbors (friends), while nodevshows a more uniform relationship of all its neighbors (friends). A node with a topology showing fewerκ4(vi)andκ5(vi)than others, but with same
d(vi)andκ3(vi), like nodeu, can represent a node that interacts clearly with more than one social cycle, given
that most of its neighbors are disconnected among themselves. The distinction of node neighborhood topology is an interesting task for system recommendation and personalization, since it can help finding groups of nodes that interact more clearly and can buy the same product or service.
(a) center nodeu (b) center nodev (c) center nodew
Fig. 2. Three subgraphs where the center nodesu, v, whave the same degreed(u) = d(v) = d(w) = 12andκ3(u) = κ3(v) =
κ3(w) = 6: (a) only triangles centered at nodew, (b) oneκ4centered at nodev, (c) fourκ4and oneκ5centered at nodeu
Nodes with different topologies like,u,vandwin Figure 2 can play different roles in the network. If some-one wants to know how closely a person interacts in his/her social groups, this interaction can be represented by node topology. For example, nodewis probably a node that has a strong interaction with a group of friends, since they form a clique of larger size, while nodeuinteracts almost the same way with all of its friends. Traditional Cluster Coefficient can not be used in situations like the one presented in Figure 2, since it is the same for all three nodes presented.
Based on this fact, we propose a modification in the cluster coefficient definition that considers a larger clique size. Besides, it is possible to emphasize the differences in node connectivity, as in the nodes shown in Figure 2, adding components to the original cluster coefficient up to a desired sizetof counted cliques.
The maximum number of possible cliques of sizetgiven the number of edges is obtained through the use of a combinatorial equation:
d(vi)
t−1
= d(vi)!
(t−1)!·(d(vi)−(t−1))!. Thus, aGeneric Cluster Coefficientis
defined in Equation 2 for a nodevi.
Ck(vi) = k
X
j=3
κj(vi)
d(vi)
j−1
(2)
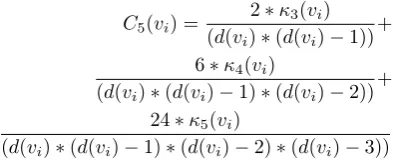
all cliques of size up tot becomes unfeasible. For the proposal of this paper the use of t = 5is enough and feasible. As a rule of thumb enough cliques occur when different topologies have different coefficient values. Equation 3 presents theGeneric Cluster Coefficientconsidering the cliques untilκ5. The Generic Cluster Coefficientremoves the social homogenization imposed by the traditional cluster coefficient.
C5(vi) =
2∗κ3(vi)
(d(vi)∗(d(vi)−1))
+ 6∗κ4(vi)
(d(vi)∗(d(vi)−1)∗(d(vi)−2))
+ 24∗κ5(vi)
(d(vi)∗(d(vi)−1)∗(d(vi)−2)∗(d(vi)−3))
(3)
in whichκ3(vi)is the number of triangles,κ4(vi)is the number of 4-sized cliques,κ5(vi)is the number of
5-sized cliques andd(vi)is the degree for nodevi.
4.1 Eigenvalue Influence Observation
One of the interesting observations is that the number of cliques which a node participates in has a high influ-ence on the eigenvalue of the graph. First, we need to define theeigenvalue dropto explain node influence. Theeigenvalue dropis defined as the original value of the first eigenvalue of a graph minus the first eigenvalue measured from the graph without the node whose influence we want to analyze. Theneigenvalue dropis given by the formulaλD=λ1−λ01, whereλDis theeigenvalue drop.
The eigenvalue experiment was carried out as follows: first, the first eigenvalue (λ1) of graphGwas mea-sured, then a nodeviwas removed from graphG, the first eigenvalue (λ01) was measured again and the
eigen-value dropλDi =λ1−λ10iwas computed. Nodeviwas put back and another nodevi+1was removed. Then
λ10
i+1andλDi+1were computed again. The process was repeated until all the chosen nodes had been deleted.
Theeigenvalue dropis usually related to node degree. Thus, by following this idea, two nodes with the same
degree should have the sameeigenvalue drop. However, as showed in Table II we can see that this is not true. Actually, nodes with different numbers of cliques (3, 4 and 5) influence theeigenvalue dropin different ways. Notice that for each row of Table II, the node analyzed and its edges were deleted and before the next node was deleted, the node and its edges had been reinserted.
Table II. Four nodes of AS network with the same degree (d(vi) = 7) andκ3= 7, hence the same cluster coefficient (=0.16), but different
influence on theeigenvalue drop.
κ4 κ5 eigenvalue drop C5(vi)
0 0 0.003445 0.16 2 0 0.003946 0.28 3 0 0.004391 0.33 4 1 0.004746 0.43
5. PROPOSED METHOD
This section presents the proposed algorithm, which not only counts the numbersκ4(vi)andκ5(vi)of a given
nodevi, but also lists them. Networks can be viewed as relationships on a database and many times are already
many join operations to retrieve these cliques and since most graphs are very large, it requires a long time to process a reasonably-sized graph. One of the techniques used to speed up queries is to store partial information used in these queries. Therefore, we proposeFCR - Fast Clique Retrieval, which breaks the graph into small subgraphs that allow retrievingκ4andκ5for each node in a faster way.
InFCR, the graph is first divided intonsmall subgraphs, wherenis the number of nodes, as presented in details in Algorithm 1 and in the following explanation: A subgraphGsi = (Vsi,Esi), i ∈ {1, . . . n}is the
induced subgraph centered at nodevi, such thatVsi = {u|u∈ V ∧(vi, u)∈ E}and contains all edges ofE
that connect nodes inVsi, which contains the neighborhood of a nodevi and each edge that connect these
nodes. Each edge ofEsi− N(vi) ={(u, w)∈ Esi∧(u, w)∈ N/ (vi)}is stored in an additional table, called
“Subgraph table”. Thus, the database needs only one extra table besides the edges file containing all edges ofG. For each edge stored in theSubgraph table, there exist the edge source and destination and an identification attributegraphi, which is indexiof subgraphGsi. There exist B-tree indexes in both tables
for all the attributes in order to take advantage of the optimization of RDBMS.
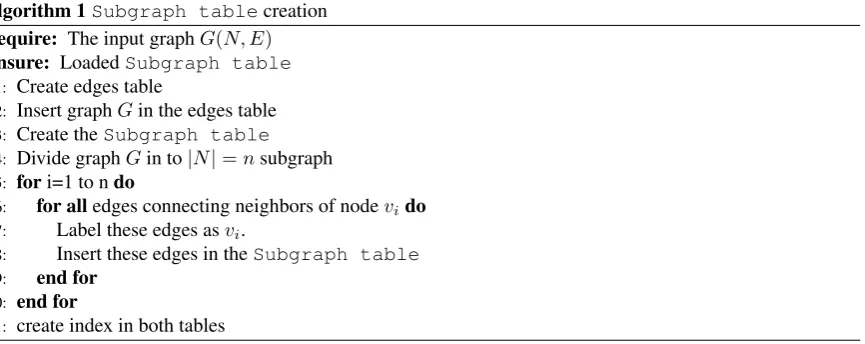
Algorithm 1Subgraph tablecreation Require: The input graphG(N, E) Ensure: LoadedSubgraph table
1: Create edges table
2: Insert graphGin the edges table
3: Create theSubgraph table
4: Divide graphGin to|N|=nsubgraph
5: fori=1 to ndo
6: for alledges connecting neighbors of nodevido
7: Label these edges asvi.
8: Insert these edges in theSubgraph table
9: end for
10: end for
11: create index in both tables
The Subgraph tablekeeps the edges of all the subgraphs, except the ones that neither have edges connecting their neighbors and nor one-degree nodes. Since most of the real graphs are sparse, i.e., they have many one-degree nodes, this approach does not need an unfeasible extra disk space.
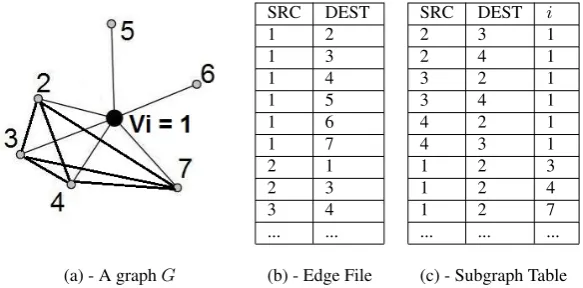
Figure 3 (a) shows an example of a graphG= (V,E)and the corresponding nodevi= 1as a black dot in the
graph. This graph will be used to explain how theFCRworks. The edge table ofG, in this paper exemplified by Figure 3 (a), is stored on the database as a relational table, with some tuples shown by Figure 3(b). Part of oneSubgraph tableis represented in Figure 3 (c), which shows some of the edges of subgraphsGsi in
Figure 3 (a). An example of the amount of tuples in theSubgraph tablecompared with the number of total edges of a graph and the amount of cliques (3, 4 and 5) will be presented in Section 6.
The idea to find allκ4of a nodeviis the following:
(1) Retrieve the node neighborhoodNvi;
(2) For each edge(vi, vj), retrieve all edges(vi, vj, z)in theSubgraph table
(3) Check if the two-by-two combination of indexzof all retrieved edges is inG.
Now, following the steps above to find theκ4(vi)of nodevi= 1from Figure 3 (a) we have:
(1) The neighborhood of nodevi,(1,2); (1,3); (1,4); (1,5); (1,6); (1,7), is retrieved.
(2) For each retrieved edge, check in theSubgraph tableif it belongs to any subgraph. For example, for edge(1,2), the following tuples are retrieved: (1,2,3); (1,2,4); (1,2,7). Edge(1,2)belongs toEsi of
SRC DEST SRC DEST i
1 2 2 3 1
1 3 2 4 1
1 4 3 2 1
1 5 3 4 1
1 6 4 2 1
1 7 4 3 1
2 1 1 2 3
2 3 1 2 4
3 4 1 2 7
... ... ... ... ...
(a) - A graphG (b) - Edge File (c) - Subgraph Table
Fig. 3. (a) a graphGand nodevi = 1, whose edges, represented by thick lines, are stored in theSubgraph table. Table (b) is the traditional edges table (the only one used in the Standard Approach). Table (c) is theSubgraph tablethat stored the edges from subgraphsGsi.
(3) Thus, there exists aκ4(vi)if there is an edge between the nodes retrieved, i.e., it is necessary to check if
edges(3,4); (3,7); (4,7)exists Each of them represents the existence of oneκ4(vi).
The SQL query to retrieve allκ4from Epinions network is presented in Figures 4 and 5. First, the SQL for the standard approach, which requires 11 joins to retrieve allκ4, is presented.
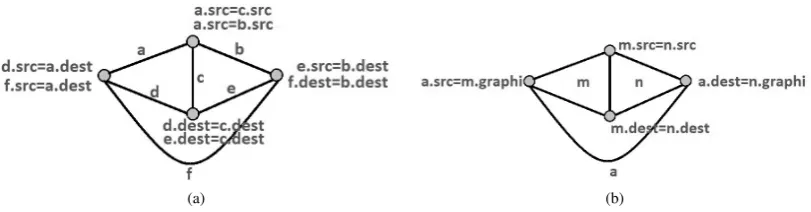
Cliqueκ4 is composed of 6 edges(a, b, c, d, e, f)that correspond to each table in the query presented in Figure 4. The join operation in SQL query corresponds to the graph nodes that composeκ4. The intuition of the SQL query is represented by the graph in Figure 6.
SELECT a.src, a.dest, b.dest, c.dest
FROM epinions a, epinions b, epinions c, epinions d, epinions e, epinions f
WHERE and a.src = b.src and a.src = c.src and d.src = a.dest and d.dest = c.dest and e.src = b.dest and e.dest = c.dest and f.src = a.dest and f.dest = b.dest and a.dest <> b.dest and a.dest <> c.dest and b.dest <> c.dest;
Fig. 4. SQL query to retrieve allκ4from Epinions network using the standard approach
By using theSubgraph table, only 4 join operations are needed, as represented by the query in Figure 5. This query is simpler and more efficient than the one in Figure 4. The improvement is obtained by avoiding the verification of an edge existence more than once.
SELECT a.src, a.dest, m.src, m.dest
FROM epinions a, epinionssubgraph m, epinionssubgraph n WHERE a.src = m.grafhi and a.dest = n.grafhi and m.src = n.src
and m.dest = n.dest;
Fig. 5. SQL query to retrieve allκ4from Epinions network by using theSubgraph table
To find allκ5of a nodevi, one can follow the steps below:
(1) Retrieve the node neighborhoodNvi;
(2) For each edge(vi, vj)retrieve all edges(vi, vj, z)in theSubgraph table;
(a) (b)
Fig. 6. Graph representing the following SQL queries: (a) Figure 4 - (b) Figure 5
Now, instancing the steps above to find theκ5(vi)of nodevi= 1from Figure 3 (a) we have:
(1) The neighborhood of nodevi,(1,2; 1,3; 1,4; 1,5; 1,6; 1,7)is retrieved.
(2) For each retrieved edge, check in theSubgraph tableif it belongs to any subgraph. For instance, for edge(1,2)the following tuples are retrieved:(1,2,3; 1,2,4; 1,2,7). Edge(1,2)belongs toEsiof node 3,
4 and 7.
(3) Thus, there exists aκ5(vi)if there are edges among the nodes retrieved, i.e., it is necessary to check if
tuple(3,4,7)is in theSubgraph table.
Actually, using the Subgraph table it is necessary to verify if tuple (z1, z2, z3) in in Subgraph table, instead of checking if there are three tuples ((z1, z2),(z1, z3)and(z2, z3)) in the edges table.
The SQL query to retrieve allκ5from Epinions network is presented in Figure 7 and Figure 8. First, the standard approach, which requires 21 join operations. Second, theFCRapproach, which requires only 7 join operation, reducing the computational cost.
SELECT a.src, a.dest, b.dest, c.dest, d.dest
FROM epinions a, epinions b, epinions c, epinions d, epinions e, epinions f, epinions g, epinions h, epinions i, epinions j WHERE a.src = b.src and a.src = c.src and a.src = d.src
and a.dest = e.src and a.dest = g.src and a.dest = i.src and b.dest = e.dest and b.dest = h.src and b.dest = j.src and c.dest = g.dest and c.dest = j.dest and c.dest = f.src and d.dest = f.dest and d.dest = h.dest and d.dest = i.dest and c.dest <> d.dest and a.dest <> b.dest and a.dest <> c.dest and a.dest <> d.dest and b.dest <> c.dest and b.dest <> d.dest;
Fig. 7. SQL query to retrieve allκ5from Epinions network by using the standard approach
SELECT z.src, z.dest, z.grafoi, a.src, a.dest FROM epinionssubgraph z, epinionssubgraph a,
epinionssubgraph b, epinionssubgraph c
WHERE z.src = a.grafoi and z.dest = b.grafoi and z.grafoi = c.grafoi and a.src = b.src and a.src = c.src
and a.dest = b.dest and a.dest = c.dest;
Fig. 8. SQL query to retrieve allκ5from Epinions network by using theSubgraph table
6. SCALABILITY
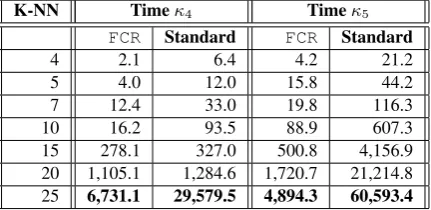
This section shows that theFCR - Fast Clique Retrievalis up to 5 and 12 times faster than the Standard approach to query allκ4 andκ5, respectively. The evaluation was performed by using the open source RDBMS PostgreSQL 8.3.7 on a computer equipped with an Intel Core2 Quad 2.83GHZ processor and 4Gb of RAM. Table IV and Figure 9 present the results of the experiments to evaluate how fastFCRis to query allκ4andκ5. The time was measured in seconds and the values shown are the average of three executions, with the cache being cleaned before each execution. To control the experiment, we used a graph based on US cities, that is, a graph composed of a set of latitudes and longitudes of 25,375 US cities. The graphs used to evaluate the scalability were created based on a US cities dataset by using ak-nearest neighbor query for each node, varyingk∈ {4,5,7,10,15,20,25}. Thus, every graph has the same number of nodes, but a varied number of edges, as described in Table III, which also reports the number of edges stored in theSubgraph table. All graphs are considered undirected. The highest speed is reached whenk= 25, that is, querying all theκ4by usingFCRis 4 times faster and querying all theκ5usingFCRis 12 times faster than by using the standard approach.
Table III. US Cities dataset information (nodes, edges and edges inSubgraph table). Dataset Information
K-NN Edges Subgraph table κ4 κ5
4 62,401 250,044 241,584 21,744 5 77,104 418,332 640,440 121,896 7 106,283 882,324 2,391,816 946,560 10 149,760 1,889,838 8,571,576 6,305,136 15 222,348 4,411,422 33,506,928 43,521,504 20 295,239 8,001,498 85,459,368 160,675,416 25 368,308 12,690,354 175,523,400 436,345,200
Table IV. Average execution time (in seconds) to countκ4andκ5for each node using bothFCRand the Standard approach with the US
Cities dataset.
K-NN Timeκ4 Timeκ5
FCR Standard FCR Standard
4 2.1 6.4 4.2 21.2
5 4.0 12.0 15.8 44.2
7 12.4 33.0 19.8 116.3
10 16.2 93.5 88.9 607.3 15 278.1 327.0 500.8 4,156.9 20 1,105.1 1,284.6 1,720.7 21,214.8 25 6,731.1 29,579.5 4,894.3 60,593.4
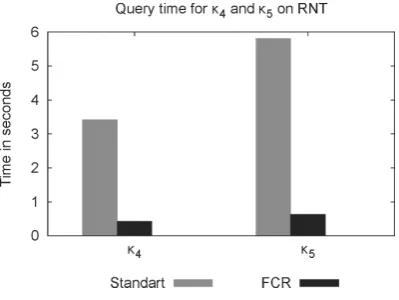
The second scalability experiment executed a query for a thousand nodes from RNT (our largest real graph in number of nodes and edges) which were randomly chosen. Figure 9 presents the average time per query of both theFCRand the standard approach. Before each query, the cache of the computer and the database were cleaned up. As we can see, theFCRapproach is up to 8 times faster forκ4 and 9 times faster forκ5, when compared to the standard approach, which uses only the edges table stored in the RDBMS. As shown in our experiments, theFCRis a feasible approach to retrieveκ4andκ5.
7. PATTERNS AND OBSERVATIONS
Fig. 9. Average time over thousand queries on RNT graph.
The first is theClique-Degree, which shows that cliques κ4 andκ5 as κ3 also exhibit a correlation with the node degree distribution. The second is thePower Clique, which presents the correlation among cliques, for exampleκ4vs. κ3and so on. The last one is theClique Distribution, which shows that the amount of cliquesκ3,κ4andκ5follows a power law very close to the node degree distribution power law.
7.1 Dataset description
TheFCR approach was tested with several network datasets, however, only the results of four datasets are presented, as the other have similar behavior. All datasets are undirected and do not contain self-edges. Figure 10 presents the node degree distribution of the evaluated datasets detailed below:
—AS-Network: The Internet can be organized into subgraphs called Autonomous Systems (AS). Each AS exchanges traffic flows with its neighbors (peers). A communication network of who-talks-to-whom from the BGP (Border Gateway Protocol) and its logs can be used to build a graph. We used the AS-Network dataset from Caida [asc 2007]. It has 26,389 nodes and 52,861 edges.
—Email-Enron network: It is a social network that contains data from users of Enron company [Klimt and Yang 2004].It has 33,696 nodes and 180,811 edges.
—Epinions Network: It is a real social network of who-trusts-whom from Epinions [Richardson et al. 2003], where nodes represent people and edges represent relationships. It has 75,877 nodes and 405,739 edges. —Recommendation (RNT): The RNT [Clauset et al. 2004] represents information about purchases in a store,
where the nodes represent items and there is an edge from itemv to another item uif uis frequently purchased by buyers of itemv. It has 473,315 nodes and 3,505,519 edges.
Degree Distribution
(a) AS (b) Email-Enron (c) Epinions (d) RNT
7.2 Cliques Power Laws
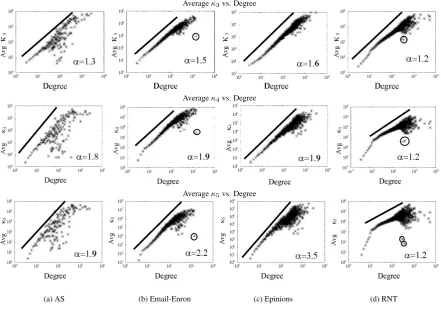
Figure 11 presents the averageκt(κt) fort∈ {3,4,5}versus node degree (d). All the plots of Figure 11 exhibit
a correlation between degree and clique distribution, that is, all cliques, includingκ3presented in [Tsourakakis 2008], follow a power law. Thus, it is possible to generalize the power law as being theDegree Clique Law.
Degree-Clique Law. The relation between the average number of t-sized cliques vs. degreedof a network that follows a power law with exponentα >0.
κt=dα (4)
whereκtis the average number of t-sized cliques,dis the node degree and the power law exponent isα >0.
Averageκ3vs. Degree
Averageκ4vs. Degree
Averageκ5vs. Degree
(a) AS (b) Email-Enron (c) Epinions (d) RNT
Fig. 11. Average ofκt(vi)(t∈3,4,5) vs Degree for Epinions and Recommendation Network.
Astincreases, more nodes tend to deviate from the tendency shown in Figure 11. In most networks high-degree nodes have many one-high-degree nodes connected to them, which decreases the probability of a node par-ticipation in a clique. However, they still participating in many more cliques than in nodes with an inferior degree.
Figure 11 also shows that in these networks (columns (b), (c) and (d)) most of the nodes start deviating around degree 100, which is the best size for a community structure. Actually, communities tend to achieve the well-functioning size around 100 nodes. In the RNT dataset, given that it is a recommendation network, the deviation of high-degree nodes can be explained by the fact that it is rare to buy a large number of products together. Thus, it is improbable for high-degree node to have a large number of cliques.
A surprising observation occurs with the RNT dataset, Figure 11 (d), which seems to follow two different tendencies: one up to degree 10 and the other above degree 10, which is exactly the same point where the RNT degree distribution shown in Figure 10 has a “bend” in its tendency.
It is interesting to observe that the results of the Email-Enron network are almost identical to the Epinions graph, not onlyκtversus node degree (shown in Figure 11 (b) and (c)) but also the degree distribution (Figure
12 (b) and (c)). Thus, Email-Enron and Epinions have the same behavior, what is explained by the fact that both are social networks. Moreover, in Email-Enron there is one highlighted point, corresponding to the highest degree node in Figure 11 (b) that significantly deviates from all the other nodes in the plots. This node has a spammer behavior, since it has fewer cliques than the second highest degree nodes.
Table V. Theκ3(G),κ4(G)andκ5(G)all networks. Network κ3(G) κ4(G) κ5(G)
AS-network 205,590 1,184,544 9,169,320 Email Enron 4,345,594 56,177,760 697,083,240 Epinions 9,746,886 139,281,528 2,090,091,840 RNT 39,772,974 204,902,448 973,945,920
Table V presents the total numbers ofκ3,κ4andκ5for all four networks. As one can observe, the RNT has the largest number ofκ3andκ4. However, Epinions has many moreκ5 and fewer edges and nodes than the RNT, which means that it is more clustered than the RNT.
Figure 12 depicts the correlation ofκt+1versusκtwitht= 3,4,5. These relations show, for instance, how
manyκ4 are on average κ5. One can observe that all plots follow power laws, i.e., the triangles of a node tend to be connected to other triangles becoming larger cliques, such asκ4 andκ5. The higher number of κ4(vi)andκ5(vi)proves that the networks are very well connected exhibiting a network community structure.
Epinions and Email-Enron networks, which are social networks are the ones that have fewer nodes deviating from the tendency. This fact was expected, since people in social networks usually take part in large social groups, like schools, sports and so forth. On the other hand, the RTN has fewerκ4 andκ5 than Epinions. This is also expected, since it is a recommendation network and most of the people buy fewer products at the same time. A surprising observation is related to the AS network, as most of the nodes that deviate from the tendency (highlighted nodes in Figure 12 column (a)) are not the high-degree nodes. This is explained by the AS topology, given that the high-degree nodes are connected and form a core and the other layers have average-degree nodes. Thus, the nodes on the AS network that deviate from the pattern are probably from the second and the third layers.
Power Clique Law. A given number of t-sized cliques usually becomes a number of j-sized cliques with j > tfollowing a power law withα >0.
κj=κtα (5)
whereκjis the average of j-sized cliques andκtis the number of t-sized cliques witht < j.
κ4vs.κ3
κ5vs.κ3
κ5vs.κ4
(a) AS (b) Email-Enron (c) Epinions (d) RNT
Fig. 12. Average number ofκ4vs.κ3, Average number ofκ5vs.κ3and Average number ofκ5vs.κ4of Epinions and Recommendation
Network
Clique Distribution Law. The distribution of cliquesκtin a graph follows a power law withα >0.
P(κt) =κt−α (6)
The number of possibleκ3(vi),κ4(vi)andκ5(vi)that a node might have is larger than the real number of
κ3,κ4 andκ5 that a node really has. Thus, a real network still has many triangles that do not become large cliques, i.e., although networks are very well connected, they are far from being only one large clique.
8. CONCLUSIONS
This paper highlighted the importance of studying cliques of a larger size than the triangles (cliques of size three). The main contributions of the paper are the following:
—The design of a cluster coefficient extension, calledGeneric Cluster Coefficient, which allows the identification of nodes that have distinct connectivity strength and can not have their topologies distin-guished only by the number of triangles, which is important for community analyses and abnormalities.
—TheDegree Clique Law, which shows the correlation of a node degree distribution with κ3, κ4 andκ5
distributions. Different types of networks have a different node degree, which deviates from theκ3,κ4and κ5distributions.
—ThePower Clique Law, which is the power law distribution of a clique of a given size vs. cliques of smaller
sizes.
—TheClique Distribution Law, which shows that clique distribution follows a power law similar to the degree
κ3Distribution
κ4Distribution
κ5Distribution
(a) AS (b) Email-Enron (c) Epinions (d) RNT
Fig. 13.κtdistribution witht= 3,4,5for (a) Epinions and (b) RTN networks. The clique distribution follows a power law very similar to the degree distribution with the same bend.
—The proposal of a new efficient approach calledFCR - Fast Clique Retrieval, which allows list-ing and countlist-ing the number ofκ4 andκ5in a faster way by using an RDBMS. Queries to countκ4 and κ5are executed, respectively, up to 5 and 12 times faster than the standard approach, by using only an extra table.
As future works, we suggest the analyses ofκ4 andκ5 extended to other network models and how they evolve over time in real networks.
REFERENCES
The caida as relationships dataset (11/12/2007). http://www.caida.org/data/active/as-relationships/, 2007. dataset.
ALBERT, R., JEONG, H.,ANDBARABASI´ , A.-L. Error and attack tolerance of complex networks.Naturevol. 406, pp. 378–381, 2000. BECCHETTI, L., BOLDI, P., CASTILLO, C.,ANDGIONIS, A. Efficient semi-streaming algorithms for local triangle counting in massive
graphs. InProceedings of the ACM SIGKDD international conference on Knowledge discovery and data mining. Las Vegas, Nevada, USA, pp. 16–24, 2008.
CALDARELLI, G., SATORRAS, P. R.,ANDVESPIGNANI, A. Structure of cycles and local ordering in complex networks.The European Physical Journal B - Condensed Matter38 (2): 183–186, March, 2004.
CHAKRABARTI, D.ANDFALOUTSOS, C. Graph mining: Laws, generators, and algorithms.ACM Computing Surveys38 (1): 2, 2006. CHAKRABARTI, D., WANG, Y., WANG, C., LESKOVEC, J.,ANDFALOUTSOS, C. Epidemic thresholds in real networks.ACM
Transac-tions on Information and System Security10 (4): 1–26, 2008.
CHAKRAVARTHY, S., BEERA, R.,ANDBALACHANDRAN, R. Db-subdue: Database approach to graph mining. InProceedings of the Pacific-Asia Conference Advances in Knowledge Discovery and Data Mining, H. Dai, R. Srikant, and C. Zhang (Eds.). Lecture Notes in Computer Science, vol. 3056. Sydney, Australia, pp. 341–350, 2004.
CLAUSET, A., NEWMAN, M. E. J.,ANDMOORE, C. Finding community structure in very large networks.Physical Review Evol. 70, pp. 066111, 2004.
CLAUSET, A., SHALIZI, C. R.,ANDNEWMAN, M. E. Power-law distributions in empirical data.SIAM Review51 (4): 661–703, 2009. DOROGOVTSEV, S. N., GOLTSEV, A. V.,ANDMENDES, J. F. F. Pseudofractal scale-free web.Physical Review Evol. 65, pp. 066122,
2002.
DU, N., FALOUTSOS, C., WANG, B.,ANDAKOGLU, L. Large human communication networks: patterns and a utility-driven generator. InProceedings of the International Conference on Knowledge Discovery and Data Mining. Paris, France, pp. 269–278, 2009. DUNBAR, R.Grooming, Gossip, and the Evolution of Language. Harvard University Press, 1998.
FALOUTSOS, M., FALOUTSOS, P.,ANDFALOUTSOS, C. On power-law relationships of the internet topology. InProceedings of the Conference on Applications, technologies, architectures, and protocols for computer communication. Cambridge, Massachusetts, USA, pp. 251–262, 1999.
FRONCZAK, A., HOLYST, J. A., JEDYNAK, M.,ANDSIENKIEWICZ, J. Higher order clustering coefficients in barabasi-albert networks. Physica A316 (1): 688–694, December, 2002.
HAN, J., CHENG, H., XIN, D.,ANDYAN, X. Frequent pattern mining: current status and future directions.Data Mining and Knowledge Discovery15 (1): 55–86, 2007.
KLIMT, B.ANDYANG, Y. Introducing the enron corpus. InProceedings of the Conference on Email and Anti-Spam. Vol. 1. Mountain View, USA, pp. 1–2, 2004.
LATAPY, M. Main-memory triangle computations for very large (sparse (power-law)) graphs. Theoretical Computer Science407 (1-3): 458–473, 2008.
LESKOVEC, J., KLEINBERG, J.,ANDFALOUTSOS, C. Graph evolution: Densification and shrinking diameters. ACM Transactions on Knowledge Discovery from Data1 (1): 2, 2007.
LESKOVEC, J., LANG, K. J., DASGUPTA, A.,ANDMAHONEY, M. W. Community structure in large networks: Natural cluster sizes and the absence of large well-defined clusters.CoRRvol. abs/0810.1355, pp. 1–66, 2008.
LIU, G.ANDWONG, L. Effective pruning techniques for mining quasi-cliques. InProceedings of the European conference on Machine Learning and Knowledge Discovery in Databases. Antwerp, Belgium, pp. 33–49, 2008.
MIHAIL, M.ANDPAPADIMITRIOU, C. H. On the eigenvalue power law. InProceedings of the International Workshop on Randomization and Approximation Techniques. London, UK, pp. 254–262, 2002.
MODANI, N.ANDDEY, K. Large maximal cliques enumeration in sparse graphs. InProceedings of the ACM conference on Information and knowledge management. Napa Valley, California, USA, pp. 1377–1378, 2008.
NEWMAN, M. E. J. The structure and function of complex networks.SIAM Reviewvol. 45, pp. 167–256, 2003. NEWMAN, M. E. J. Power laws, pareto distributions and zipf’s law.Contemporary Physicsvol. 46, pp. 323, 2005.
PAGE, L., BRIN, S., MOTWANI, R.,ANDWINOGRAD, T. The pagerank citation ranking: Bringing order to the web. InProceedings of the International World Wide Web Conference. Brisbane, Australia, pp. 161–172, 1998.
PAVLO, A., PAULSON, E., RASIN, A., ABADI, D. J., DEWITT, D. J., MADDEN, S.,ANDSTONEBRAKER, M. A comparison of approaches to large-scale data analysis. InProceedings of the SIGMOD international conference on Management of data. Providence, Rhode Island, USA, pp. 165–178, 2009.
RAVASZ, E.ANDBARABSI, A.-L. Hierarchical organization in complex networks.Physical Review E67 (2): 026112, Feb, 2003. RICHARDSON, M., AGRAWAL, R.,ANDDOMINGOS, P. Trust management for the semantic web. In Proceedings of the International
Semantic Web Conference.Lecture Notes in Computer Sciencevol. 2870, pp. 351–368, January, 2003.
RUSTIN, R., editor. Proceedings of the ACM-SIGMOD Workshop on Data Description, Access and Control, Ann Arbor, Michigan, May 1-3, 1974, 2 Volumes. ACM, 1974.
STIX, V. Finding all maximal cliques in dynamic graphs.Computational Optimization and Applications27 (2): 173–186, 2004. TAURO, S. L., PALMER, C., SIGANOS, G.,ANDFALOUTSOS, M. A simple conceptual model for the internet topology. InProceedings
of the Global Telecommunications Conference. Vol. 3. San Antonio, TX, USA, pp. 1667 –1671, 2001.
TSOURAKAKIS, C. E. Fast counting of triangles in large real networks without counting: Algorithms and laws. InProceedings of the IEEE International Conference on Data Mining. Washington, DC, USA, pp. 608–617, 2008.
WANG, W., WANG, C., ZHU, Y., SHI, B., PEI, J., YAN, X.,ANDHAN, J. Graphminer: a structural pattern-mining system for large disk-based graph databases and its applications. InProceedings of the International Conference on Management of Data. Baltimore, Maryland, USA, pp. 879–881, 2005.
WATTS, D. J.ANDSTROGATZ, S. H. Collective dynamics of ‘small-world’ networks.Nature393 (6684): 440–442, June, 1998. ZENG, Z., WANG, J., ZHOU, L.,ANDKARYPIS, G. Out-of-core coherent closed quasi-clique mining from large dense graph databases.