Can live weight be used as a proxy
for enteric methane emissions from
pasture-fed sheep?
J. M. Moorby, H. R. Fleming, V. J. Theobald & M. D. Fraser
To test the hypothesis that sheep live weight (LW) could be used to improve enteric methane (CH4)
emission calculations, mature ewes of 4 different breeds representative of the UK sheep industry were studied: Welsh Mountain, Scottish Blackface, Welsh Mule and Texel (n = 8 per breed). The ewes were housed and offered ad libitum access to fresh cut pasture of three different types, varying in digestibility: (a) a relatively high digestibility monoculture of perennial ryegrass (Lolium perenne), (b) a medium digestibility permanent pasture comprising a range of grass species, and (c) a relatively low digestibility native grassland pasture comprising mainly Molinia caerulea. Individual LW, feed dry matter intake (DMI), and CH4 emissions in chambers were measured. The linear functional relationship
between DMI and CH4 emissions was positive (r= 0.77) with little breed effect. The relationships
between LW and DMI, and LW and CH4 emissions were also positive but weaker, regardless of pasture
type. It is concluded that change to LW was a poor indicator of DMI and has limited value in the prediction of enteric CH4 emissions from mature ewes.
The agricultural livestock industry is tasked with reducing its contribution to global environmental problems1.
In terms of greenhouse gas (GHG) emissions, it accounts for 37% of anthropogenic methane (CH4), with most of
this arising from enteric fermentation by ruminants. At the same time rising demand for meat and dairy products means livestock numbers are increasing across the globe2. In 2013 the global sheep population was 1,162 million
head, an increase of 4% since 20093, and sheep numbers have been forecast to increase 60% by 20502. Equivalent
global estimates of annual enteric CH4 emissions from sheep computed at Tier 1 following the Intergovernmental
Panel on Climate Change (IPCC) 2006 Guidelines for National Greenhouse Gas [GHG] Inventories4 were 6,305
kilotonnes, or 132,409 kilotonnes CO2e3. Tier 1 is the most simplified approach to accounting that relies on default
emission factors (EFs)4, and takes no account of variables such as diet type, feed intake, animal breed and body
size. Furthermore, the range of supporting studies with relevant data to develop the 2006 default Tier 1 EFs for sheep was comparatively limited, and many of the observational data that these have been based upon have been collected from breeds or forages unrepresentative of pastures grazed within the UK and Northern Europe5–8.
Improved inventories can be achieved by the use of Tier 2 methodologies, which employ locally-derived EFs relevant to country-specific production systems, and allow for greater accuracy and precision in CH4 emission
estimates. Improving the precision of emission data reporting is essential if key factors influencing the emission rates from alternative livestock production systems are to be identified and the effectiveness of associated mitiga-tion strategies quantified.
Selection following domestication has led to sheep being adapted to thrive in diverse conditions. Smaller, hardier sheep breeds tend to be found in marginal (typically hill or mountain) areas, and it is possible that physiological or behavioural differences9,10 may result in these animals utilising low-quality native pasture more efficiently than
lowland breeds. In contrast, larger, more productive modern (typically lowland) breeds and cross-breeds should theoretically partition relatively more feed nutrients towards productive purposes. It is well known that CH4
emissions tend to increase as feed dry matter intake (DMI) increases (e.g.5,11–13), i.e. the more a ruminant animal
eats, the more CH4 is produced. Feed intake in sheep is related to some extent to body size14,15, and therefore larger
sheep may be expected to eat more and therefore produce more CH416. In this study the relationship between body
size and CH4 emissions was defined, with mature ewes of differing modern sheep breeds being offered herbage
cut from low, medium and high digestibility grass-dominated swards. It tested the hypothesis that body mass and associated allometric relationships determine enteric CH4 production at the individual sheep level, regardless of
Institute of Biological, Environmental and Rural Sciences, Gogerddan, Aberystwyth SY23 3EE, UK. Correspondence and requests for materials should be addressed to J.M.M. (email: [email protected]).
breed type. If such a relationship existed it could be used to refine future EFs for sheep for Tier 2 inventory reporting mechanisms in the UK and other temperate countries with pasture-based sheep production systems.
Results
Feeds offered.
Thirty-two mature barren (i.e. not pregnant or lactating) ewes of 4 different breeds (Welsh Mountain, Scottish Blackface, Welsh Mule (Welsh Mountain × Border Leicester) and Texel; n = 8 per breed) were each offered 3 contrasting pasture-only diets (a perennial ryegrass monoculture; a grass-species-dominated per-manent pasture; and a Molinia caerulea-dominated native pasture, hereafter referred to as Molinia). The ryegrass, permanent pasture and Molinia forages fed during the experiment were characterised as having high, medium and low organic matter digestibility (DOMD) in the feed dry matter (DM) respectively, with the Molinia having a substantially higher fibre concentrations that the other two sward types (Table 1). Conversely the ryegrass pasture was characterised by much higher concentrations of water soluble carbohydrates (WSC) than the permanent pasture and Molinia.Role of breed type in influencing voluntary intake and
in vivo
digestibility.
The live weight (LW) of the ewes ranged from about 40 kg to over 70 kg (Table 2). Intakes were relatively high when offered ryegrass, at over 1 kg DM d−1 for all breed types (Table 2). On this forage type a breed effect of DMI remained once theresults were expressed on a metabolic LW (MLW) basis, with the intakes recorded for the Welsh Mountain and Scottish Blackface ewes being the highest and lowest respectively. However, apparent DM digestibility was higher for the forage consumed by the Scottish Blackface ewes, and consequently digestible DMI (DDMI) was similar for all breed types when expressed on a MLW basis. Voluntary intakes on the permanent pasture and Molinia were somewhat lower than they had been on the ryegrass (Table 2). A breed effect on DM digestibility was again recorded when the ewes were offered permanent pasture, with once more the highest value being recorded for the Scottish Blackface ewes. However, there was no effect on DMI or DDMI when expressed on a metabolic LW basis. When offered Molinia there was no effect of breed type on DM digestibility, DMI or DDMI when the results were expressed on a MLW basis.
Role of breed type in influencing CH
4emissions.
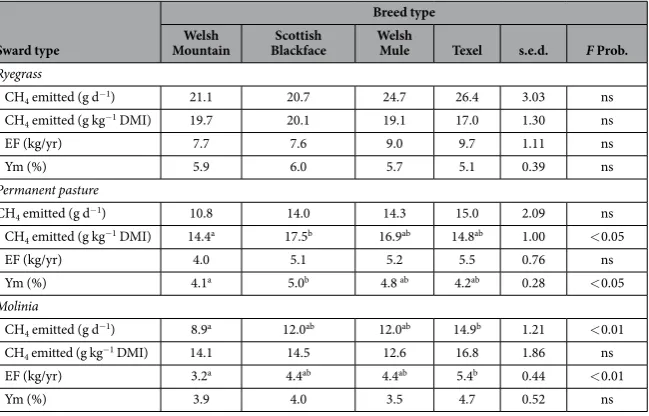
There was no effect of breed type on the quantity of CH4 emitted when the ewes were offered ryegrass (Table 3), but a breed effect was seen on the amount of CH4emitted per kilo DMI when offered the permanent pasture. Only on Molinia was there a breed effect on grams of CH4 emitted per head per day. When the results were expressed as CH4-energy/feed gross energy intake (Ym) a
breed effect was recorded only when the ewes were offered the permanent pasture.
Effect of LW on feed intake and CH
4emissions.
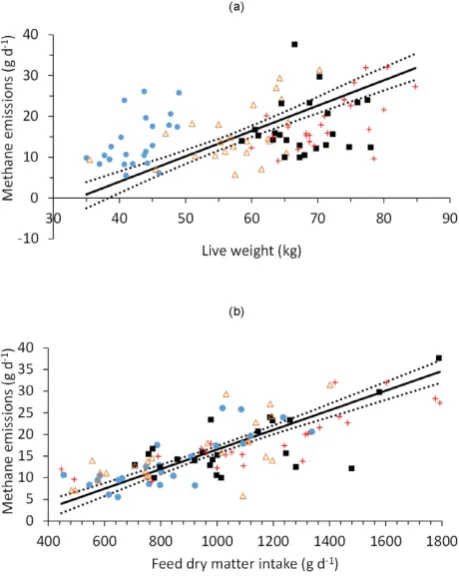
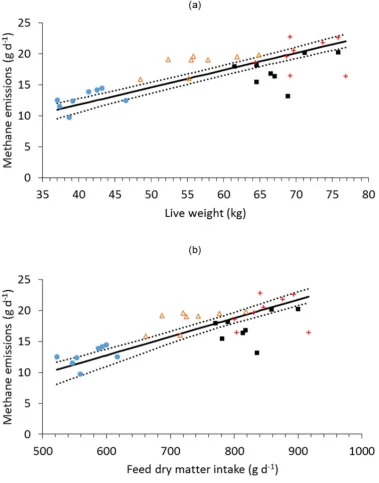
The overall relationship between LW and ad libitum DMI was positive but relatively poor (r= 0.52). There was no significant difference in the slopes of this relation-ship between the different sheep breeds, although there were significant differences in the elevation of the slopes (P< 0.001) and the locations of the groups (P< 0.001) within the complete dataset. The linear functional relation-ships between LW and CH4 emissions had positive slopes for all sheep breeds (Table 4), but were poorly correlated,particularly for the Welsh Mule ewes (Fig. 1a). There were also poor, but significant, positive correlations between measurements of LW and CH4 emissions on each of the three pasture types (Fig. 2), with stronger correlations
between DMI and CH4 emissions (Table 5), particularly for the ryegrass and permanent pasture diets. The overall
linear functional relationship between DMI and CH4 emissions was moderate (constant = − 6.1 [s.e. = 1.52],
slope = 0.022 [s.e. = 0.0015]; r= 0.77, P< 0.001; Fig. 1b), and there was no significant difference between breed groups in the slopes of the relationships or in the elevation of the regression lines, but there was a significant (P< 0.01) difference in the location of the groups.
Effect of LW on CH
4emissions when fed to maintenance requirements.
The follow-up experiment investigated the effect of LW on CH4 emissions when ewes of the same breeds were fed at energy maintenance.In order to standardise intake levels, and remove between-animal variation in CH4 emissions resulting to
differ-ences in ad libitum DMI, the ewes were offered dried grass pellets at feeding levels formulated to meet predicted maintenance requirements17. The mean chemical composition of the grass pellets fed is presented in Table 1. Mean
LW ranged from 41 kg for the Welsh Mountain ewes to 70 kg for the Texel ewes. When expressed on a MLW basis the DMI for all breeds was 35 g d−1 (s.e.d. = 0.2 g d−1; ns). Apparent DM digestibility was similar for all breeds
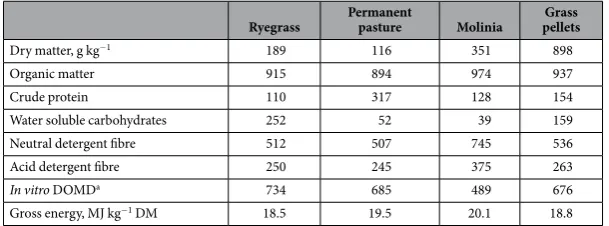
Ryegrass Permanent pasture Molinia pelletsGrass
Dry matter, g kg−1 189 116 351 898
Organic matter 915 894 974 937
Crude protein 110 317 128 154
Water soluble carbohydrates 252 52 39 159
Neutral detergent fibre 512 507 745 536
Acid detergent fibre 250 245 375 263
In vitro DOMDa 734 685 489 676
Gross energy, MJ kg−1 DM 18.5 19.5 20.1 18.8
Table 1. Mean chemical composition of the feeds offered (n = 8 per feed). Values are shown in g kg−1 DM
Sward type
Breed type Welsh
Mountain BlackfaceScottish Welsh Mule Texel s.e.d. F Prob.
Ryegrass
LW (kg) 45.8a 61.5b 70.9c 77.6d 2.29 < 0.001
DMI (kg d−1) 1.08a 1.02a 1.30ab 1.55b 0.102 < 0.001
DMI (g kg−1 MLW per day) 62b 47a 53ab 60b 4.7 < 0.05
DMD (g g-1) 0.816a 0.857b 0.806a 0.812a 0.0137 < 0.01
DDMI (g kg−1 MLW per day) 51 40 43 48 3.9 ns
Permanent pasture
LW (kg) 41.3a 57.9b 63.9bc 67.6c 2.65 < 0.001
DMI (kg d−1) 0.76 0.77 0.86 1.03 0.109 ns
DMI (g kg−1 MLW per day) 45 35 37 44 5.0 ns
DMD (g g-1) 0.794bc 0.803c 0.763ab 0.755a 0.0134 < 0.01
DDMI (g kg−1 MLW per day) 37 29 29 33 3.7 ns
Molinia
LW (kg) 40a 53b 69c 69c 2.4 < 0.001
DMI (kg d−1) 0.66a 0.89ab 1.03b 0.95b 0.084 < 0.01
DMI (g kg−1 MLW per day) 41 45 43 40 3.8 ns
DMD (g g-1) 0.577 0.571 0.510 0.504 0.0342 ns
DDMI (g kg−1 MLW per day) 24 26 23 21 2.6 ns
Table 2. Voluntary intake and apparent DM digestibility relative to live weight for different breed types of
sheep when zero-grazed on pastures of high (ryegrass), medium (permanent pasture) and low (Molinia) nutritional value. LW = live weight; DMI = dry matter intake; MLW = metabolic LW; DMD = dry matter digestibility; and DDMI = digestible DMI. Values in rows with different letter superscripts differed significantly (P< 0.05).
Sward type
Breed type Welsh
Mountain BlackfaceScottish Welsh Mule Texel s.e.d. F Prob.
Ryegrass
CH4 emitted (g d−1) 21.1 20.7 24.7 26.4 3.03 ns
CH4 emitted (g kg−1 DMI) 19.7 20.1 19.1 17.0 1.30 ns
EF (kg/yr) 7.7 7.6 9.0 9.7 1.11 ns
Ym (%) 5.9 6.0 5.7 5.1 0.39 ns
Permanent pasture
CH4 emitted (g d−1) 10.8 14.0 14.3 15.0 2.09 ns
CH4 emitted (g kg−1 DMI) 14.4a 17.5b 16.9ab 14.8ab 1.00 < 0.05
EF (kg/yr) 4.0 5.1 5.2 5.5 0.76 ns
Ym (%) 4.1a 5.0b 4.8 ab 4.2ab 0.28 < 0.05
Molinia
CH4 emitted (g d−1) 8.9a 12.0ab 12.0ab 14.9b 1.21 < 0.01 CH
4 emitted (g kg−1 DMI) 14.1 14.5 12.6 16.8 1.86 ns
EF (kg/yr) 3.2a 4.4ab 4.4ab 5.4b 0.44 < 0.01
Ym (%) 3.9 4.0 3.5 4.7 0.52 ns
Table 3. Mean methane (CH4) yields by different breed types of sheep when zero-grazed on pastures of
relatively high (ryegrass), medium (permanent pasture) and low (Molinia) nutritional value. DMI = dry
(0.711 g g-1 DM; s.e.d. = 0.0207 g g-1 DM; ns), and there was no difference in DDMI on a MLW basis (25 g d−1;
s.e.d. = 0.7 g d−1; ns).
There was a significant breed type effect on CH4 emitted per day (12.6, 18.5, 17.3 and 19.8 g d−1 for Welsh
Mountain, Scottish Blackface, Welsh Mule and Texel respectively; s.e.d. 1.09 g d−1; P< 0.001), with those from the
Welsh Mountain ewes being significantly (P< 0.05) lower than those from the other breeds. A significant breed type effect was also found when emissions where expressed on a DMI basis (22.1, 25.3, 21.1, 23.4 g kg−1 DM for
Welsh Mountain, Scottish Blackface, Welsh Mule and Texel respectively; s.e.d. 1.32 g kg−1 DM; P< 0.05), with
Group Constant (g CH4 d−1) Slope (kg−1) R2 Fresh forages
Sheep breed
Welsh Mountain − 48.2 (8.13) 1.45 (0.194) 0.25 Scottish Blackface − 38.1 (12.90) 0.93 (0.215) 0.28 Welsh Mule − 55.5 (61.14) 1.07 (0.901) 0.02
Texel − 53.9 (14.36) 1.02 (0.203) 0.38
All data (no grouping) − 20.8 (3.20) 0.62 (0.053) 0.19
Dried grass pellets
Sheep breed
Welsh Mountain − 9.6 (12.60) 0.55 (0.313) 0.25 Scottish Blackface − 0.4 (12.58) 0.34 (0.224) 0.43 Welsh Mule − 25.8 (37.06) 0.63 (0.559) 0.16
Texel − 44.4 (55.01) 0.91 (0.778) 0.01
All data (no grouping) 0.70 (1.44) 0.28 (0.023) 0.56
Table 4. Regression coefficients (with standard errors) for the linear functional relationships between
live weight and methane emissions in four breeds of mature ewes (n = 8 per breed) offered a range of fresh
forage diets ad libitum, or when offered dried grass pellets offered at restricted intakes formulated to meet
individual animal energy requirements.
Figure 1. Relationships between (a) ewe live weight and methane emissions, and (b) ewe feed dry matter intake
emissions from the Scottish Blackface being significantly higher than from the Welsh Mule. The calculated values for Ym followed a similar pattern (7.0, 8.1, 6.7 and 7.4% for Welsh Mountain, Scottish Blackface, Welsh Mule and
Texel respectively; s.e.d. 0.42%; P< 0.05).
Restricting intakes of grass pellets to maintenance requirements produced a reasonable overall relationship between LW and CH4 (Table 4; Fig. 3a), because individual allocations of feed offered (and consumed) were based
on the animals’ LW, i.e. DMI was controlled by LW. Within each sheep breed, the correlations between LW and CH4 were generally very poor. There was no significant effect of breed on the slope of the functional relationship,
but there were significant differences in the elevation of the regression lines (P< 0.001) and in the location of the groups (P < 0.001). The overall linear functional relationship between grass pellet DMI and CH4 emissions was
moderate (constant = − 5.2 [s.e. = 2.11], slope = 0.03 [s.e. = 0.003]; r= 0.77, P< 0.001; Fig. 3b), and there was no significant difference between breed groups in the slopes of the relationship, although there were significant effects of elevation (P< 0.001) and location (P< 0.001).
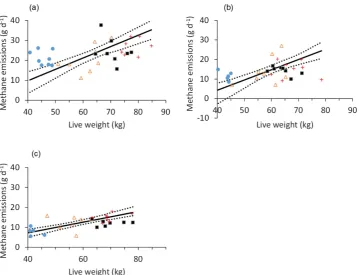
Figure 2. Relationships between ewe live weight and methane emissions when offered (a) ryegrass,
(b) permanent pasture, and (c) Molinia.The solid lines are the linear functional relationships, and the dotted lines are the 95% confidence intervals. Four breeds were used: Welsh Mountain ( ), Scottish Blackface ( ), Welsh Mule (■ ) and Texel ( ).
Pasture type fed r F probability
Perennial ryegrass
CH4 DMI CH4 DMI
DMI 0.74 – DMI < 0.001 – LW 0.39 0.55 LW 0.028 0.002 MLW 0.39 0.54 MLW 0.030 0.002
Permanent pasture
CH4 DMI CH4 DMI
DMI 0.81 – DMI < 0.001 – LW 0.38 0.29 LW 0.030 0.104 MLW 0.39 0.30 MLW 0.028 0.100
Molinia
CH4 DMI CH4 DMI
DMI 0.45 – DMI 0.009 –
LW 0.50 0.49 LW 0.003 0.004 MLW 0.50 0.49 MLW 0.004 0.004
Table 5. Pearson correlations (r) and probabilities for associations between live weight (LW), metabolic
LW (MLW; LW0.75), dry matter intake (DMI) and methane emitted for ewes zero-grazed on contrasting
Discussion
The goal of the current study was to establish the extent to which body size of different UK sheep breeds and asso-ciated parameters such as feed intake influence CH4 emissions from sheep consuming well defined grass-based
diets of differing nutrient concentrations. A zero-grazing approach was chosen to minimise potential confounding of differences in enteric CH4 production with differences in grazing behaviour. Ruminant diets have a clear effect
on CH4 production18, but it was not possible to compare between pasture types in this study because the three
diets were offered to the sheep at different times, and thus pasture effects would be potentially confounded with differences in ambient conditions and the metabolic status of the ewes. The experimental design with forages fed in separate experimental runs was chosen to allow data collection over as short a time period as possible for each forage in order to minimise confounding with changes in sward chemical composition.
When the ewes were offered the permanent pasture and Molinia voluntary DMI increased with LW, as expected given the greater nutritional demands in absolute terms of larger animals, with intakes of the different breed
Figure 3. Relationships between (a) ewe live weight and methane emissions, and (b) ewe feed dry matter intake
types then similar when they were expressed on a MLW basis. When offered ryegrass the intake of the Scottish Blackfaces ewes was lower than that of the Welsh Mountains and Texels even on a MBW basis, but a higher apparent digestibility compensated for this. Thus, the DDMI per unit MBW was similar for all breed types regardless of the nutritional characteristics of the particular forage offered. Methane emissions from sheep are known to increase with increasing DM digestibility19, because as more of the feed is fermented, more CH
4 is produced. This explains
the higher CH4 yields (g CH4 kg−1 DMI) from the more digestible pastures in the present study, which fall within
the range of previously observed values of forages fed to sheep20. Changes in the diets of ruminants to improve
digestibility are often confounded with changes in the diet components, such that, for example, increasing diet digestibility by increasing the proportion of cereals, can reduce CH4 emissions. However, this is because the starch
present in cereals is known to reduce the production of CH4, compared to the fibres present in large proportions
in most forages, through changes in rumen fermentation patterns21,22. In the present study, the diets were all cut
from grass swards and differences in DM digestibility were limited to differences in basic grass composition. Sheep breed type only affected the amount of CH4 emitted per head per day when the ewes were offered the Molinia,
the least digestible of the three forages fed, suggesting a limited effect of sheep genetics on CH4 emissions23. The
lower CH4 emissions from the Welsh Mountain ewes relative to the Texel ewes when offered this forage mirrors
breed differences in DMI.
As ad libitum DMI across the range of fresh forage diets increased, the rate of increase in CH4 output was
similar for all four different breeds of sheep. Even though feed intake scales with LW, because energy and protein requirements for maintenance of body processes increase as body size increases17, the relationship between LW
and CH4 emissions was positive but only moderately correlated. This agrees with previous work in which
cas-trated male sheep were offered dry diets (chaffed oaten hay and cracked lupins) at ad libitum rates24, compared
to studies in which the correlation between feed intake and daily CH4 production was much higher at restricted
levels of intake11,12. In this study heavier ewes consumed more feed than lighter ewes, and the response in feed
intake to LW was not different between breeds. Thus, although CH4 emissions are generally linked to body size
by feed intake–with larger animals eating more than smaller ones-the relationship between CH4 production and
LW in this study was weak when the ewes were fed pasture ad libitum, and therefore is unlikely to be of value for improving UK national GHG inventory reporting. Although the nutrient requirements of ewes within commercial flocks change throughout the year due to factors such as pregnancy and lactation, the timing of the current study was representative of when most mature UK ewes would be barren and dry.
When the sheep were fed the common diet of grass pellets according to predicted maintenance energy require-ments (based on LW), there was stronger correlation to CH4 emissions, but there was still a large amount of
individual animal variation in the amount of CH4 produced for a given amount of feed consumed. Such variation
between individual sheep not attributable to feed composition has been observed previously16,25,26, and contributes
significantly to the uncertainty in the estimates of CH4 emissions for national inventory reporting27. However, such
variability among individuals, which likely has a genetic basis28, also indicates the potential for breeding livestock
with reduced methane emissions29.
When CH4 emissions from the pasture-fed animals were multiplied up to give annual values, as used in the Tier
1 IPCC inventory approach30, the EFs recorded when the ewes were offered ryegrass were broadly in keeping with
the value for sheep quoted by the IPCC, whereas those on the permanent pasture and Molinia were substantially lower. A similar pattern was found for the calculated values for Ym. The data that IPCC Tier 1 default EFs are derived
from are limited31, and for example the UK data32 that contributed to it was from a small number of sheep fed a
restricted diet of pellets made mostly of straw, sunflower-seed meal and barley, i.e. very different to ad libitum fresh pasture. It is for this reason that country-specific data are required for Tier 2 and 3 methods of inventory reporting.
In summary, regardless of pasture type ewe LW was a relatively poor indicator of DMI and therefore a poor predictor of CH4 emissions from sheep of different breed sizes. There was a stronger relationship between DMI
and daily CH4 emissions. Live weight therefore currently has limited value in the prediction of CH4 emissions
from mature ewes, and is unlikely to be of benefit in the development of Tier 2 methodologies for agricultural greenhouse gas inventory reporting. There was a large amount of between-animal variability, although this did not differ between breeds, and if a greater understanding of the factors underlying this variability was obtained, LW may become a more useful factor for predicting CH4 emissions for inventory calculations.
Methods
Animals used.
The work described was conducted in accordance with the requirements of the UK Animals (Scientific Procedures) Act 1986 and with the approval of the Aberystwyth University Animal Welfare and Ethical Review Board. Measurements were made on mature barren ewes of four different breed types: Welsh Mountain, Scottish Blackface, Welsh Mule (Welsh Mountain × Border Leicester) and Texel (n = 8 per breed). The Welsh Mountain and Scottish Blackface are hardy hill breeds commonly used in extensive production systems on mar-ginal grasslands. Cross-bred ewes such as the Welsh Mule are larger and more prolific, and are generally used in more intensive production systems based on improved pasture. The Texel breed is a large meat breed valued for its carcass characteristics. Animals were selected from their respective flocks on the basis of LW and uniformity of body condition score33. All animals were drenched with an anthelmintic prior to the start of each experiment.Experimental treatments and measurements.
The experiment comprised two parts: the first part inves-tigated CH4 emissions from the sheep feed on freshly cut forages, while the second part investigated CH4 emissions(15%) as the main components, and (3) a Molinia caerulea-dominated native grassland (Molinia). The procedure was similar for each experimental period; ryegrass was fed in August to September 2011, the permanent pasture was fed in October to November 2011, and the Molinia was fed in August to September 2012. In each experimental period, following an adaptation period of at least three weeks during which the ewes received their experimental diets both in group pens and then in individual pens (for three days), they were individually housed in one of four calibrated CH4 chambers34 and data were collected for three consecutive days for each individual animal.
Throughout the experiment the ewes were fed on an ad libitum basis, with two equal portions offered at 0900 and 1600. Stored forage was kept refrigerated at approximately 4 °C. Fresh water was available continuously. The same group of 32 ewes was used for all three experiments, with the exception of a Scottish Blackface and a Texel ewe being replaced before the permanent pasture experiment, and again before the Molinia experiment. Within a given breed each animal was assigned to one of the 8 chamber runs per forage at random, and during each run the ewes were randomly assigned to individual CH4 chambers.
During the follow-up study measurements were made when the same group of four breeds of ewes were fed to maintenance requirements based on LW17. Initially the animals were group-penned according to type and offered
the grass pellets in combination with grass silage, with the feeding rates for the grass pellets reflecting live weights. Following an initial acclimatisation period of at least two weeks, one ewe of each breed was selected at random and the four animals housed together in a group pen. At this time the silage was withdrawn and the ewes were fed grass pellets alone. After three days the ewes were transferred to individual pens and offered the grass pellets at quantities calculated to meet their individual maintenance requirements based on LW17. Following a further
three-day acclimatisation period the animals were transferred to the CH4 chambers where they were fed their
individual rations as two equal portions offered at 0900 and 1600.
The LW of the sheep was recorded prior to them entering the CH4 chambers and again as they were removed.
The weights of feed offered and feed refused were recorded on a daily basis. Representative sub-samples of the material offered each day were oven dried at 80 °C to constant weight in order to determine DM content. A further sub-sample of the feed offered was collected at each feeding and bulked for each three-day chamber run prior to subsequent analysis to determine chemical composition. Ash was measured by igniting samples in a muffle furnace at 550 °C for 16 h and gross energy was determined by adiabatic bomb calorimetry. Total nitrogen (TN) concentrations were determined using a Leco FP 428 nitrogen analyser (Leco Corporation, St. Joseph, MI, USA). Water-soluble carbohydrate concentrations were measured by an automated anthrone technique35. Neutral deter
gent fibre and acid detergent fibre were determined using the method of Van Soest et al.36, adapted for the Gerhardt
Fibrecap detergent system (FOSS UK Ltd, Warrington, UK). Digestibility of organic matter in the DM (DOMD) was determined according to the two-stage method of Tilley and Terry (1963), adapted for the ANKOM DAISYII 220 incubator system (ANKOM Technology Corporation, Fairport, NY, USA).
All faeces were collected twice daily (immediately prior to morning and afternoon feeding). The faeces were weighed fresh, and subsamples taken to determine DM. Faecal DM output data, together with feed DM intake data, were used to calculate apparent whole-tract DM digestibilities.
Methane production was determined by comparing the CH4 concentrations in air entering and leaving the
chambers at a known rate of airflow. An eight port single channel CH4 gas analyser (MGA3000; ADC Gas Analysis
Ltd, Hoddesdon, UK) was used to determine CH4 concentrations in ambient air and in the exhaust gas leaving
each chamber on a rotational basis. The analyser was calibrated using gases of known methane concentrations. Ambient gas was sampled from points between each pair of chambers. For the ryegrass zero-grazing experiment the airflow of each chamber’s exhaust pipe was recorded twice daily during the CH4 measurement period using
an air velocity meter (TA440; TSI Instruments Ltd, High Wycombe, UK). Ten replicate airflow measurements for each chamber’s exhaust pipe were recorded twice daily. For all subsequent experiments air flow data was measured continuously using mini-vane anemometers (MiniVane6, Schiltknecht Messtechnik, Switzerland) attached to a data logger (MSR145, MSR Electronics GmbH, Switzerland).
Calculations and data analysis.
One Texel ewe and one Welsh Mule ewe did not complete the measurements on one pasture type each, and their data were excluded from the study. Methane emissions data were calculated assuming standard temperature and pressure of 0 °C and 101.325 kPa. Statistical data analysis was carried out using Genstat 16th Edition (VSN International Ltd, Hemel Hempstead, UK). Metabolic LW was calculated as mean LW0.75.One-way analysis of variance was used to investigate breed differences for each forage type. Pearson’s correlation coefficients were calculated to investigate the correlations between daily CH4 emissions and DMI, LW and
met-abolic LW, and the correlation between individual pen and chamber feed intake values for each feed type. Linear functional relationship (type 2 regression) using the bisector model was used to regress daily CH4 emissions on
LW and on DMI, with and without the use of sheep breed and pasture type as grouping factors.
References
1. Steinfeld, H. et al.Livestock’s Long Shadow: environmental issues and options. Rome: Food and Agriculture Organization of the United Nations. (2006).
2. Foresight. Foresight land use futures project. Final project report. The Government Office for Science, London. UK (2010). 3. FAOSTAT. Available at: http://faostat3.fao.org. Date of access: 09/10/2015.
4. IPCC. 2006 IPCC Guidelines for National Greenhouse Gas Inventories, Prepared by the National Greenhouse Gas Inventories Programme. (IGES, 2006).
5. Murray, R. M., Bryant, A. M. & Leng, R. A. Methane production in the rumen and lower gut of sheep given lucerne chaff: effect of level of intake. Br. J. Nutr.39, 337–345 (1978).
6. Pinares-Patiño, C. S. et al. Methane emission by alpaca and sheep fed on lucerne hay or grazed on pastures of perennial ryegrass/ white clover or birdsfoot trefoil. J. Agric. Sci. 140, 215–226 (2003).
8. Ulyatt, M. J., Lassey, K. R., Shelton, I. D. & Walker, C. F. Methane emission from dairy cows and wether sheep fed subtropical grass-dominant pastures in midsummer in New Zealand. N.Z. J. Agric. Res. 45, 227–234 (2002).
9. Dwyer, C. M. & Lawrence, A. B. A review of the behavioural and physiological adaptations of hill and lowland breeds of sheep that favour lamb survival. Appl. Anim. Behav. Sci.92, 235–260 (2005).
10. Steinheim, G., Odegard, J., Adnoy, T. & Klemetsdal, G. Genotype by environment interaction for lamb weaning weight in two Norwegian sheep breeds. J. Anim. Sci.86, 33–39 (2008).
11. Molano, G. & Clark, H. The effect of level of intake and forage quality on methane production by sheep. Aust. J. Exp. Agric.48, 219–222 (2008).
12. Robinson, D. L., Goopy, J. & Hegarty, R. S. Can rumen methane production be predicted from volatile fatty acid concentrations?
Anim. Prod. Sci. 50, 630–636 (2010).
13. Robinson, D. L. et al. Sire and liveweight affect feed intake and methane emissions of sheep confined in respiration chambers. Animal
8, 1935–1944 (2014).
14. Blaxter, K. L., Wainman, F. W. & Wilson, R. S. The regulation of food intake by sheep. Anim. Sci.3, 51–61 (1961). 15. Allison, C. D. Factors affecting forage intake by range ruminants: a review. J. Range Manage., 305–311 (1985).
16. Blaxter, K. L., Clappert, J. l. & Wainman, F. W. Extent of Differences between 6 British Breeds of Sheep in Their Metabolism Feed Intake and Utilization and Resistance to Climatic Stress. Br. J. Nutr.20, 283-& (1966).
17. AFRC. Energy and Protein Requirements of Ruminants. An advisory manual prepared by the AFRC Technical Committee on the Responses to Nutrients. (CAB International, 1993).
18. Hristov, A. N. et al. SPECIAL TOPICS—Mitigation of methane and nitrous oxide emissions from animal operations: I. A review of enteric methane mitigation options. J. Anim. Sci.91, 5045–5069 (2013).
19. Pelchen, A. & Peters, K. J. Methane emissions from sheep. Small Rumin. Res. 27, 137–150 (1998). 20. Waghorn, G. C., Tavendale, M. H. & Woodfield, D. R. In Proc. NZ Grass. Assoc. 167–171.
21. Jentsch, W. et al. Methane production in cattle calculated by the nutrient composition of the diet. Arch, Anim. Nutr.61, 10–19 (2007). 22. Moss, A. R., Givens, D. I. & Garnsworthy, P. C. The Effect of Supplementing Grass-Silage with Barley on Digestibility, in-Sacco
Degradability, Rumen Fermentation and Methane Production in Sheep at 2 Levels of Intake. Anim. Feed Sci. Technol.55, 9–33 (1995). 23. Goopy, J. P. et al. Low-methane yield sheep have smaller rumens and shorter rumen retention time. Br. J. Nutr.111, 578–585 (2014). 24. Bickell, S. L., Revell, D. K., Toovey, A. F. & Vercoe, P. E. Feed intake of sheep when allowed ad libitum access to feed in methane
respiration chambers. J. Anim. Sci.92, 2259–2264 (2014).
25. Hammond, K. J. et al. The variation in methane emissions from sheep and cattle is not explained by the chemical composition of ryegrass. Proc. NZ Soc. Anim. Prod.69, 174–178 (2009).
26. Pinares-Patiño, C. S. et al. Assessment of the sulphur hexafluoride (SF6) tracer technique using respiration chambers for estimation of methane emissions from sheep. Anim. Feed Sci. Technol.166–167, 201–209 (2011).
27. Lassey, K. R. Livestock methane emission: From the individual grazing animal through national inventories to the global methane cycle. Ag. For. Meteorol. 142, 120–132 (2007).
28. Pinares-Patiño, C. S. et al. Repeatability of methane emissions from sheep. Anim. Feed Sci. Technol.166–167, 210–218 (2011). 29. Hayes, B. J., Lewin, H. A. & Goddard, M. E. The future of livestock breeding: genomic selection for efficiency, reduced emissions
intensity, and adaptation. Trends Genet.29, 206–214 (2013).
30. Dong, H. et al. In 2006 IPCC Guidelines for National Greenhouse Gas Inventories, Prepared by the National Greenhouse Gas Inventories Programme Vol. 4: Agriculture, Forestry and Other Land Use (eds H. S. Eggleston et al.) (IGES, Japan, 2006).
31. Crutzen, P. J., Aselmann, I. & Seiler, W. Methane production by domestic animals, wild ruminants, other herbivorous fauna, and humans. Tellus B38B, 271–284 (1986).
32. Mathers, J. C. & Walters, D. E. Variation in methane production by sheep fed every two hours. The Journal of Agricultural Science98,
633–638 (1982).
33. MLC. Planned carcase production in Sheep Management Matters, No.8. Milton Keynes, UK: Meat Livestock Commission. (2000). 34. Gardiner, T. D. et al. Determination of the absolute accuracy of UK chamber facilities used in measuring methane emissions from
livestock. Measurement66, 272–279 (2015).
35. Thomas, T. A. An automated procedure for the determination of soluble carbohydrates in herbage. J. Sci. Food Agric. 28, 639–642 (1977).
36. Van Soest, P. J., Robertson, J. B. & Lewis, B. A. Methods for dietary fiber, neutral detergent fiber, and nonstarch polysaccharides in relation to animal nutrition. J. Dairy Sci.74, 3568–3597 (1991).
Acknowledgements
The authors would like to thank S. Doran for her assistance with data and sample collection. Statistical advice was provided by R. Sanderson (Aberystwyth University) and I. McKendrick (Biomathematics & Statistics Scotland). This work was funded by Defra, the Scottish Government, DARD and the Welsh Government as part of the UK’s Agricultural GHG Research Platform (www.ghgplatform.org.uk)
Author Contributions
J.M.M. and M.D.F. initiated the research, analysed the data, and co-wrote the manuscript. V.J.T. and H.R.F. facilitated and carried out the animal work. All authors reviewed the manuscript.
Additional Information
Competing financial interests: The authors declare no competing financial interests.
How to cite this article: Moorby, J.M. et al. Can live weight be used as a proxy for enteric methane emissions from pasture-fed sheep?. Sci. Rep.5, 17915; doi: 10.1038/srep17915 (2015).