InTrans Project Reports
Institute for Transportation
6-2015
Implementation Manual — 3D Engineered
Models for Highway Construction: The Iowa
Experience
Garret D. Reeder
Gabriel A. Nelson
Follow this and additional works at:
http://lib.dr.iastate.edu/intrans_reports
Part of the
Civil Engineering Commons
This Report is brought to you for free and open access by the Institute for Transportation at Iowa State University Digital Repository. It has been accepted for inclusion in InTrans Project Reports by an authorized administrator of Iowa State University Digital Repository. For more information, please [email protected].
Recommended Citation
Reeder, Garret D. and Nelson, Gabriel A., "Implementation Manual — 3D Engineered Models for Highway Construction: The Iowa Experience" (2015).InTrans Project Reports. 130.
Implementation Manual — 3D Engineered Models for Highway
Construction: The Iowa Experience
Abstract
3D engineered modeling is a relatively new and developing technology that can provide numerous benefits to owners, engineers, contractors, and the general public. This manual is for highway agencies that are
considering or are in the process of switching from 2D plan sets to 3D engineered models in their highway construction projects. It will discuss some of the benefits, applications, limitations, and implementation considerations for 3D engineered models used for survey, design, and construction. Note that is not intended to cover all eventualities in all states regarding the deployment of 3D engineered models for highway
construction. Rather, it describes how one state—Iowa—uses 3D engineered models for construction of highway projects, from planning and surveying through design and construction.
Keywords
Concrete overlays, Highway design, Highways, Pavement design, Pavements, Preservation, Resurfacing, Rehabilitation, Pavement Preservation, Pavement Resurfacing, Pavement Rehabilitation
2711 South Loop Drive, Suite 4700 Ames, IA 50010-8664
515-294-5798 www.cptechcenter.org
June 2015
IMPLEMENTATION MANUAL
3D ENGINEERED MODELS FOR HIGHWAY
CONSTRUCTION:
1. Report No.
Project RB33-014
2. Government Accession No. 3. Recipient’s Catalog No.
4. Title and Subtitle
Implementation Manual—
3D Engineered Models for Highway Construction: The Iowa Experience
5. Report Date
June 2015
6. Performing Organization Code
7. Author(s)
Garret D. Reeder and Gabriel A. Nelson
8. Performing Organization Report No. InTrans Project 14-489
9. Performing Organization Name and Address
National Concrete Pavement Technology Center Institute for Transportation, Iowa State University 2711 South Loop Drive, Suite 4700
Ames, IA 50010-8664
10. Work Unit No. (TRAIS)
11. Contract or Grant No.
12. Sponsoring Organization Name and Address
Iowa Department of Transportation 800 Lincoln Way
Ames, IA 50010
Federal Highway Administration 1200 New Jersey Avenue SE Washington, D.C. 20590
13. Type of Report and Period Covered
Manual
14. Sponsoring Agency Code
Project RB33-014
15. Supplementary Notes
16. Abstract
3D engineered modeling is a relatively new and developing technology that can provide numerous benefi ts to owners, engineers, contractors, and the general public. This manual is for highway agencies that are considering or are in the process of switching from 2D plan sets to 3D engineered models in their highway construction projects. It will discuss some of the benefi ts,
applications, limitations, and implementation considerations for 3D engineered models used for survey, design, and construction. Note that is not intended to cover all eventualities in all states regarding the deployment of 3D engineered models for highway construction. Rather, it describes how one state—Iowa—uses 3D engineered models for construction of highway projects, from planning and surveying through design and construction.
17. Key Words
concrete overlay — pavement preservation — pavement resurfacing — pave-ment rehabilitation
18. Distribution Statement
No restrictions. This document is available to the public through the National Technical Infor-mation Service, Springfi eld, Virginia 22161 19. Security Classifi cation (of this
report)
Unclassifi ed.
20. Security Classifi cation (of this
page)
Unclassifi ed.
21. No. of Pages
56
22. Price
NA
Form DOT F 1700.7 (8-72) Reproduction of completed page authorized
IMPLEMENTATION MANUAL
3D ENGINEERED MODELS FOR HIGHWAY CONSTRUCTION:
THE IOWA EXPERIENCE
June 2015
Authors
Garret D. Reeder, P.E., Snyder & Associates, Inc. Gabriel A. Nelson, P.E., Snyder & Associates, Inc.
Technical Advisors
Dale S. Harrington, P.E., Snyder & Associates, Inc.
E. Thomas Cackler, P.E., National Concrete Pavement Technology Center, Iowa State University
Contracting Officer Technical Representative
Brian Smith, P.E., Iowa Department of Transportation
Editor
Marcia Brink, National Concrete Pavement Technology Center, Iowa State University
Designer
Stephen Post, National Concrete Pavement Technology Center, Iowa State University
Copyeditor
Carol Gostele, Birch Tree Editing
About This Manual
This manual is a product of the National Concrete Pavement Technology Center (CP Tech Center) at Iowa State
Univer-sity. It describes how the state of Iowa uses 3D engineered models for construction of highway projects, from planning and surveying through design and construction. This manual is not intended to cover all eventualities regarding the deployment of 3D engineered models for highway construction. Rather, it describes one state’s—Iowa’s— approach.
Acknowledgments
The CP Tech Center and the authors gratefully acknowledge the financial support of the Federal Highway Administra-tion, through its Every Day Counts Program, regarding the development of this manual. We also appreciate the input and advice of the knowledgeable technical content experts who served on the Technical Advisory Committee, led by Brian Smith of the Iowa Department of Transportation. The committee consists of the following people: Brian Smith, Iowa DOT; Thomas Hamski, Iowa DOT; Kevin Merryman, Iowa DOT; Normal Miller, Iowa DOT; Melissa Serio, Iowa DOT; Brian VanPelt, 3D Surface Solutions, LLC; Cedric Wilkinson, Iowa DOT
For More Information
Peter Taylor, Director Marcia Brink, Senior Editor
National Concrete Pavement Technology Center Iowa State University Research Park
2711 S. Loop Drive, Suite 4700 Ames, IA 50010-8664
515-294-9480 www.cptechcenter.org/ [email protected]
Mission
The mission of the National Concrete Pavement Technology Center is to unite key transportation stakeholders around the central goal of advancing concrete pavement technology through research, technology transfer, and technology implementation.
Notices and Disclaimers
The preparation of this manual was financed in part through funds provided by the Iowa Department of Transportation through its “Second Revised Agreement for Management of Research Conducted by Iowa State University for the Iowa Department of Transportation,” and its amendments.
The opinions, findings, and conclusions or recom-mendations expressed in this publication are those of the
authors and not necessarily those of the Iowa Department of Transportation, the U.S. Department of Transportation, Federal Highway Administration, or Iowa State University.
This publication is intended solely for use by profes-sional personnel who are competent to evaluate the signif-icance and limitations of the information provided herein and who will accept total responsibility for the application of this information.
The Institute for Transportation, Iowa State University, and the principal investigators, authors, editors, designers, and illustrators make no representations or warranties, expressed or implied, as to the accuracy of any information herein and disclaim liability for any inaccuracies.
This document is disseminated under the sponsorship of the U.S. Department of Transportation in the interest of information exchange. The U.S. government assumes no liability for the use of the information contained in this document. This report does not constitute a standard, specification, or regulation.
The U.S. government does not endorse products or manufacturers. Trademarks or manufacturers’ names appear herein only because they are considered essential to the objective of the document.
Quality Assurance Statement
The Federal Highway Administration (FHWA) provides high-quality information to serve government, industry, and the public in a manner that promotes public understanding. Standards and policies are used to ensure and maximize the quality, objectivity, utility, and integrity of its information. FHWA periodically reviews quality issues and adjusts its programs and processes to ensure continuous quality improvement.
Nondiscrimination Statement
Iowa State University does not discriminate on the basis of race, color, age, ethnicity, religion, national origin, preg-nancy, sexual orientation, gender identity, genetic informa-tion, sex, marital status, disability, or status as a U.S. veteran. Inquiries can be directed to the Director of the Office of Equal Opportunity, 3350 Beardshear Hall, 515-294-7612.
Table of Contents
Definitions of Important Terms
1Chapter 1: Introduction
What Are 3D Engineered Models? 3 Organization of This Manual 6 Lessons Learned in Iowa 6 Downstream Users of 3D Engineered Models 7 Owners of Transportation Facilities 7 Regulatory/Review Agencies 7 Utility Companies 7 General Public/Property Owners 8
Chapter 2: Surveying and 3D Engineered
Models
Advances in Survey Equipment and Technologies 9 Terrestrial Mapping Survey Equipment and
Technologies 9
GPS 9
Total Stations 11
Digital Levels 12
LiDAR 12
Terrestrial LiDAR 12
Mobile LiDAR 12
Aerial LiDAR 13
LiDAR Data 14
LiDAR Accuracy 14
Data Management 15
Aerial Photography 15 Subsurface Utility Engineering (SUE) 15 Quality Levels for SUE 16
Quality Level D 16
Quality Level C 16
Quality Level B 16
Quality Level A 16 Data Incorporation 17 SUE Data Collection Tools and Equipment 17 Ground-Penetrating Radar 17 Electromagnetic Equipment 18 Air and Hydro Excavation 18
Benefits of SUE 18
Safety 18
Savings 18
Implementation Considerations 18 Building the 3D Engineered Model: Existing
Conditions 20
Processing the Survey Data 20
DTM 22
Additional Survey Equipment Information 22 Training and Product Updates 24
Chapter 3: Designing With 3D Engineered
Models
Design Product Creation and Delivery 25 Scoping/Planning Phase 25
Survey Phase 26
Roadway Geometrics/Layout Phase 26 Final Design Phase 26 Structural Design 26 Hydraulic Design 27 Geotechnical Design 27 3D Design and Analysis Tools 27 Virtual Drive-Through and Flyover 27 Parametric Modeling 28 Constructability Analysis 28 Sight Distance Analysis and Clear Zones 28
Traffic Analysis 28
Inclement Weather Analysis 29
Clash Detection 29
3D Engineered Model Quality Assurance 30 Implementation Considerations 32
Complete 3D Model 32
CAD Standards 33
Interval Spacing 34
Software Capabilities 34
Bid Letting 34
Chapter 4: Application of 3D Engineered
Models in Highway Construction
AMG and Control Systems 36 Automated Machine Guidance for Grading 36 Automated Machine Control 36 Equipment Applications 36 Grading Equipment 36
Excavators 37
Compaction Equipment 38 Milling and Paving Machinery 38 Stringless Technology 38
Computer Inputs 40
Grading and Excavation 41 Paving and Milling Machines 42 AMG User Guidelines 43
Training 43
Error Checking 43
File Management 43
Contractor Creation of 3D Engineered Model 43 Uploading the 3D Engineered Model 43 Equipment Check 44 Construction Staking Requirements 44 Survey Base Station 44 Survey Control and Machine Control for
Scheduling, Cost Estimating, and Project Management
Applications 44
DTMs and Earthwork Quantity Estimation 45 4D and 5D Modeling and Beyond: Contractor
Applications 45
Facilities Management 46 Quality Assurance and Post-construction Applications 46
Figures & Tables
Figure 1-1. Elements of a 3D engineered model. 4 Figure 1-2. 3D Visualization model for presentation
purposes. 3
Figure 1-3. A different view of the same 3D
visualization model shown in Figure 1-2. 3 Figure 1-4. 3D modeling can be used to
demonstrate flood impacts. 7 Figure 1-5. 3D engineered model showing how a pedestrian ramp will impact local businesses. 8 Figure 2-1. Historical surveying equipment. 9 Figure 2-2. GNSS receiver used for surveying. 9 Figure 2-3. How a rover receives signals from the
GNSS. 10
Figure 2-4. Available GNSS reference stations
across the country. 10 Figure 2-5. The IaRTN base station map. Find
permanent base stations in Iowa at
www.iowadot.gov/rtn/index.aspx 10 Figure 2-6. Permanent base station. 11 Figure 2-7. Robotic total station used for surveying. 11 Figure 2-8. A substation survey that was performed using laser scanning technology. The total station captured images and placed the survey points
on top of the image. 11 Figure 2-9. Modern total stations can be used
to gather data using laser scanning (left), traditional ground shots (center), or ortho
corrected images (right). 11 Figure 2-10. Digital level used for transferring
elevations across a project site. 12 Figure 2-11. Terrestrial scanner. 12 Figure 2-12. This photo shows a control point
target that was used on the I-35 & IA92
interchange project. 12 Figure 2-13. Control point locations on the I-35 and IA92 interchange project. The control points are delineated by triangles on this map. 12 Figure 2-14. Mobile LiDAR vehicle used for
obtaining survey data. 13 Figure 2-15. Mobile LiDAR vehicles use scanners to collect accurate survey data on pavement
surfaces in a short timeframe. 13 Figure 2-16. Top: Point cloud data on the I-35 and IA92 interchange as it would appear on a computer screen. Bottom: The same location as depicted in the point cloud. 13 Figure 2-17. Aerial LiDAR uses GPS to determine the exact location of the scanner. 14
Figure 2-18. A tree canopy that has been surveyed using aerial LiDAR technology. 14 Figure 2-19. Aerial LiDAR is limited by its line of sight. When aerial LiDAR flies over a tree canopy, the user must filter out the points on the vegetation and use only those points that reached the ground
surface. 14
Figure 2-20. Screenshot of point cloud data at the I-35 and IA92 interchange. 15 Figure 2-21. Standard guidelines used to describe quality levels for utility locates. 16 Figure 2-22. SUE-risk/cost analysis. Although the cost increases with higher quality levels of subsurface utility engineering, risk is greatly
reduced. 17
Figure 2-23. A 3D representation of subsurface
utilities in an urban setting. 17 Figure 2-24. Walk-behind ground penetrating
radar system. 17
Figure 2-25. Hydro excavation operation to locate underground utilities. 18 Figure 2-26. Mobile LiDAR data gathered at the I-35 and IA92 interchange. 20 Figure 2-27. Raw survey data in the form of .csv file. 21 Figure 2-28. Screenshot of point cloud data at the I-35 and IA92 interchange. Arrows show “noise” from a car that was captured during the survey
operations. 21
Figure 2-29. Survey data on the I-35 and IA92 interchange. The blue linework represents field survey and mobile LiDAR data. The triangles represent photogrammetric data that were
supplemented into the model. 21 Figure 2-30. Survey linework on I-35 and IA92
interchange obtained from traditional survey
methods. 23
Figure 2-31. Triangulation view of existing site
conditions at I-35 and IA92 interchange. 23 Figure 2-32. Existing site conditions at I-35 and IA92 interchange. This model has rendering options turned on to assist the user in identifying elevation changes based on colors. 22 Figure 2-33. A 3D engineered model of an urban intersection with SUE. 22 Figure 3-1. A public meeting between engineers and local residents during the early stages of
a project is critical for obtaining public approval. 25 Figure 3-2. Elevation contours created using
Figure 3-3. The I-35 and IA92 interchange
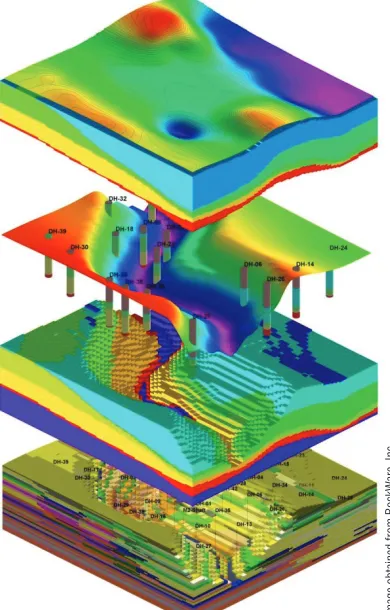
including the bridge designed in 3D. 26 Figure 3-4. Discharge and elevation data from a hydraulic model can be shown on a digital terrain model developed from LiDAR data to accurately demonstrate impacts of different flood events. 27 Figure 3-5. Geotechnical 3D model showing
above-ground surface and geological layers. 27 Figure 3-6. How a flyover appears to the designer on the I-35 and IA92 interchange. 28 Figure 3-7. Screenshot of a parametric model of
a retaining wall. 28
Figure 3-8. 3D engineered models can assist designers with visualizing important staging
concerns in complicated projects. 29 Figure 3-9. 3D engineered models allow the
design team to calculate clear zones and vertical clearances to improve the safety of the traveling
public. 29
Figure 3-10. 3D engineered models can be imported into traffic simulation software to perform traffic flow analyses. 29 Figure 3-11. 3D engineered models have the
capability to perform snow drift analysis
throughout a corridor. 29 Figure 3-12. This screenshot shows a “soft clash” utility conflict within a 3D engineered model. 30 Figure 3-13. This screenshot shows a “hard clash” utility conflict within a 3D engineered model. 30 Figure 3-14. Traditional cross sections used to
assist designers with visualizing how the roadway
should be graded. 31
Figure 3-15. Templates with specific point names are critical when creating 3D engineered models that are compatible among agencies and
contractors. 33
Figure 4-1. Automated machine guidance utilizes satellite positioning and onboard computers to
guide the equipment. 36 Figure 4-2. Example of a monitor inside the cab of a dozer equipped with AMG technology. 37 Figure 4-3. A motor grader equipped with AMG
technology. 37
Figure 4-4. A dozer equipped with AMG technology. 37 Figure 4-5. A scraper equipped with AMG
technology. 37
Figure 4-6. The photo on the top shows an excavator equipped with AMG technology. The photo on the bottom shows a typical monitor found inside the cab of an AMG equipped excavator. 37 Figure 4-7. Intelligent compaction can utilize GPS
for location on a project site. 38 Figure 4-8. Stringless paving can be used for
asphalt applications in addition to concrete. 38 Figure 4-9. Stringless technology mounted on a
milling machine. 38
Figure 4-10. How stringless paving machines use robotic total stations for horizontal and vertical
machine control. 39
Figure 4-11. Traditional stringline paving relied on sensors to detect changes in elevation and direction, which introduced the opportunity for
human error. 39
Figure 4-12. Traditional stringline near a curve. 40 Figure 4-13. A horizontal curve that was paved
using stringless technology. 40 Figure 4-14. Illustration of the errors that can be introduced using traditional stringline for paving
operations. 41
Figure 4-15. 3D breaklines contained within the 3D engineered model are used by AMG equipment for horizontal and vertical control. 41 Figure 4-16. AMG excavators use the 3D
engineered model for trench depths and alignment. 42 Figure 4-17. Pavement edge lines and breaklines are necessary for stringless paving control. 42 Figure 4-18. 3D line strings on the mainline
alignment on the I-35 and IA92 interchange. 42 Figure 4-19. Survey control points on a typical
stringless paving project. 45 Figure 4-20. Traditional earthwork calculations
were performed using the average end-area method at evenly spaced cross sections, similar
to this graphic. 45
Figure 4-21. Construction inspectors can use survey-grade GPS rovers to traverse the site and spot check elevations. 47 Figure 4-22. Tablets can be used by inspection
personnel to record notes, calculate quantities, and document field modifications. 47 Figure 4-23. Handheld GPS devices can record horizontal locations of utilities and other pertinent information on the project site. 47 Figure 4-24. Handheld GPS device. 47
Table 2-1. Approximate Accuracies and Costs
of Survey Equipment. 19 Table 3-1. Example Point Names and Corresponding Components for Roadway Templates. 33 Table 4-1. Typical Tolerances Achieved with AMG. 38 Table 4-2. Iowa DOT Recommended File Formats
Definitions of Important Terms
3D Model
A 3D model is a digital graphical representation of proposed facility/site data consisting of X, Y, and Z coordinates for producing objects in three dimensions to communicate design intent useful for visualization, analysis, animation, simulation, plans, specifications, estimates production, and life-cycle asset management. An accurately designed 3D model will be tied to a defined coordinate system.
4D Model
A 4D model is a digital graphical representation of facility/ site data producing object(s) in three dimensions incor-porating temporal sequences (e.g., construction activities schedule) and/or temporal dynamic objects (e.g., moving vehicles or pedestrians) progressing over time.
5D Model
A 5D model produces object(s) in three dimensions that incorporate not only temporal sequences progressing over time (schedule), but also costs (budget/cost expenditures).
xD Model
An xD model refers to the concept that new and different aspects of project information can be integrated into the 3D engineered model. Like its cousin, the geographic informa-tion system (GIS), the model has significant potential to be used in cross-platform applications.
Automated Machine Guidance (AMG)
Automated machine guidance is a process in which construction equipment is linked directly to the operation of machinery with a high level of precision, improving the speed and accuracy of construction processes. The AMG can utilize the GPS or robotic total stations for positioning information.
Cartesian Coordinate System
The Cartesian coordinate system, often referred to as X, Y, Z coordinates, is a coordinate system that specifies each point uniquely in a three-dimensional space by a set of three numerical coordinates, which are the signed distances from the point of intersection of three mutually perpendicular planes, measured in the same unit of length. Each reference line is called a coordinate axis or just axis of the system, and the point where they meet is its origin, usually at (0, 0, 0).
Civil Integrated Management (CIM)
Civil integrated management is the “collection, organization and managed accessibility to accurate data and information related to a highway facility including planning, environ-mental, surveying, design and construction, maintenance, asset management, and risk assessment” (Federal Highway Administration, American Association of State Highway and Transportation Officials, American Road and Transportation Builders Association, and Associated General Contractors).
Clash Detection
Clash detection is the process of identifying whether or not two or more objects occupy the same three-dimensional space. The process is also used to determine if objects, such as sewer and water lines, have enough separation to meet code requirements.
Digital Terrain Model (DTM)
A DTM is a digital topographic model of the earth’s surface minus objects such as trees, vegetation, and structures that can be manipulated through computer-aided design programs. All elements of the DTM are spatially related to one another in three dimensions.
Global Navigation Satellite System (GNSS)
The GNSS is a network of satellites that provide signals to ground receivers, which may use triangulation to calculate global position.
Global Positioning System (GPS)
The GPS is a subset of GNSS and refers to a specific network of satellites maintained by the United States government. The term “GPS” is also used colloquially to refer to the
broader GNSS. The GPS uses a base station unit, a rover unit, and satellites to accurately locate objects using triangulation.
Light Detection and Ranging (LiDAR)
Point Cloud
Point cloud is the collective term for the millions of data points recorded through the use of laser scanning or LiDAR data collection. The points are defined by a three-dimen-sional coordinate system.
Surface
CHAPTER 1: INTRODUCTION
3D engineered modeling is a relatively new and developing technology that can provide numerous benefits to owners, engineers, contractors, and the general public. This manual is for highway agencies that are considering or are in the process of switching from 2D plan sets to 3D engineered models in their highway construction projects. It discusses some of the benefits, applications, limitations, and imple-mentation considerations for 3D engineered models used for survey, design, and construction.
Some of the key points that are highlighted throughout this manual include the following:
• Improved construction documents and communication between the owner, consultant, and contractor. • Enhanced processes for stakeholder buy-in on projects. • Enhanced identification and resolution of possible
conflicts, issues, and errors before construction. • Better ability to visualize subsurface features, thereby
reducing the risk of utility conflicts.
• Optimized material usage and potentially reduced costs due to greater accuracy of construction.
• Greater productivity and flexibility in the construction process, which leads to lower construction costs and faster schedules.
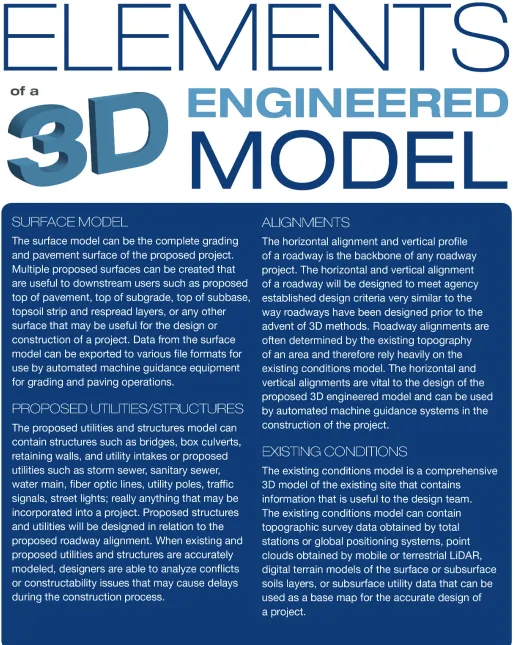
What Are 3D Engineered Models?
A 3D engineered model is defined as a digital graphical representation of proposed facility and site data consisting of X, Y, and Z coordinates for producing objects in three dimensions to communicate design intent useful for visualization, analysis, animation, simulations, plans, specifications, production estimates, and life-cycle asset management.
The graphic on the following page (Figure 1-1) shows the different elements that make up a 3D engineered model. A complete 3D engineered model includes the base survey data, proposed horizontal and vertical alignments, and proposed features and structures model. The graphic depicts the Interstate 35 and Iowa 92 (I-35 and IA92) inter-change project in rural Iowa, which is referenced numerous times throughout this manual.
All of the objects in a 3D engineered model are spatially related in the assigned coordinate system. Because the objects are spatially related, the 3D engineered model can be viewed from various perspectives, such as isometric and elevation views, to assist the designer with visualizing the data. This allows the designer to more easily identify design and constructability concerns prior to the design reaching the field.
When discussing 3D methods, it is important to under-stand the difference between 3D engineered models and 3D visualization models. 3D engineered models are the product of extensive survey, design, and coordination to develop a computerized model that accurately communicates the existing site conditions and the intent of the designer. The 3D engineered model can be used by the contractor to
construct a project with increased accuracy in a short time frame.
On the other hand, a 3D visualization model is more closely associated with presentations and information provided to the public via websites and public information meetings. Figures 1-2 and 1-3 are examples of 3D visualiza-tion models created for a nontechnical audience.
3D visualization models convey aesthetics by illustrating how the roadway and bridge design will look for a nontech-nical audience, and they generally lack the accurate survey data needed to properly construct the project.
Figure 1-2. 3D Visualization model for presentation purposes.
Organization of This Manual
This manual discusses how the use of 3D engineered models affects all stages of a roadway construction project, from surveying and utility locations to project design to construc-tion.
Chapter 2 covers how 3D technology is being employed in obtaining survey data more quickly and efficiently than ever before. Items and applications such as global posi-tioning systems (GPSs), total stations, digital levels, and light detection and ranging (LiDAR) are discussed. New 3D technology can produce large amounts of survey data in less time. This manual covers how software has the capability to process and manipulate large amounts of data into accurate and detailed models of existing site conditions.
In addition to increased efficiencies achieved through new survey technologies, more accurate underground utility location data can also be obtained. New developments in subsurface utility engineering, or SUE for short, have improved the information of subsurface utility features for 3D engineered models. Chapter 2 also shows how SUE information can be utilized in the 3D engineered model to improve safety and reduce the potential for costly contract modifications.
Chapter 3 describes the creation of 3D engineered models by the design team. 3D engineered models created by the design team provide the ability of the layperson to visualize the plans in a three-dimensional space. This removes a large obstacle to communication that has been common with traditional 2D plan sets. Additionally, they allow trained engineering professionals to eliminate spot or point errors and to analyze what is often quite complex multidimensional data. Chapter 3 discusses how the use of 3D engineered models can improve the accuracy of the finished product prior to construction. The discussion includes the features and benefits of modeling in 3D such as the following:
• Improved accuracy of design surfaces. • Site grading challenges.
• Staging and constructability issues. • Virtual drive-through and flyover. • Parametric modeling.
• Inclement weather analysis. • Traffic analysis.
• Clash detection.
• Improved earthwork calculations.
Chapter 4 covers 3D technology in highway construc-tion. Along with the benefits of 3D engineered models in the phases of survey and design, numerous benefits can be achieved during construction. Perhaps the most important benefit of 3D technology is the improved safety of workers
on the construction site. By reducing the need for stringline and grade stakes, workers are spending less time traversing the site while in close proximity to large equipment.
Construction operations can also benefit by reducing the field-to-finish time of a project by utilizing 3D engineered models. Typical construction schedules consist of tight deadlines and expensive penalties if construction is not completed in the time allotted. The use of 3D engineered models can optimize construction schedules by giving contractors the ability to visualize various stages of the construction process and better utilize existing conditions to get the most out of the design.
Additional benefits covered in this manual that are provided by 3D engineered models during construction include the following:
• Increased quality control.
• Less risk of schedule and cost overruns by analyzing staging and constructability concerns prior to breaking ground.
• Optimizing the use of construction materials and providing more accurate quantity calculations.
Lessons Learned in Iowa
This manual also discusses design and implementation considerations that agencies should address when imple-menting the use of 3D engineered modeling. The discussion includes lessons that have been learned by the Iowa Department of Transportation (Iowa DOT) in its mission for full implementation of 3D technology into the design and construction phase of highway infrastructure projects. A list of the implementation lessons that are discussed throughout the manual includes the following:
• Consistent computer-aided design (CAD) standards are essential.
• Files should be provided to all contractors before bid letting.
• The 2D plan set is the contractual design document. • The contractor is responsible for making sure the 3D
electronic files match the 2D plan set.
• Construction tolerance specifications do not get tighter with the use of automated machine guidance (AMG) construction.
• Do not require contractors to use 3D methods for construction; rather provide it as an alternative method to allow contractors to benefit from efficiencies.
Downstream Users of 3D Engineered Models
Not only does the use of 3D engineered models provide benefits in the form of increased efficiency and safety, but the benefits reach far beyond the engineering and construc-tion industry. The concept of data streamlining can be achieved by utilizing 3D engineered models. Downstream users can utilize the engineering data within the model instead of having to regenerate their own model from a 2D plan set. Data streamlining creates less preparation for construction oversight personnel and construction surveyors. 3D engineered models can also be utilized by various other downstream users such as the following: • Owners.
• Regulatory/review agencies. • Utility companies.
• Interested public/affected property owners. • Construction surveyors.
• Contractors. • Facilities managers.
• Project planners at the next cycle of the project. This is certainly not a comprehensive list of all the potential users of design data, but it is a representative list of downstream users that are found on a typical roadway project. Downstream users vary in technical skill and back-ground, from having no technical background to having a considerable knowledge base and utilizing the design data to construct the end product.
Owners of Transportation Facilities
Owners of transportation facilities such as State DOTs have the ultimate responsibility to the public to provide infra-structure that moves people and goods safely and efficiently while being good stewards of the public funds. Owners can benefit by the use of 3D engineered models by recognizing improved bid prices from contractors. Contractors can view the 3D engineered models prior to submitting bids to more accurately calculate quantities and look at the construc-tability of all aspects of construction to recognize where efficiencies can be achieved. The additional information that the model provides to the contractor reduces the risk associated with the project, which can lower bid prices.
Owners can also benefit from the standpoint of reducing the risk of contract modifications during construction. 3D engineered models allow the designer to perform clash detection analysis, which recognizes conflicts associated with the design and existing utilities within the corridor. Traditional 2D design methods may not have recognized utility conflicts until construction was well under way, sometimes creating costly and time-consuming contract modifications to rectify the issue.
Regulatory/Review Agencies
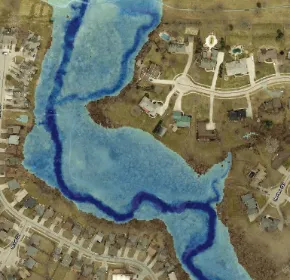
Regulatory/review agencies such as Departments of Natural Resources, floodplain managers, the U.S. Army Corps of Engineers, and numerous others can use the information obtained from the 3D engineered model for floodplain, flood analysis, wetland studies, National Environmental Policy Act permits, and other regulatory information. As shown in Figure 1-4, 3D engineered models can be combined with other graphic software to illustrate flood elevations and how flooding may impact property owners. The 3D engineered model can also be used by bridge
[image:19.612.373.518.240.380.2]designers and hydraulic engineers to determine appropriate elevations for bridges and structures to ensure they remain safe under flooding conditions.
Figure 1-4. 3D modeling can be used to demonstrate flood impacts.
The 3D engineered model has the capability to incorpo-rate wetland studies into the design. For example, designers can delineate potential wetland areas within the corridor and ensure that the design is not impacting the wetland. When the wetland areas are delineated in the 3D engineered model, the contractor also has the ability to make sure that no haul roads or storage areas are placed within the restricted area.
Utility Companies
General Public/Property Owners
3D engineered models provide a convenient way for the general public and affected property owners to visualize the project prior to construction. Figure 1-5 is an example of how 3D engineered models can be displayed for the general public.
The existing sidewalk in this graphic was not Americans with Disabilities Act (ADA) compliant, and the city deter-mined this sidewalk needed to be reconstructed with an approved pedestrian ramp. Using traditional 2D methods, it would have been difficult for the designers to illustrate how the intersection would look and function after construction was completed. Prior to seeing this graphic, the public may have had a skewed perception of the project and their initial thoughts may have been negative. However, after the public has a chance to view a graphic of the 3D engineered model that contains known references such as current businesses, traffic signals, street lights, and pavement markings, they may become more comfortable with the proposed improve-ments.
The following chapters provide an in-depth look at how to implement 3D engineered models in a way that benefits all interested parties.
Imageobtained from Iowa Department of T
ransportation
CHAPTER 2: SURVEYING AND 3D
ENGINEERED MODELS
During the survey stage of a project, data are collected using a variety of technologies, filtered and processed, then combined into one comprehensive 3D model that is passed on to the design team. The design team uses the survey information to build the 3D engineered model.
Advances in Survey Equipment and
Technologies
Early surveyors relied on survey equipment like that in Figure 2-1, which included rods, chains, staffs, transit levels, compasses, plump bobs, and theodolites. George Wash-ington began work as a surveyor using this equipment in 1748. The technologies have evolved, but the basic
princi-ples of surveying are still practiced using newer versions of the same equipment.
Today’s surveyors utilize sophisticated equipment such as robotic total stations, high-accuracy GPSs, digital levels, and laser scanners. To understand how 3D engineered models can incorporate the use of new survey technology, it is important to understand the capabilities of each piece of equipment, how it works, and the kind of data it collects.
Terrestrial Mapping Survey Equipment and
Technologies
Terrestrial mapping survey equipment includes GPS, digital levels, LiDAR, and total stations. Global positioning systems, digital levels, and total stations are referred to as traditional survey methods throughout this manual. Global positioning systems, LiDAR, and total stations use different technology to measure distance and angles to determine the horizontal and vertical location of existing features to place in a 3D engineered model. Digital levels obtain very accurate vertical information but do not measure horizontal position.
GPS
The power of much of today’s survey technology can be attributed to the development of GPSs. The global naviga-tion satellite system (GNSS) is a network of satellites that provides signals to ground receivers, which may use triangulation to calculate global position. The GPS uses a subset of GNSS and refers to a specific network of satellites maintained by the United States government. The United States Department of Defense first began using satellite systems with timing and ranging in the late 1970s. The term “GPS” is also used colloquially to refer to the broader GNSS.
Figure 2-2 shows a GNSS receiver unit.
Global positioning systems provide surveyors with many advantages. Before the invention of the GPS, surveyors had to traverse great distances to establish control points and survey baselines. Survey crews often consisted of two or three members to accomplish these tasks. Now, surveyors are able to get GPS satellite corrections at the push of a button and can survey in a fraction of the time. Many crews now are run by a single surveyor doing the work of several people through the use of high-tech equipment.
Understanding how GPS works and its limitations is extremely important. For example, the coordinate quality is affected by the atmospheric conditions, the length of the baseline, the geometric configuration of the available satellites, and other factors.
Figure 2-1. Historical surveying equipment.
Figure 2-2. GNSS receiver used for surveying.
Photo obtained from T
A GPS uses the following three components: • A base station unit.
• A rover unit.
• An open view of the sky to receive a satellite correction. The base station is set up on a known point, commonly referred to as a control point, where the exact location and elevation is known. The base station then transmits data to the rover, where the rover uses its distance and elevation offset from the control point to determine its exact X, Y, and Z coordinates. The rover is the third point for an accurate triangulation. The base station and the rover unit communi-cate back and forth via a radio link, and thus the user is limited to a range of a few miles with good conditions. Figure 2-3 is a graphic that shows how a GPS rover unit uses a base station for triangulation.
Recently, many State governments have begun to set up networks of continuously operating reference stations (CORS), which are permanent base stations to facilitate real-time kinematic (RTK) surveying. The State of Iowa, for example, has developed the Iowa Real Time Network, or IaRTN. These base station networks allow the user to connect remotely via the use of a cell phone modem to the nearest base station to receive range corrections. Some networks like the IaRTN are a free service, but others require users to pay an annual subscription fee to the network operator, as well as a data subscription to a cell phone carrier. The permanent base station network and cell phone modem take the place of a physical base station as well as saving the surveyor the time to set up and take down the base station on each project.
[image:22.612.304.557.44.265.2]A map of the available base stations located throughout the country is shown in Figure 2-4. The IaRTN base station locations can be seen in Figure 2-5. Figure 2-6 is an example of a permanent base station in the United States.
Figure 2-3. How a rover receives signals from the GNSS.
Graphic adapted from www
.blackroc-technology
.com
Figure 2-4. Available GNSS reference stations across the country.
Image obtained from National Geodetic Sur
vey
Figure 2-5. The IaRTN base station map. Find permanent base stations in Iowa at www.iowadot.gov/rtn/index.aspx
Image obtained from Iowa Department of T
ransportation
Figure 2-6. Permanent base station.
Survey Control Network
The importance of accurate survey control cannot be overstated, especially when using 3D methods. The topo-graphic survey that is obtained on the existing conditions must be correctly linked to the survey control for an accu-rate 3D engineered model. In states with numerous base stations, accurate survey control is not as much of a factor. Some states, however, struggle with obtaining an accurate survey. In states where survey control is inaccurate, 3D models can be off vertically by several inches. This creates issues when calculating earthwork quantities and when tying into existing surfaces. Agencies need to establish accurate survey control prior to
A GPS uses the following three components: • A base station unit.
• A rover unit.
• An open view of the sky to receive a satellite correction. The base station is set up on a known point, commonly referred to as a control point, where the exact location and elevation is known. The base station then transmits data to the rover, where the rover uses its distance and elevation offset from the control point to determine its exact X, Y, and Z coordinates. The rover is the third point for an accurate triangulation. The base station and the rover unit communi-cate back and forth via a radio link, and thus the user is limited to a range of a few miles with good conditions. Figure 2-3 is a graphic that shows how a GPS rover unit uses a base station for triangulation.
Recently, many State governments have begun to set up networks of continuously operating reference stations (CORS), which are permanent base stations to facilitate real-time kinematic (RTK) surveying. The State of Iowa, for example, has developed the Iowa Real Time Network, or IaRTN. These base station networks allow the user to connect remotely via the use of a cell phone modem to the nearest base station to receive range corrections. Some networks like the IaRTN are a free service, but others require users to pay an annual subscription fee to the network operator, as well as a data subscription to a cell phone carrier. The permanent base station network and cell phone modem take the place of a physical base station as well as saving the surveyor the time to set up and take down the base station on each project.
A map of the available base stations located throughout the country is shown in Figure 2-4. The IaRTN base station locations can be seen in Figure 2-5. Figure 2-6 is an example of a permanent base station in the United States.
Figure 2-3. How a rover receives signals from the GNSS.
Graphic adapted from www
.blackroc-technology
.com
Figure 2-4. Available GNSS reference stations across the country.
Image obtained from National Geodetic Sur
vey
Figure 2-5. The IaRTN base station map. Find permanent base stations in Iowa at www.iowadot.gov/rtn/index.aspx
Image obtained from Iowa Department of T
ransportation
Total Stations
The modern total station has been instrumental in the improved efficiency of survey crews throughout the nation and the world. The total station, sometimes referred to as a total positioning station (TPS), is one of the most useful pieces of equipment in the surveyor’s toolbox. It can measure distances, transfer elevations, stake points, collect topographic data, and much more. In Chapter 4, the use of TPS in AMG control systems in construction equipment is discussed.
Essentially, the total station is an electronic theodolite integrated with an electronic distance meter to read distances from the instrument to a particular point. It can take precise horizontal and vertical measurements between the base unit and a prism that is mounted on a portable staff or rod. Modern total stations can be remotely controlled by the surveyor, enabling one-man operation. Modern total station units can be integrated with GPSs. Figure 2-7 shows a modern robotic total station.
Some manufacturers have incorporated laser scanning capabilities into TPS units. An automated reflectorless mode enables the total station to collect tens or even hundreds of thousands of points in rapid succession. This allows the surveyor to collect even the most intricate details of a particular feature, so much so that the resulting point cloud resembles a photograph of the object. Laser scanning and point clouds are discussed in more detail later in this chapter.
Some total stations have the ability to take photographs as well. When the user selects a particular area to scan, the instrument captures multiple photographs of this same area and stitches them together. As long as there are multiple viewpoints (images) of the same target from at least two different setups of the TPS unit, the user is able to literally pick a point in the photograph and the instrument can calculate a coordinate value and elevation for it.
Figure 2-8 illustrates the image-capturing abilities of a total station. This is a substation survey with the points depicted on top of the images captured. The surveyor took panoramic images from three different locations around the site while performing the survey. The total station’s software was able to triangulate positions and elevations on the points shown above from the images taken by the total station. This allows data to be added to the model without the expense of an additional trip to the project site.
Figure 2-9 illustrates how a modern total station could be used to gather data in several different ways on a job site. A small scan could be done on an intricate area (left), traditional ground shots could be taken using the remote control (center), and orthocorrected images can be captured
Figure 2-6. Permanent base station.
Photo obtained from Iowa Department of Transportation
Figure 2-7. Robotic total station used for surveying.
Photo obtained from T
rimble Navigation Limited
Figure 2-8. A substation survey that was performed using laser scanning technology. The total station captured images and placed the survey points on top of the image.
to cover other areas for future data extraction (right). All of these items can be performed with a one-person survey crew taking advantage of high-tech equipment.
Digital Levels
Digital levels are another important tool that surveyors can use to obtain topographic information. Modern digital levels (Figure 2-10) allow surveyors to accurately transfer eleva-tions across project sites. Digital levels read a barcode on a level rod, as opposed to the traditional optical method of sighting the rod through a scope. Today’s best digital levels are capable of transferring elevations over half a mile using double-run leveling and an invar staff with a vertical accuracy to less than 0.01 ft.
LiDAR
One of the newest forms of technology available to
surveyors is the laser scanner. Whereas the equipment itself is known as a scanner, there are actually several types of laser scanning. The scanning data are collected with a tech-nology known as LiDAR. There are three types of LiDAR scanning: terrestrial, mobile, and aerial.
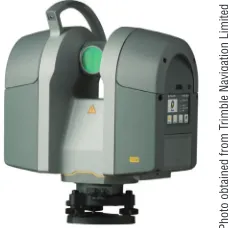
Terrestrial LiDAR
A single scanner mounted on a tripod (Figure 2-11) is used for terrestrial LiDAR or static scanning. The scanner spins 360 degrees from its fixed position and gathers reflectorless measurements at a specific density. The scanner’s range depends upon the specific model, but many current scanners can measure 3D position more than 100 ft in any direction with accuracy to within 0.02 ft. These scanners are capable of collecting thousands of points every second.
When it is necessary to have the data in the correct loca-tion or project datum, the scanner can be set up in between several known points (control points) that can be easily seen in the point cloud.
Targets are placed over these points to make them easily identifiable in the scan. These targets are typically arrows, spheres, or globes that show up well in the scan (see Figure 2-12). Several scans are required from various angles to accurately scan an object or a particular area and collect information on all sides of an object. The common control points are then used to properly align, or register, the point cloud data to be spatially accurate. Figure 2-13 shows the location of the targets that were used on the I-35 and IA92 project.
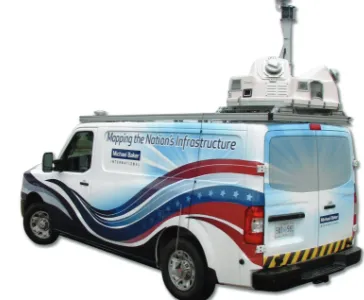
Mobile LiDAR
[image:24.612.378.486.43.150.2]When collecting scan data on a long corridor such as a roadway project, it becomes less cost effective to set up a static terrestrial scanner many times in order to gather all necessary data. Mobile LiDAR was developed for this
Figure 2-10. Digital level used for transferring elevations across a project site.
Limited
Figure 2-11. Terrestrial scanner.
Figure 2-12. This photo shows a control point target that was used on the I-35 & IA92 interchange project.
[image:24.612.381.495.189.303.2]Photo obtained from the Iowa DOT
Figure 2-13. Control point locations on the I-35 and IA92 interchange project. The control points are delineated by triangles on this map.
Graphic obtained from the Iowa DOT
Photo obtained from T
rimble Navigation
Photo obtained from T
application. The mobile LiDAR vehicle shown in Figure 2-14, with several laser scanners on board, drives through a corridor and the overlapping scan data from the scanner array collects the data needed while the vehicle and scanner are in motion.
Figure 2-15 is a simple graphic that shows how a typical mobile LiDAR vehicle collects data. Several variables are introduced with this system. Since the scanners are not sitting over a known point, GPS is integrated into the system to gather positional data for the vehicle. In addition, the vehicle is twisting and turning as it drives along. Sensitive inertial measuring units, or IMUs, keep track of the pitch, roll, and yaw of the vehicle while it is in motion. Finally, high-tech computers with sophisticated software take the data received from the scanner(s) and, using the IMU and the GPS sensor information, estimate and adjust the data trajectory and combine it all into a usable point cloud.
Digital cameras are also integrated into the system. The cameras capture images and video of the corridor as the vehicle travels through it. This can be used to create an overlay for the point cloud. The pixels in the images are spatially related to the scan data, so the user can point to a specific point in the photo or video and the software can identify the corresponding point in the point cloud.
The graphic on the left of Figure 2-16 shows the mobile LiDAR data that were collected on the I-35 and IA92 interchange project. The photo on the right of Figure 2-16 shows the mobile LiDAR vehicle at the same location as depicted in the graphic on the left.
Aerial LiDAR
Another useful tool in surveying is aerial LiDAR. It is similar to mobile LiDAR, but the scanners are mounted on an aircraft rather than a truck. Mobile LiDAR units are obvi-ously restricted to areas they can physically drive to, but an aircraft is not subject to those same limitations. The aircraft can fly in overlapping patterns and collect vast amounts of data from the air in a short amount of time. Typically, surveyors set a network of ground control monuments prior to the LiDAR flight. These targets are often large X-shaped targets that can be easily seen from the air. The surveyor obtains precise horizontal and vertical data on each of the targets and supplies those data to the LiDAR crew.
The graphic in Figure 2-17 illustrates how aerial LiDAR data are collected.
After the LiDAR flight, the scan data can be rotated and scaled into correct coordinate space using the targets. This process, known as orthocorrection, creates spatially accurate imagery that can be very useful in project planning. Because the scanner is much further away from the ground than it is
Figure 2-14. Mobile LiDAR vehicle used for obtaining survey data.
Image obtained from Michael Baker International
[image:25.612.325.575.433.657.2]Figure 2-15. Mobile LiDAR vehicles use scanners to collect accurate survey data on pavement surfaces in a short timeframe.
Figure 2-16. Top: Point cloud data on the I-35 and IA92 interchange as it would appear on a computer screen. Bottom: The same location as depicted in the point cloud.
Image obtained from the iowa DOT
in terrestrial or mobile LiDAR, the accuracy is diminished. On hard surfaces such as roadways or parking lots, many LiDAR providers can get data accurate within a few tenths of a foot (10 cm), depending upon the altitude of the flight. Ground surfaces with vegetation are less accurate, often showing errors of from 1 ft (30 cm) or more to several feet.
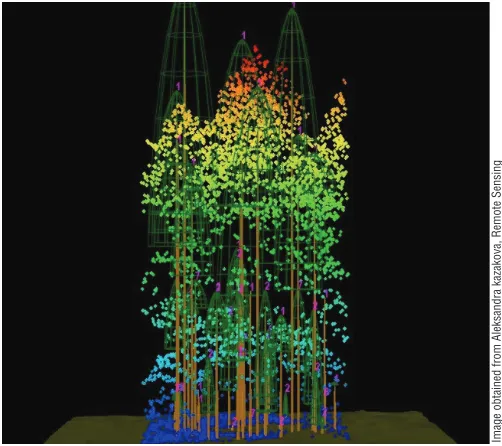
Figure 2-18 shows an overhead viewpoint of how LiDAR data appear to the user in a heavily forested area. In
Figure 2-19, the scanner collected many data points on the canopy of the trees, while certain measurements penetrated through to the ground level. Careful filtering of these data can yield a ground surface that is relatively accurate.
These aerial-based LiDAR surfaces provide designers with a quick and easy tool to begin the planning stages of projects. Some states have aerial LiDAR data available for free to download from various public universities. These data are typically broken down into tiles for ease of down-loading because of large file sizes containing millions of points.
LiDAR Data
Often, a detailed survey is the only way to obtain sufficiently precise data to design a project. In some cases, a detailed survey can be used for the critical areas, and LiDAR data can be used as a supplement for open areas or additional areas outside of the original project limits.
LiDAR Accuracy
The level of accuracy varies greatly between different types of LiDAR. This variation is due to a large number of factors, including the type of scanner being used, the site conditions, the distance between the object being scanned and the scanner, and other factors.
LiDAR surveys for use in 3D engineered models can require equipment and data acquisition methods with 1A and 1B levels of accuracy. A 1A level of accuracy can be defined as LiDAR data measured at 100 ft or less tightly constrained to ground control targets. A 1B level of accuracy can be defined as LiDAR data measured at 100 ft or less loosely constrained to ground control targets. When 3D modeling is required over larger areas more than 200 to 300 ft in length where correct drainage flow and grade elevation changes are critical, 1A level accuracy is required. When 3D modeling is needed only in a smaller area or at independent intermittent areas on a project, 1B level of accuracy can be sufficient.
Loosely constrained LiDAR can be precise and relatively accurate in a small area, but as the area of the model increases the relative accuracy to other areas in the model decreases. In a tightly constrained model, the precision and relative accuracy are maintained in every area. Loosely constrained LiDAR acquisition cost is about a third of
Figure 2-17. Aerial LiDAR uses GPS to determine the exact location of the scanner.
Figure 2-18. A tree canopy that has been surveyed using aerial LiDAR technology.
Image obtained from USDA Forest Ser
vice
Figure 2-19. Aerial LiDAR is limited by its line of sight. When aerial LiDAR flies over a tree canopy, the user must filter out the points on the vegetation and use only those points that reached the ground surface.
Image obtained from Aleksandra kazakova, Remote Sensing & Biospatial Analysis Laborator
y of the Precision Forestr
y
in terrestrial or mobile LiDAR, the accuracy is diminished. On hard surfaces such as roadways or parking lots, many LiDAR providers can get data accurate within a few tenths of a foot (10 cm), depending upon the altitude of the flight. Ground surfaces with vegetation are less accurate, often showing errors of from 1 ft (30 cm) or more to several feet.
Figure 2-18 shows an overhead viewpoint of how LiDAR data appear to the user in a heavily forested area. In
Figure 2-19, the scanner collected many data points on the canopy of the trees, while certain measurements penetrated through to the ground level. Careful filtering of these data can yield a ground surface that is relatively accurate.
These aerial-based LiDAR surfaces provide designers with a quick and easy tool to begin the planning stages of projects. Some states have aerial LiDAR data available for free to download from various public universities. These data are typically broken down into tiles for ease of down-loading because of large file sizes containing millions of points.
LiDAR Data
Often, a detailed survey is the only way to obtain sufficiently precise data to design a project. In some cases, a detailed survey can be used for the critical areas, and LiDAR data can be used as a supplement for open areas or additional areas outside of the original project limits.
LiDAR Accuracy
The level of accuracy varies greatly between different types of LiDAR. This variation is due to a large number of factors, including the type of scanner being used, the site conditions, the distance between the object being scanned and the scanner, and other factors.
LiDAR surveys for use in 3D engineered models can require equipment and data acquisition methods with 1A and 1B levels of accuracy. A 1A level of accuracy can be defined as LiDAR data measured at 100 ft or less tightly constrained to ground control targets. A 1B level of accuracy can be defined as LiDAR data measured at 100 ft or less loosely constrained to ground control targets. When 3D modeling is required over larger areas more than 200 to 300 ft in length where correct drainage flow and grade elevation changes are critical, 1A level accuracy is required. When 3D modeling is needed only in a smaller area or at independent intermittent areas on a project, 1B level of accuracy can be sufficient.
Loosely constrained LiDAR can be precise and relatively accurate in a small area, but as the area of the model increases the relative accuracy to other areas in the model decreases. In a tightly constrained model, the precision and relative accuracy are maintained in every area. Loosely constrained LiDAR acquisition cost is about a third of
Figure 2-18. A tree canopy that has been surveyed using aerial LiDAR technology.
Image obtained from USDA Forest Ser
vice
Figure 2-19. Aerial LiDAR is limited by its line of sight. When aerial LiDAR flies over a tree canopy, the user must filter out the points on the vegetation and use only those points that reached the ground surface.
Image obtained from Aleksandra kazakova, Remote Sensing & Biospatial Analysis Laborator
y of the Precision Forestr
y
Cooperative
that in which data are tightly constrained because of the control survey and data adjustment cost incurred for tightly constrained LiDAR data.
Data Management
With the use of laser scanning or LiDAR, data manage-ment and warehousing become extremely important. The collection of millions of data points for each project can cause electronic file sizes to become very large very quickly. These data, collectively known as a point cloud, allow engineers and designers to grab as little or as much data as they may need from the cloud in order to create their design. There are several software products that aid designers in the manipulation of this point cloud data. These products allow the user to bring in scan data with varying levels of manipu-lation, registry, filtering, and exploration.
The point cloud on the I-35 and IA92 interchange is shown in Figure 2-20. This point cloud was gathered by mobile LiDAR.
Aerial Photography
Aerial photography can be used as another method for acquiring survey data for which accuracy is needed within a few inches. Aerial photography, also called aerial photo-grammetry, utilizes large-format imagery and ground coor-dinate information to effectively recreate the geometry of a portion of the earth in a virtual environment. In this virtual environment, reliable horizontal and vertical measurements can be made and recorded (or compiled) directly into a geospatial data file.
Accurate measurements can be recorded from aerial photographic images by using traditional methods only when the following conditions are met: (1) stereoscopic image pairs (two or more overlapping photographs) cover the object to be analyzed; (2) accurate X, Y, and Z coordi-nates are known for at least three defined object points in the overlapping photographs; and (3) a calibrated mapping camera is used to take the photographs.
Figure 2-20. Screenshot of point cloud data at the I-35 and IA92 interchange.
Image obtained from the Iowa DOT
The compilation of planimetric features (such as roads and streams) and topographic information (topographic contours) from the photographic sources is accomplished through the use of digital stereoscopic instruments. Digital, or softcopy, photogrammetric workstations require special-ized software and hardware for viewing a pair of stereo images. In this virtual environment, an experienced operator can link the images with the ground control to collect precise horizontal and vertical coordinates for a point, line, polygon, or surface. The photogrammetric workstation recreates the geometry of the field subject through a series of mathematical operations. These procedures require a high level of expertise and repetition to maintain the operator’s skill.
Subsurface Utility Engineering (SUE)
Subsurface utility engineering is a branch of engineering practice that involves managing certain risks associated with existing subsurface utilities. It involves mapping utilities at appropriate quality levels, coordination with utility companies, design of relocated utilities, utility condition assessment, and implementation of utility accommodation policies. This definition is adapted from the Standard Guideline for the Collection and Depiction of Existing Subsurface Utility Data, CI/ASCE 38-02, from the American Society of Civil Engineers published in 2002.
This new ASCE standard did several things for the industry. The first was to put a formal definition to the prac-tice of SUE. Another significant piece of this standard was the definition of quality levels for existing utility informa-tion. Because designers obtain their utility information from so many sources, the information has varying degrees of reliability. The standard defined quality levels A, B, C, and D to associate with this information, with QL-A (quality level A) being the highest. These quality levels provide a way for
the designer to qualify the level of certainty of the location of the lines shown on the plans.
potential for a conflict or clash between existing utilities and proposed improvements. Being able to visualize these improvements in the same three-dimensional space, from different angles and at different stages of construction, reduces the potential to overlook these problems.
Quality Levels for SUE
There are four quality levels for SUE data. Quality Level D
Quality level D (QL-D) information is typically from maps, old records, or even verbal accounts of existing infrastruc-ture. Its usefulness is limited overall. Quality level D is the most basic level of information for utility locations. It comes solely from existing utility records or verbal recollections, both typically unreliable sources. It is useful primarily for project planning and route selection activities.
Quality Level C
Quality level C (QL-C) information is obtained when a surveyor surveys visible appurtenances on the surface, such as fire hydrants and valves, and then uses a map to connect the dots between these points. The information is accurate for the above-ground features, but it may contain some inconsistencies for the unseen portions. Quality level C is probably the most commonly used level of information. It involves surveying visible utility facilities (e.g., manholes and valve boxes) and correlating this information with existing utility records (QL-D information).
Quality Level B
Quality level B (QL-B) information is achieved via the use of surface geophysics. One such example is the use of a pipe and cable locator. The utility locator hooks a transmitter up to a tracer wire and induces a signal onto the wire. That signal is then traced from the surface and paint or flags are placed on top of the signal. If done well, this can yield quite accurate information about the horizontal location of buried infrastructure. Quality level B involves the application of appropriate surface geophysical methods to determine the existence and horizontal position of virtually all utilities within the project limits. This activity is called “designating.”
Quality Level A
Quality level A (QL-A) data are typically gathered only at specific points. It adds a third dimension to the QL-B data, and that is the precise elevation of the utility. Most often this is obtained via the use of test holes, or “potholing” as it is sometimes referred to. Once the horizontal location is known, a particular utility can be excavated at the point of a potential conflict to record its elevation. This gives one specific point at which the engineer knows exactly where the utility is located. Some people incorrectly use the idea of digging these test holes as doing SUE, when in fact it is the whole science and methodology of getting to this point that is the main idea behind SUE. Quality level A, also known as “locating,” is the highest level of accuracy presently available
and involves the full use of the SUE services.
Shown in Figure 2-21 are condensed versions of the Federal Highway Administration’s definitions of the various utility quality levels. A typical SUE project contains a mix of utility data falling into all four of these categories. As the quality level of information increases, so does the corre-sponding cost to obtain it.
Quality level A data points are the most expensive to obtain. The benefit of the higher quality level data are weighed at each stage of the project to determine the appropriate level of expenditure to collect data.
Figure 2-22 illustrates the typical correlation of balancing the benefit of gathering the higher-quality data with the cost of collecting the data on existing utilities. In the early stages of a project, utility mapping alone, or QL-D information, is sometimes enough. For example, if an engineer knew nothing more than the fact that the existing infrastructure was all on the west side of a road, that might be enough to know that he should design his new storm sewer to go in on the east side of the road to avoid expensive relocations. As the design advances, more detail is necessary, thus physical marking of utilities in the field is often necessary to further refine the plans.
Figure 2-22. SUE-risk/cost analysis. Although the cost increases with higher quality levels of subsurface utility engineering, risk is greatly reduced.
Image obtained from the American Society of Civil Engineers Standard Guideline for the Collection and Depiction of Existing Subsur
face Utility Data (38-02)
Figure 2-21. Standard guidelines used to describe quality levels for utility locates.
Image adapated from the American Society of Civil Engineers Standard Guideline for the Collection and Depiction of Existing Subsur
face Utility Data (38-02)