Fall 2018
Traffic Incident Detection using Cameras
Traffic Incident Detection using Cameras
Nikhil Bansal
Iowa State University, [email protected]
Follow this and additional works at: https://lib.dr.iastate.edu/creativecomponents
Part of the Artificial Intelligence and Robotics Commons, Software Engineering Commons, and the
Systems Architecture Commons
Recommended Citation Recommended Citation
Bansal, Nikhil, "Traffic Incident Detection using Cameras" (2018). Creative Components. 43.
https://lib.dr.iastate.edu/creativecomponents/43
Nikhil Bansal
A Creative Component submitted to the graduate faculty
in partial fulfillment of the requirements for the degree of
MASTER OF SCIENCE
Major: Computer Science
Program of Study Committee: Anuj Sharma, Co-major Professor
Samik Basu, Co-major Professor Soumik Sarkar
Iowa State University
Ames, Iowa
2018
TABLE OF CONTENTS
Page
LIST OF TABLES . . . iv
LIST OF FIGURES . . . v
ACKNOWLEDGMENTS . . . vi
DEDICATION . . . vii
ABSTRACT . . . viii
CHAPTER 1. INTRODUCTION . . . 1
1.1 Motivation . . . 1
1.2 Report Organization . . . 2
CHAPTER 2. OVERVIEW . . . 3
2.1 TIMELI . . . 3
CHAPTER 3. Camera Module Design and Implementation . . . 5
3.1 Architecture Design . . . 5
3.1.1 Congestion Detection . . . 5
3.1.2 Stalled Vehicle Detection . . . 6
3.2 Technology Description . . . 7
3.3 Implementation . . . 8
3.3.1 Congestion Detection . . . 8
4.0.1 Congestion Detection Module . . . 14
4.0.2 Stalled Vehicle Detection Module . . . 15
CHAPTER 5. FUTURE SCOPE . . . 16
5.1 Improvements . . . 16
5.1.1 Congestion Module . . . 16
5.1.2 Stalled Vehicle Module . . . 16
5.2 Integration with Other applications . . . 16
CHAPTER 6. CONCLUSION . . . 17
LIST OF TABLES
Page
Table 4.1 Precision, recall and accuracy values for the algorithm . . . 14
LIST OF FIGURES
Page
Figure 2.1 High level TIMELI Archtictecture . . . 4
Figure 3.1 Congestion Detection Module Architecture . . . 5
ACKNOWLEDGMENTS
I would like to take this opportunity to express my thanks to those who helped me with various
aspects of conducting research and the writing of this report. First and foremost, Dr. Anuj Sharma
for his guidance, patience and support throughout this research and the writing of this thesis. I
would also like to thank my committee members Dr. Samik Basu and Dr.Soumik Sarkar for their
help and support. I would additionally like to thank Pranamesh Chakraborty and Yaw Okyere
DEDICATION
Be more dedicated to making solid achievements than in running after swift but synthetic
hap-piness.
ABSTRACT
The number of road incidents have increased tremendously over past decade. The current
methods to detect any incident are good but not efficient enough to detect the incidents on time
which leads to higher travel times and inefficient use of transportation network. The aim of this
project is to develop a robust and fast incident detection on a road.
In the method explored, live images and videos are captured from the traffic cameras situated on
various roads and highways. The images are used to detect congestion on the road and the videos
are used to detect any stalled vehicle at the side of the road. The software also captures the time
the incident started as well as the time it ended. A copy of the images and videos of detected
CHAPTER 1. INTRODUCTION
1.1 Motivation
No roadways are immune from human error, and particularly on high-speed facilities, every
additional second of instability leads to an increasingly negative impact on all motorists in terms
of mobility and safety. A incident on road can mean a congestion ( which might be because of an
accident, heavy traffic volume or any other reason) or it can be a stalled vehicle at the side of the
road (which might also lead to congestion). The impact of traffic congestion is wide range. In most
cases it leads to delays, mental and physical fatigue, higher fuel consumtion and in some cases it
can even lead to loss of life. The cost of congestion in 2014 was calculated to be $160 billion for
the top 471 urban areas of United States. This included 6.9 billion hours of wasted time and 3.1
billion gallons of wasted fuel[3].
There can be several reasons for the incident. For stalled vehicle, most of the times it
is a damage to the car, running out of fuel or a medical emergency for one or more passengers. As
all of these reasons are very particular to the car or the people in the car, it is difficult to predict it
beforehand. But in case of congestion, there are some recurring congestions like in morning when
people go to office or any other time of the day when the traffic volume is very high. Using the
data of past months, it is possible to predict a congestion on a particular road in advance and then
appropriate steps can be taken to deal with it. Some of the steps can be re-routing traffic using
Dynamic Message Board or (in long-term) by sending a mobile notification to subscribed users, so
that they can avoid the route if possible.
The aim of this project is to provide a camera module that will use the images and live
video feeds from the cameras on the side of the roads to identify congestion and stalled vehicles in
real time. This will help the DOT operators to know about any congestion going on and thus take
1.2 Report Organization
The rest of this report is organized as follows. Chapter 2 gives an overview of the TIMELI
project developed at Institute of Transportation(InTrans) that provides a way to monitor traffic
conditions in real time. Chapter 3 provides the methodologies and software description for the
camera module. Chapter 4 shows the results of tests conducted. Chapter 5 then explains future
CHAPTER 2. OVERVIEW
Camera Module is a part of TIMELI Project which is being developed by INTRANS. In this
chapter, we provide a brief overview of TIMELI so as to have an idea of how the camera module
will be used.
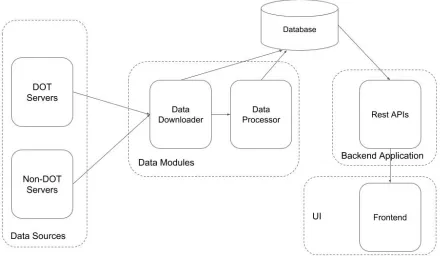
2.1 TIMELI
TIMELI (Traffic Incident Management Enabled by Large-data Innovations) is a software which
integrates innovative data analytics techniques in order to monitor traffic conditions in real time,
proactively control risk, quickly detect traffic incidents, identify the location and potential cause
of these incidents and suggest traffic control alternatives. This software will be provided to DOTs
where the operators will be alerted about any potential incident going in the area. The operators
can then manually verify whether it is an incident or not by checking the live video feeds in that
area.
In order to identify a potential incident, TIMELI uses various data sources which provides the
different types of information related to the traffic on road. Some of the data sources provide CSV
and XML feeds. In camera module, we are trying to leverage the live feeds from the cameras inorder
to identify any potential incident. Once an incident is detected, an alert is shown to the operator
on the screen along with the nearest cameras available to that incident. The operator then confirms
whether its an incident or not and take steps accordingly. Fig 2.1 shows the high-level architecture
CHAPTER 3. Camera Module Design and Implementation
The camera module is divided into two parts:
1. Congestion Detection: To detect congestion on roads.
2. Stalled Vehicle Detection: To detect stalled vehicle on roadsides.
3.1 Architecture Design
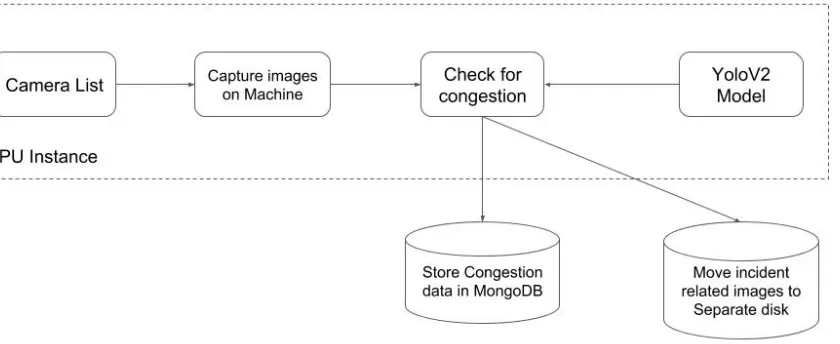
3.1.1 Congestion Detection
[image:14.612.106.526.453.625.2]Fig 3.1 shows the architeture for Congestion Detection part:
We start with a list of cameras in the region. This list will be obtained separately from the
DOT server. In the application, the YOLOV2 model is already loaded. The application starts
downloading the images for each camera simultaneuosly and uses the model that was loaded to
predict congestion in each image. Then the images are moved to a separate location and the
corresponding data is stored in MongoDB.
3.1.2 Stalled Vehicle Detection
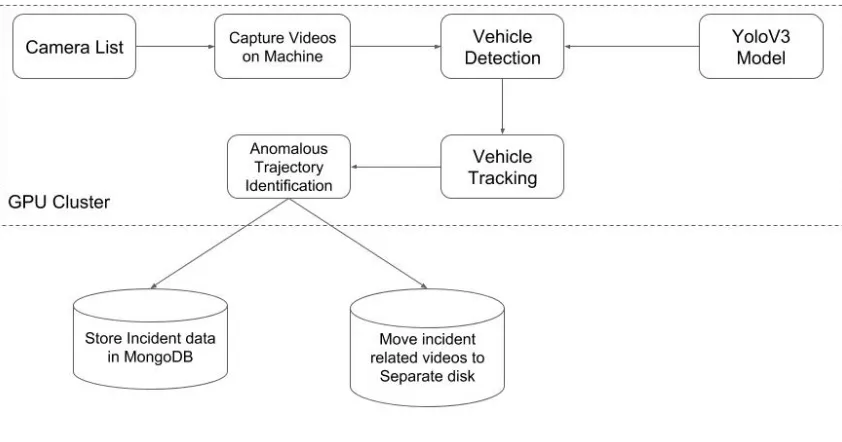
[image:15.612.96.517.344.565.2]Fig 3.2 shows the architeture for Stalled Vehicle Detection part:
Figure 3.2 Stalled Vehicle Detection Module Architecture
We start with a list of cameras in the region. This list will be obtained separately from the
DOT server. In the application, the YOLOV3 model is already loaded. The application starts
downloading the videos for each camera one 6 at a time and uses the model that was loaded to
detect vehicles in each video. Then we use SORT library to give a tracking id to each of the vehicles
separate location and the corresponding data is stored in MongoDB.
3.2 Technology Description
This section will discuss the technologies that have been used for the two modules.
1. ffmpeg[4]
ffmpeg is a very fast video and audio converter that can also grab from a live audio/video source.
It can also convert between arbitrary sample rates and resize video on the fly with a high
qual-ity polyphase filter. Each input or output url can, in principle, contain any number of streams
of different types (video/audio/subtitle/attachment/data). The allowed number and/or types of
streams may be limited by the container format. Selecting which streams from which inputs will
go into which output is either done automatically or with the -map option.
2. YOLO[5]
You only look once (YOLO) is a state-of-the-art, real-time object detection system. This is
orig-inally C based library that is used to detect different objects in an image in real time. Given its
usefuness and accuracy, various versions of these library have been produced in other languages
such as python. In recent years, a lot of improvements have been added to the original libraray
producing YOLOV2 and YOLOV3 libraries. We are using YOLOV2 for congestion detection and
YOLOV3 for stalled behicle detection.
3. MongoDB[6]
MongoDB is a document database with a lot of scalability and flexibility with the querying and
indexing. MongoDB is an open-source, document database designed for ease of development and
4. OpenCV[7]
OpenCV (Open Source Computer Vision Library) is an open source computer vision and machine
learning software library. The library has more than 2500 optimized algorithms, which includes
a comprehensive set of both classic and state-of-the-art computer vision and machine learning
algorithms.
3.3 Implementation
This section explains the actual implementation of the project.
3.3.1 Congestion Detection
We have used the algorithm proposed by Chakraborty et al.[1]
For understanding purpose, congestion detection module can be divided into three different parts:
1. Data Collection - Image downlaoder
As the name suggests, this part downloads the images from the cameras continuously at a fixed
intervals of time. The system is provided with a list of cameras that are available in the area. For
each camera a url to get the live feed is available. The system then uses the ’ffmpeg’ command
to capture the images. Once the command is run it keeps on downloading images at a particular
frequency until stopped manually or any sytem error occurs. This frequency is set to 20 sec for
each camera which can be changed, if required, using a config file. The downloaded images are
stored in different folders specific for each camera. The folders, if they don’t exist, are generated
automatically in the code. All these folders are present in a same location so as to ease the process
of reading these images for prediction. While saving the images on the disk, we also capture the
time the image was taken. This information is required in the prediction step.
2. Congestion Predictor
This is the part that uses the images downloaded in previous step and actually predicts whether
the images simultaneously but processes one at a time.
The YOLOV2 library uses a convoluted Neural network internally. This models is stored in project
in 4 files: dpm.data, dpm.names, yolodpm.cfg and yolodpm final.weights. At the start of the
pre-dictor module this model is loaded in the application which is then used to process the images.
For each image, the module uses openCV library to convert it into a numpy array in ’RGB’ format.
The image is then resized to half along horizontal as well as vertical axis. The model generated
above then uses this resized image to predict various objects with certain probabilities. We discard
any such detection with a probability lower than a certain threshold. This threshold is currently
set to 0.3. Based on the probability and the number of objects detected (in our case, number of
vehicles detected), it categorizes the image as congested or non-congested. After categorization,
we store camera name, date, time, class (congested or non-congested) and a unique id (that will
be given to this image) in Mongo Database.
Once an image has been processed, it is moved from the original input source to another location
depending on whether it was classified as congested or non-congested. This is done to ensure that
the same image is not accidentally read by the module again. This also helps us to ensure saving
the images for verification purposes later.
3. Congestion Continuity Validator
Since, images are processed one by one, it is very much possible that a single incident is going on in
a particular area for quite some time. But since we have different images at different times during
that incident, they might come up as different incidents even though it is the same incident. This
can lead to a lot of false positives. Hence, in Mongo Database, we have a stored javascript that
keeps a check on the data and determines the actual incidents. This was initially implemented
by Revanth[8] for SQL Database. We have implemented the MongoDB equivalent for it in this
project. The algorithm is as follows:
2. Sort the images according to timestamp.
3. Initialise a variable total =0.
4. Store the class of the previous image record in a variable ’x’ and check if current record has the
same class as ’x’
5. If the values are different, increment the value of ’total’.
6. After all records that we got in step 2 are processed, store the value of ’total’ in each of these
records.
7. Group all records with same value of ’total’ and ’x’ into one single record. While doing so, store
the time of first record as minTime and time of last record as maxTime.
8. Filter the records with the x value as 1 and ’total’ greater than 3.
9. Assign a new incident id to each record and store them in separate collection in database.
Data Storage Description
1. The quality of images recieved is from a camera is roughly around 480 pixels.
2. In terms of bytes, one image on an average corresponds to 20KB.
3. There are around 300 cameras in the area selected for this project.
4. Each camera captures one image in 20 seconds, that is, 3 images per minute.
5. Total images captured by all 300 cameras in a day corresponds to around 25GB per day.
This images are stored on the disk in the GPU machine.
Storage Implementation
Given the size of data that is received everyday, it is difficult to store all the images captured in a
day permanently. Hence, currently, we only store the images that are classified as congested. Since,
we have already moved all the ’congested’ images to a separate location, it makes it easier to write
a separate batch job that runs once a day and moves all these images to a separate disk. While
3.3.2 Stalled Vehicle Detection
We have used the algorithm proposed by Chakraborty et al.[2]
Stalled vehicle detection Module can be divided into following two parts:
1. Data Collection - Video Downloader
As the name suggests, this part downloads the videos from the cameras continuously at a fixed
intervals of time. The system is provided with a list of cameras that are available in the area. For
each camera, a url to get the live feed is available. The system then uses the ’ffmpeg’ command to
capture the videos for a particular duration of time. Once the command is run it keeps on
down-loading videos at a particular frequency until stopped manually or any sytem error occurs. This
frequency is set to 4.5 min for each camera which can be changed, if required, using a config file.
The downloaded videos are stored in different folders specific for each camera. The folders, if they
don’t exist, are generated automatically in the code. All these folders are present in a same location
so as to ease the process of reading these videos for prediction. While saving the videos on the
disk, we also capture the time the video was recorded. This information is required in the next step.
Explanation of Frequency calculation
Number of GPU machines available for the project: 4
Total number of cameras available ≈300
Rate of capture (per camera) = 5 framessec = 300 per minute
Number of cameras 1 GPU can process simultaneously = 6
Interval to capture at a time = 20 sec
Number of Cameras that can be processed by 1 GPU in a minute = 60sec
Interval to capture at a time∗
Number of cameras 1 GPU can process simultaneously = 18
Total time taken for all cameras covered = Total number of cameras available
Number of Cameras that can be processed by 4 GPU in a minute
≈4.5 min
2. Stalled Vehicle Detector This is the part that uses the videos downloaded in previous step and actually predicts whether there is a stalled vehicle on the road or not. This modules
starts by taking the location of videos as input. It then recusively explores all the folders inside
that location to grab all the images. This module takes as input all the videos simultaneously but
processes one at a time.
Once a video is loaded, there are 3 major steps:
Step1: Vehicle Detection - This step is very similar to detection of vehicles in congestion module. The only difference being use of YOLOV3 instead of YOLOV2 and the input being videos instead
of images. We use YOLOV3 because of better accuracy of this library on videos as compared to
YOLOV2.
Step2: Vehicle Tracking - Once a vehicle is detected, we need to assign a unique id to each vehicle. This is done using Simple Online Realtime Tracking(SORT). This is required to track each vehicle
separately, independent of any other vehicles present on the road.
Step3: Anomalous Trajectory Detection - Once all the vehicles are marked, we follow the trajec-tory of a vehicle to see if it is changing lane to right and reducing the speed until it stops. If this is
detected in the video, we classify the video as positive else negative. After categorization, we store
camera name, date, time, class (congested or non-congested) and a unique id (that will be given to
this video) in Mongo Database.
Once a video has been processed, it is moved from the original input source to another location
depending on whether it was classified as positive or negative. This is done to ensure that the same
video is not accidentally read by the module again. This also helps us to ensure saving the videos
The videos are very big in size and it is difficult to store all the videos captured in a day
perma-nently. Hence, currently, we only store the videos that are classified as positive. Since, we have
already moved all the ’positive’ videos to a separate location, it makes it easier to write a separate
batch job that runs once a day and moves all these videos to a separate disk. While moving the
videos, a unique id is given to the image which is also stored in MongoDB as explained earlier.
CHAPTER 4. RESULTS
4.0.1 Congestion Detection Module
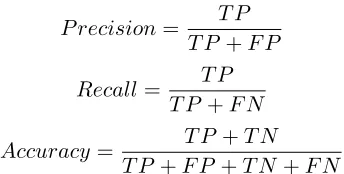
The performance of the algorithm was evaluated using the standard performance metrics of
precision, recall, and accuracy. It was trained on 1400 images and tested on 1018 images (518
congested and 500 non-congested). When a congested image was correctly labeled, it was classified
as true positive (TP). Similarly, if a non-congested image was correctly labeled as non-congested”,
then it was classified as true negative (TN). However, if the actual label was congested and the
predicted label was non-congested, it was classified as false negative (FN). And finally, if the actual
label was non-congested and the predicted label was congested, it was classified as false positive
(FP).
P recision= T P
T P +F P
Recall= T P
T P +F N
Accuracy= T P +T N
T P +F P +T N+F N
The data corresponding to this experiment can be seen in the Table 4.1 below. We see that the
algorithm performs better as compared to using deep convoluted neural networks[1] for the same
[image:23.612.220.392.419.506.2]purpose.
Table 4.1 Precision, recall and accuracy values for the algorithm
Precision (%) Recall (%) Accuracy (%)
Our labeled trajectory dataset consists of 15 incident trajectories and 15 normal trajectories. To
find out the sensitivity of the algorithm on the number of labeled examples, we ran each algorithm
for label sample sizes varying from 5-15 trajectories for each class (normal and incident). We label
a video as an incident video if at least 1 trajectory in the video is classified as incident trajectory
by the algorithm. The accuracy of the algorithm (ACC) is given by the accuracy of correctly
classifying incident videos (TPR) and baseline videos (TNR). TP and TN refer to the number of
correctly identified incident and baseline videos while P and N refer to total number of incident
and baseline videos (25 each).
T P R= T P
P
T N R= T N
N
ACC= T P +T N
P+N
The data corresponding to this experiment can be seen in the Table 4.2 below.
Table 4.2 TPR, TNR and ACC values for the algorithm
TPR TNR ACC
CHAPTER 5. FUTURE SCOPE
5.1 Improvements
With the advancements in technology (especially in Machine learning), there is a huge scope of
improvement in this project. From the results, it can be seen that this application can be further
improved to provide more accuracy.
5.1.1 Congestion Module
To improve the accuracy, we can probably approach this problem using a totally different
algorithm. In the current algorithm itself, we can try to use better quality of images. Instead of
just depending on number of vehicles in images, we can probably look into the time to take care of
recurrent congestions.
5.1.2 Stalled Vehicle Module
One of the problems in the current implementation is that if a vehicle is already stopped before
the video recording starts, it won’t be detected by the current algorithm. Further research can be
done definitely to approach this problem. Again, we can try some other library for vehicle detection
with better accuracy.
5.2 Integration with Other applications
This is a completely independent backend application. This is developed currently to be used
with TIMELI but it can be integrated with any application. Since, the actual data is stored in
MongoDB and it can be used to retrieve the images and videos, there is no barrier for the other
CHAPTER 6. CONCLUSION
Incident detection is required to detect congestion and stalled vehicles on the roads. The impact
of a incident is severe and it is reuired to leverage as many sources as possible to detect them with
accuracy, speed and efficieny.
In this work, we have developed a software that can utilise images and videos from camera feeds
to detect congestion and stalled vehicles respectively in real time. Even though this was a part of
a much bigger project TIMELI, we were able to make it as a separate independent project which
gives us flexibility to integrate it with any project. Since, we are storing time and id of images and
videos, different APIs can be written in any programming language in case we want to just see the
image/video based on date, time or incident id.
As discussed in last chapter, there is a lot of scope for improvement. Some of them might even lead
REFERENCES
[1] P. Chakraborty, Y.O. Adu-Gyamfi, S. Poddar, V. Ahsani, A. Sharma, and S Sarkar.
Traffic Congestion Detection from Camera Images using Deep Convolution Neural
Net-works. Transportation Research Record: Journal of the Transportation Research Board,
https://doi.org/10.1177/0361198118777631, June 2018.
[2] P. Chakraborty, A. Sharma, and C. Hegde. Freeway Traffic Incident Detection from
Cam-eras: A Semi-Supervised Learning Approach, IEEE Conference on Intelligent Transportation
Systems (ITSC), November 2018.
[3] Schrank, D., B. Eisele, T. Lomax, and J. Bak. 2015 urban mobility scorecard. . Texas A&M
Transportation Institute and INRIX,2015.
[4] ”Ffmpeg Documentation” https://www.ffmpeg.org/ffmpeg.html#Description.
[5] ”Yolo Documentation” https://pjreddie.com/darknet/yolo/,
[6] ”MongoDB Documentation”https://www.mongodb.com/what-is-mongodb,
[7] ”OpenCV Documentation”https://opencv.org/about.html,