Analyzing Student Process Data in
Game-Based Assessments with
Bayesian Knowledge Tracing and
Dynamic Bayesian Networks
Ying Cui
Department of Educational Psychology University of Alberta
Man-Wai Chu
Werklund School of Education University of Calgary
Fu Chen
Department of Educational Psychology University of Alberta
Digital game-based assessments generate student process data that is much more difficult to analyze than traditional assessments. The formative nature of game-based assessments permits students, through applying and practicing the targeted knowledge and skills during gameplay, to gain experiences, receive immediate feedback, and as a result, improve their skill mastery. Both Bayesian Knowledge Tracing and Dynamic Bayesian Networks are capable of updating students’ mastery levels based on their observed responses during the assessment. This paper investigates the use of these two models for analyzing student response process data from an interactive game-based assessment, Raging Skies. The game measures a set of knowledge and skill-based learner outcomes listed in a Canadian Provincial Grade 5 science program-of-study under the Weather Watch unit. To evaluate and compare the performance of Bayesian Knowledge Tracing and Dynamic Bayesian Networks, the classification consistency and accuracy are examined.
1.
I
NTRODUCTIONThe increasing concern of traditional standardized assessment measuring isolated skills, together with the rapid advance of digital technologies, has catalyzed the development of digital simulation- and game-based assessments (Bertling et al., 2015; DiCerbo, 2017)). These new assessment types can incorporate dynamic, interactive, real-world tasks in the digital environment such as a nature conservatory (Taiga Park; Barab et al., 2010) or a science laboratory (TreSim; Bennett et al., 2007). Digital simulation tasks are often complex in nature and require students to demonstrate skills in settings that resemble real-life situations (AERA, APA, and NCME, 2014). Students interact with the digital environment iteratively by first observing and learning the contexts and tasks, acting based on their evaluation and judgment, seeing the consequences, and reacting accordingly. The computer logs of students’ actions throughout the game, often called log data, process data, trace data, or more recently, evidence trace files, can be captured and analyzed for evidence of the targeted knowledge and skills in the content domain (Ercikan and Pelligrino, 2017; Shute and Ventura, 2013). However, as argued by Behrens et al. (2012), “Technology in and of itself cannot determine what actions are important to capture, what to notice about them, and how to make sense of them: “data” is not the same thing as “evidence” (p. 29).
The 2011 National Research Council report titled Learning Science through Computer Games and Simulations pointed out that, “the most important technical challenge to embedding assessment in simulations and games is how to make use of the rich stream of data and complex patterns generated as learners interact with these technologies to reliably and validly interpret their learning” (p. 99). Quellmalz et al. (2009) evaluated the assessment practices in recent research on science simulations in 79 articles and found that process data were rarely used for assessment purposes. Thus, there is a need to continue to study how to analyze complex and fine-grained process data in order to make inferences about students. This paper examines the use of Bayesian Knowledge Tracing and Dynamic Bayesian Networks for analyzing the process data of a digital game-based assessment, called Raging Skies (Chu and Chiang, 2018; Chu et al., 2018), for the purpose of estimating the probabilities of students’ mastery of the set of knowledge and skills measured by the game.
The current paper focuses on the scoring procedure for Raging Skies. The game was designed primarily as a formative assessment tool (Black and Willam, 1998) to evaluate students’ mastery of a set of knowledge and skills. By receiving formative feedback and practicing with multiple tasks, students are expected to improve their knowledge and skills during gameplay. The learning aspect of the game poses a challenge to the use of traditional measurement models (e.g., classical test theory or item response theory) in which student ability levels are assumed to stay the same during the assessment. As a result, we proposed to use Dynamic Bayesian Networks and Bayesian Knowledge Tracing to estimate and update student mastery of knowledge and skills for game- and simulation-based assessments. To evaluate the performances of these two models, classification consistency and accuracy were examined and compared based on a simulation approach (Almond et al., 2015). The rest of the paper is structured into five additional sections. Section 2 provides an overview of Raging Skies. Sections 3 and 4 briefly review the models of Dynamic Bayesian Networks and Bayesian Knowledge Tracing. Section 5 presents the methods and results of a pilot study in which student process data were collected while they were playing Raging Skies. In Section 6, we conclude the paper with a brief summary and a discussion of limitations and future directions.
2.
A
N OVERVIEW OFR
AGINGS
KIESA team of researchers and digital-game developers created a computer game-based assessment entitled Raging Skies to measure a set of knowledge and skill-based learner outcomes listed in Alberta’s Grade 5 science program-of-study under the Weather Watch unit (Alberta Education, 1996). The domain of science is often chosen as the content area for game-based assessments (e.g., Pellegrino and Quellmalz, 2010; Shute and Ventura, 2013; Stevens et al., 2013). This is mostly due to the increased emphasis of world science standards on scientific inquiry and problem-solving using technology as key competencies and proficiencies (International Society for Technology in Education, 2007; National Research Council, 2011). These competencies and proficiencies are challenging to assess with conventional item formats like multiple-choice and numerical response questions (e.g., OECD, 2010; Quellmalz et al., 2007).
2.1.STUDENT MODEL:TARGETED KNOWLEDGE AND SKILLS
The knowledge and skills measured by Raging Skies were chosen based on a review of the Weather Watch unit of Alberta’s Grade 5 science program of studies (Alberta Education, 1996). This unit has two general learning expectations: 1) students can “observe, describe and interpret weather phenomena; and relate weather to the heating and cooling of Earth's surface”; and 2) students can “investigate relationships between weather phenomena and human activity” (p. 27, Alberta Education, 1996). To make the assessment more focused and manageable, we decided to concentrate on the first general learning expectation for the targeted knowledge and skills measured by the game. Specifically, six weather-related knowledge outcomes were chosen as the measurement target of Raging Skies:
• Describe patterns of air movement that result when one area is warm, and another area is cool
• Describe and demonstrate methods for measuring wind speed • Describe and demonstrate methods for finding wind direction
• Describe and measure the amount of precipitation
• Identify some common types of clouds and relate them to weather patterns.
While these knowledge outcomes are specific to the Weather Watch unit, they form the basis for higher-level process skills related to scientific inquiry. The targeted skill-based outcomes primarily focus on observations and interpretations. Specifically, students can “record observations and measurements accurately, using a chart format” and “state an inference, based on results” (p. 24, Alberta Education, 1996). These skill-based outcomes are a subset of the learning expectations for the overarching competencies that are present throughout the program of studies.
2.2. TASK MODEL
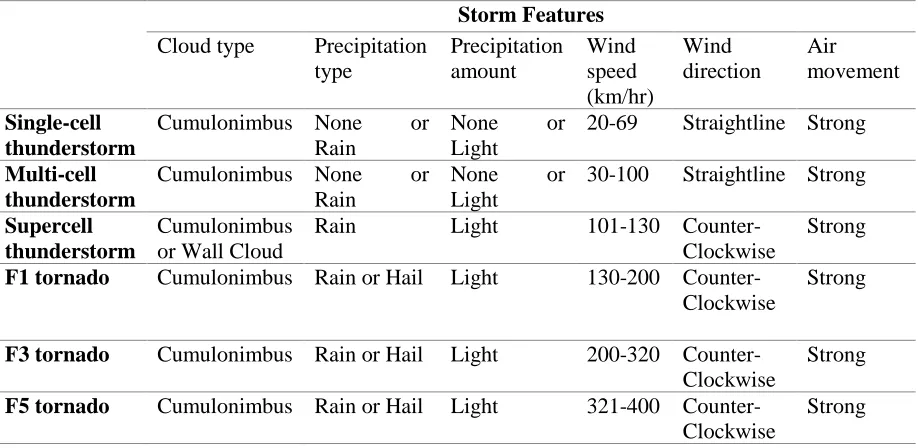
To develop assessment tasks, the types of scenarios in which people use the targeted knowledge and skills were first identified. Game scenarios need to be realistic and entertaining to students while ensuring the game mechanics allow assessment tasks to be seamlessly integrated. The chosen storyline was that of storm chasers who use various weather instruments (e.g., anemometer or wind vane) to collect information regarding the weather phenomenon, identify the type of storms, and report on them. In order for the assessment to provide the necessary opportunities to collect evidence of students’ performances for each student variable, the team of content experts and digital-game developers worked collaboratively to develop assessment tasks that can integrate the targeted knowledge and skill within the gameplay.
Table 1: Storm types and features for assessment tasks in Raging Skies.
Storm Features
Cloud type Precipitation type Precipitation amount Wind speed (km/hr) Wind direction Air movement Single-cell thunderstorm
Cumulonimbus None or Rain
None or Light
20-69 Straightline Strong
Multi-cell thunderstorm
Cumulonimbus None or Rain
None or Light
30-100 Straightline Strong
Supercell thunderstorm
Cumulonimbus or Wall Cloud
Rain Light 101-130 Counter-Clockwise
Strong
F1 tornado Cumulonimbus Rain or Hail Light 130-200 Counter-Clockwise
Strong
F3 tornado Cumulonimbus Rain or Hail Light 200-320 Counter-Clockwise
Strong
F5 tornado Cumulonimbus Rain or Hail Light 321-400 Counter-Clockwise
Strong
and type of air movement (light, medium, and strong). Table 1 lists all six types of storms and corresponding storm features.
2.3. EVIDENCE MODEL
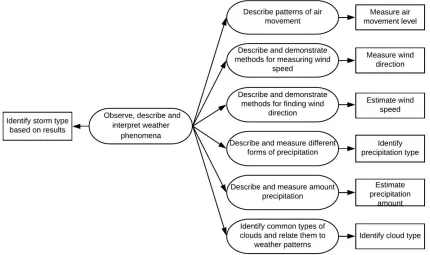
In the game, students are asked to collect information on six storm features which represent different aspects of the storm; each storm feature is purposefully designed to be connected to one of the specific skills. Therefore, students’ performance on these six observable variables is used to indicate their proficiency on the six specific skills measured by the game, which in turn serves as the indirect evidence of the general skill of observing, describing, and interpreting weather phenomena. Figure 1 depicts the observable variables constituting the evidence to support claims of student proficiency of the knowledge and skills measured by the game. Upon the completion of measuring all six storm features, students are asked to identify the storm type, which could serve as the direct evidence for inferences about the general skill of the game.
Figure 1: Evidence model of observable variables constituting the evidence to support claims of proficiency of student variables.
2.4.GAME DESIGN
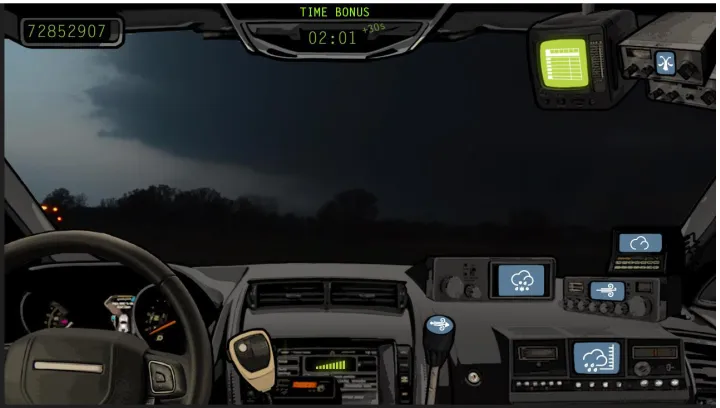
chasers. Their tasks are to use appropriate weather tools located on their vehicle to gather information on each of the storm features and identify the corresponding storm type. Figure 2 shows a diagram of the vehicle dashboard that players use throughout the game to access the tools for measuring storm features. Students may click on the icons on the dashboard to activate the different tools used to collect data regarding the weather outside of the vehicle. In order to keep students engaged and add a competitive element into the game to increase re-playability, a reward system with in-game monies is used that allows students to upgrade/customize their equipment.
To be challenging while creating an enjoyable experience for players, game activities should be designed at an optimal level of difficulty to prevent players from being either too bored or frustrated (Malone & Lepper, 1987). To accomplish this, Raging Skies tailors task difficulties to students’ performance level. The difficulty of each storm task was manipulated to be easy, moderate, or difficult, depending on the type of information students can access and the number of chances they have to get the storm correct. That is, each student is exposed to the same 11 storms in the game, but the difficulty of each storm could be different depending on students’ prior performance. For the easy difficulty level, students need to identify the cloud type among four options, and they have access to a cloud guide that provides them with real-world photos for each cloud type. Moreover, they can see the storm profiles directly next to their measurement in the storm log, and they get three chances to get a storm correct. For the medium difficulty level, students need to identify the cloud type among five options, and they have access to a cloud guide that provides them with real-world photos for each cloud type. Now students can see their measurements on one screen, but the storm profiles are available under a separate tab, and students get 2 chances to get a storm correct. For the most difficult level, the student has five options to choose from for cloud type and no cloud guide, students don’t have access to the storm profiles and only get to review their measurements in the storm log, and students get 2 chances to get a storm correct.
Figure 2: Screen capture of the vehicle dashboard from Raging Skies.
second task, also manipulated as an easy task, is presented to students. If students earn at least 60% of the available in-game cash for a storm on this storm task, they are routed to a more difficult storm. Alternatively, a weak performance on this storm task (i.e., they earn less than 60% of available in-game cash) would lead to the following task at the same difficulty level. That is, the difficulty of storm task administered next is based on students’ performance on previous storm tasks. This adaptive process continues throughout the assessment so that each student will have a customized experience that matches their performance. Throughout the assessment, students are presented with all eleven storms tasks so that enough evidence may be collected to ensure that reliable claims may be made regarding their performance.
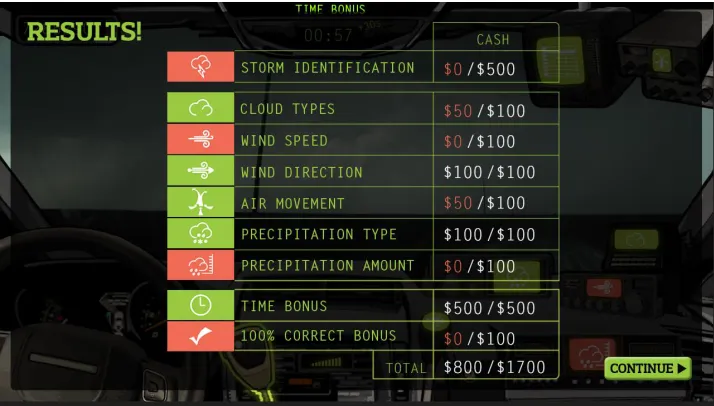
Figure 3: Screenshot of the feedback report students receive after a storm task.
2.5. FORMATIVE FEEDBACK
The amount of in-game money rewarded to students is designed to serve as an indicator of their performance during the storm task. As such, the amount of in-game money received by the student is a form of formative feedback regarding their performance in measuring the six different features of the storm and identifying the storm type during each storm task. An example of a student feedback report is provided in Figure 3. Student overall performance in identifying the storm type is presented first. The amount of $500 in-game money is rewarded if the student is able to correctly identify the storm type. Next, the report outlines student performance in measuring the six different elements of the storm, each worth of a maximum of $100 in-game money. If the student is correct at the first attempt, the maximum amount is rewarded; $50 in-game money is given if the student is correct at the second attempt. Extra bonus in-in-game money can be earned if a student is able to identify the storm within a specified time framework ($500) or if the student is able to successfully identify the storm type and all the storm features ($100). These two bonus items are intended to further increase student gameplay and engagement. In addition, storm tasks with a higher difficulty rating are associated with more in-game money. For example, students may receive a maximum of $1300 during an easy difficulty level storm task, but they may receive up to $1700 during a moderate difficulty level storm task.
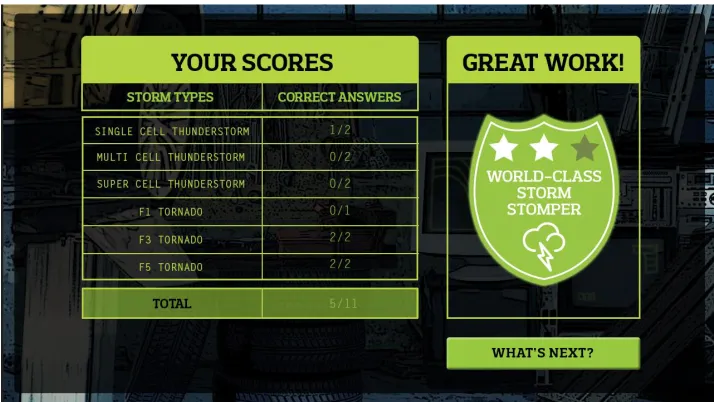
identifying the storm type after each task. In this example, the student correctly identifies the storm types for five out of the eleven storm tasks completed by the student.
Figure 4: Screenshot of the summative report students receive after the completion of all storm tasks.
The feedback report after each storm task as well as the summative report after the entire game are generated based on simple descriptive statistics of the observable variables listed in the evidence model. For example, the in-game money is a weighted sum of the values of individual observable variables. The final summative scores are frequency counts of the number of storms correctly identified by each student. If the teacher considers the game as primarily a complementary learning tool to help his/her students learn different types of storm and associated storm features, we consider these simple reports to be sufficiently informative and accurate. However, if the teacher would like to use the game as part of the classroom assessment for the grade 5 weather unit, a more rigorous scoring procedure that estimates student proficiency levels based on observable evidence collected by the game is needed.
3.
B
AYESIANK
NOWLEDGET
RACINGBayesian Knowledge Tracing has been intensively studied and used in the literature of intelligent tutoring systems to model students’ changing knowledge states during practice. To update the current state of mastering skill 𝑘, Bayesian Knowledge Tracing models the following four parameters:
𝑝(𝐿0𝑘) ― The initial probability of mastering skill 𝑘,
𝑝(𝑇𝑘) ― The probability of transitioning from non-mastery to mastery after an opportunity to apply skill 𝑘,
𝑝(𝑆𝑘) ― The probability of making a mistake when applying skill 𝑘 by a student who has mastered the skill, and
𝑝(𝐺𝑘) ― The probability of correctly applying skill 𝑘 by a student who hasn’t mastered the skill.
With the above parameters, the conditional probability of mastering skill 𝑘 at time 𝑡 given the student response to a task, either correct or incorrect, can be calculated, respectively, as follows:
𝑝(𝐿𝑡𝑘|𝑐𝑜𝑟𝑟𝑒𝑐𝑡) = 𝑝(𝐿𝑡−1𝑘)[1 − 𝑝(𝑆𝑘)]
𝑝(𝐿𝑡−1𝑘)[1 − 𝑝(𝑆𝑘)] + [1 − 𝑝(𝐿𝑡−1𝑘)]𝑝(𝐺𝑘)
𝑝(𝐿𝑡𝑘|𝑖𝑛𝑐𝑜𝑟𝑟𝑒𝑐𝑡) = 𝑝(𝐿𝑡−1𝑘)𝑝(𝑆𝑘)
𝑝(𝐿𝑡−1𝑘)𝑝(𝑆𝑘) + [1 − 𝑝(𝐿𝑡−1𝑘)][1 − 𝑝(𝐺𝑘)]
Thus, using the student’s actual response, the probability of mastering skill 𝑘 at time 𝑡 can be updated using the following equation:
𝑝(𝐿𝑡𝑘) = 𝑝(𝐿𝑡𝑘|𝑟𝑒𝑠𝑝𝑜𝑛𝑠𝑒) + 1 − [𝑝(𝐿𝑡𝑘|𝑟𝑒𝑠𝑝𝑜𝑛𝑠𝑒)]𝑝(𝑇𝑘)
For Raging Skies, each student completes multiple tasks, and each task asks the student to measure six different storm features and then identify the storm type based on these features. When considering the measurement of each storm feature as a subskill, the mastery of each subskill can be updated after the student makes a measurement of the storm feature for each storm task. The updated probability of mastering the subskill after the final task can be considered as the final estimate of the probability of student mastery of the subskill. The profile of the mastery of the subskills can provide important information about the strengths and weaknesses of student skills in the content area. To identify the storm type, students must consider all the storm features and make an overall judgment, which could serve as the evidence for the general skill of observing, describing, and interpreting the weather phenomenon. The probability of mastering the general skill based on student performance in identifying storm types can be estimated and updated using Bayesian Knowledge Tracing as well.
4.
D
YNAMICB
AYESIANN
ETWORKSprobabilistic graphical models to represent uncertain relations among a group of random variables (Jensen, 1996). In BNs, the conditional dependency and probability among random variables are estimated based on Bayesian inferences. Figure 5 presents a simple BN, in which random variables X, Y, and Z are graphically represented by the nodes in this directed acyclic graph (DGA), and the causal relationships between variables are represented by the directional edges. The joint distribution of all random variables can be expressed by the chain rule:
𝑃(𝑋, 𝑌, 𝑍) = 𝑃(𝑋|𝑍)𝑃(𝑌|𝑍)𝑃(𝑍), where 𝑃(𝑋|𝑍)𝑃(𝑌|𝑍) = 𝑃(𝑋, 𝑌|𝑍) given that X and Y are conditionally independent. If we consider Z as a cause and consider X and Y as its corresponding effects, we can use BNs to make a diagnosis (i.e., finding 𝑃(𝑍|𝑋) or 𝑃(𝑍|𝑌)) or make a prediction (i.e., finding 𝑃(𝑋|𝑍) or 𝑃(𝑌|𝑍)) by inferring their corresponding conditional distributions in the model. To estimate these conditional distributions, training data can be used by formularizing the problem as a maximum likelihood estimation as in other statistical models (e.g., Heckerman et al., 1995).
Figure 5: A simple Bayesian network with three nodes.
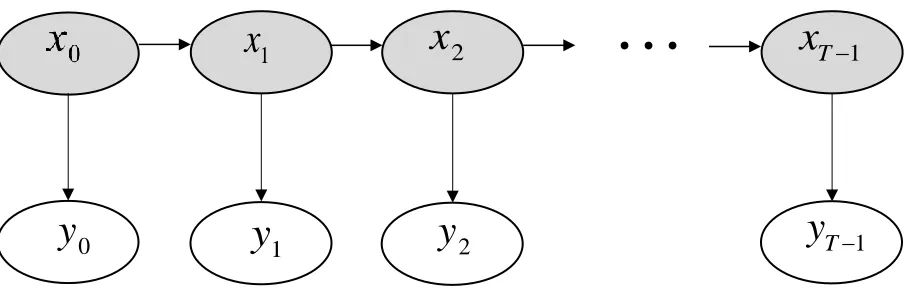
However, the above BN models cannot be used directly for events occurring over a period of time. In Dynamic Bayesian Networks (DBNs), the temporal dependencies between events are considered in making inferences of conditional probabilities. Figure 6 presents a simple DBN with a latent variable (represented by the shaded nodes) and an observed variable (represented by the blank nodes). Notably, there are T time slices in the model, which are interconnected by the temporal relations between the latent variables. Each time slice itself can be considered as a BN, and in this sense, the DBN is a set of interconnected BNs. The nodes and edges can be interpreted in the same manner as BNs. DBNs model the changing states of variables over time. The variable’s state at a given time slice is dependent on both the variable’s states at the previous time slice and the current states of other connected variables. According to Figure 2, for instance, the state of 𝑥𝑡 is dependent on both 𝑥𝑡−1 and 𝑦𝑡. As such, the DBN
formularizes the joint probability distribution over the latent variable 𝑋 = {𝑥0, … , 𝑥𝑇−1} and the
observed variable 𝑌 = {𝑦0, … , 𝑦𝑇−1} as:
𝑃(𝑋, 𝑌) = ∏ 𝑃
𝑇−1
𝑡=1
(𝑥𝑡|𝑥𝑡−1) ∏ 𝑃(𝑦𝑡|𝑥𝑡)
𝑇−1
𝑡=0
𝑃(𝑥0)
which consists of three sets of parameters: the prior state distribution 𝑃(𝑥0), the observation distribution 𝑃(𝑦𝑡|𝑥𝑡) indicating the dependence of the observed variable 𝑦 on the latent variables 𝑥 at time slice t, and the state transition distribution 𝑃(𝑥𝑡|𝑥𝑡−1) indicating how variable 𝑥 at time slice t are influenced by its states at the previous time slice (Mihajlovic and Petkovic, 2001). In DBNs, one is mostly interested in reasoning how latent variables change over time given the evidence of observed variables. This problem can be formularized as an inference problem of estimating the conditional distribution 𝑃(𝑋0𝑇−1|𝑌
0𝑇−1), where 𝑋0𝑇−1 =
{𝑥0, … , 𝑥𝑇−1} and 𝑌0𝑇−1= {𝑦0, … , 𝑦𝑇−1}.
Z
Figure 6: A simple DBN with a latent variable and an observed variable for T time slices.
5.
P
ILOT STUDY5.1.DATA
Raging Skies was piloted with Grade 5 students. In the pilot, a total of 505 students from 28 classrooms across a large metropolitan city in Canada were invited to play the game. Consent forms were obtained from all students and their parents. Student actions during the game were logged and saved for later analysis. However, 41 students did not have responses on either the pre-test, the post-test, or the online questionnaire. And four students’ hand-writing game ID numbers could not be matched on their log data files. Therefore, the log data of these students were removed, which resulted in a final sample of 460 students (male = 223, female = 213, other = 8, missing = 16). The final log data file for data analysis includes 182,891 observations of students’ gameplay actions.
5.2.DATA PREPROCESSING
To start, we preprocessed the log data in order to proceed with BKT and DBN analysis. Both procedures can model students’ responses at each step of solving a problem to update the mastery probabilities of each skill. Typically, each problem step corresponds to the use of one skill. In Raging Skies, the mastery probabilities of six subskills representing six different storm features, including wind direction, precipitation amount, cloud type, wind speed, precipitation type, and air movement, were estimated and updated each time the skill was used. In addition, students’ final decisions of storm types were used to estimate students’ overall ability to observe, describe, and interpret the weather phenomenon. In total, each storm task includes seven problem steps, and in each step, the mastery probability estimate of one of the seven skills is updated. In the game, there are 11 storms and 77 distinct problem steps. Thus, students have multiple opportunities to apply each skill. Students can start with any problem steps except that the decision of storm types, which is always the last step in each task. Thus, students have different sequences of problems steps for each storm task. For the six storm features, students can have two or three attempts to provide their answers, which leads to many “retry” actions in the data. However, the “retry” actions were removed from the data because BKT typically models the first attempts of solving a problem (Corbett and Anderson, 1994). We also removed all irrelevant actions (e.g., using reward money to upgrade equipment), which results in a log
1
x
x
2x
T−10
y
y
1y
2y
T−1file data of 47,199 observations for later analysis. Thereafter, we recoded each step as 1 or 2 (correct or incorrect) based on the match and mismatch between students’ responses and the answer keys. The final data for BKT modeling includes four columns: students’ anonymous ID numbers, step labels, skill labels, and step scores. The data processing was conducted with the R software (R Core Team, 2018).
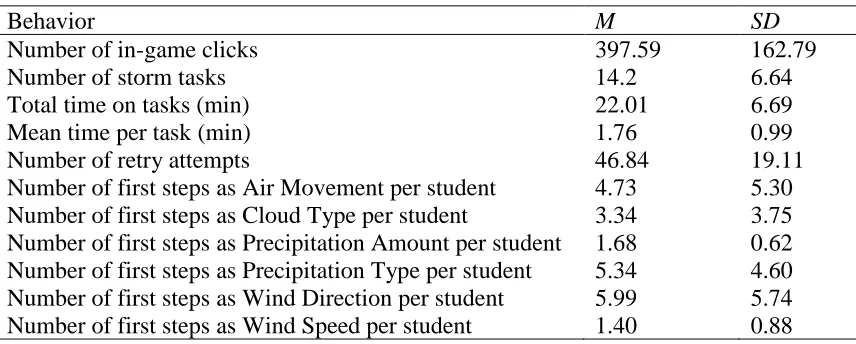
A descriptive analysis of students’ gameplay features was first conducted to gain a general understanding of students’ gameplay and learning behaviors. Table 2 provides the mean and standard deviation of each gameplay feature. Results show that the total number of clicks had large standard deviations, implying that students’ gameplay behaviors showed large variability. On average, students chase 14 storms, suggesting that students tended to play the game more than once. Moreover, students had about 47 retry attempts on average, which indicated that students often failed to correctly solve many problem steps on their first attempts. Given that students may take different sequences of problems steps for each storm task, Table 2 also displays the average number of times each storm feature was tackled by students as their first problem step during the game. Results show that students were more likely to choose wind direction, precipitation type, or air movement as their first steps. A possible reason is that these storm features are relatively straightforward, and students are more confident in identifying them correctly.
Table 2: Descriptive summary of in-game behaviors.
Behavior M SD
Number of in-game clicks 397.59 162.79
Number of storm tasks 14.2 6.64
Total time on tasks (min) 22.01 6.69
Mean time per task (min) 1.76 0.99
Number of retry attempts 46.84 19.11
Number of first steps as Air Movement per student 4.73 5.30 Number of first steps as Cloud Type per student 3.34 3.75 Number of first steps as Precipitation Amount per student 1.68 0.62 Number of first steps as Precipitation Type per student 5.34 4.60 Number of first steps as Wind Direction per student 5.99 5.74 Number of first steps as Wind Speed per student 1.40 0.88
5.3.BAYESIAN KNOWLEDGE TRACING ANALYSIS AND RESULTS
We applied the standard BKT model to train the data by the tool hmm-scalable (https://github.com/IEDMS/standard-bkt), which is a command line utility implemented in C/C++ for fitting BKT models to large datasets. For the model settings, the default values in the tool were retained. Specifically, the starting values of the four model parameters were set as follows: 𝑝(𝐿0𝑘) = .5 (the initial probability of mastering skill 𝑘), 𝑝(𝑇𝑘) = .4 (the probability
of transitioning from non-mastery to mastery after an opportunity to apply skill 𝑘), 𝑝(𝐺𝑘) = .2
(the probability of correctly applying skill 𝑘 by a student who hasn’t mastered the skill), and
𝑝(𝑆𝑘) = .2 (the probability of making a mistake when applying skill 𝑘 by a student who has
Table 3: Model parameters, mastery probability, and mastery ratio of students for each KC.
Skill 𝑝(𝐿0𝑘) 𝑝(𝑇𝑘) 𝑝(𝑆𝑘) 𝑝(𝐺𝑘) 𝑝̅𝑚𝑎𝑠𝑡𝑒𝑟𝑦𝑘 %𝑚𝑎𝑠𝑡𝑒𝑟𝑦𝑘
Wind Direction 0.500 0.090 0.093 0.300 0.821 0.815 Precipitation Amount 0.500 0.009 0.300 0.128 0.164 0.128 Cloud Type 0.500 0.018 0.300 0.195 0.412 0.367 Wind Speed 0.500 0.000 0.300 0.000 0.003 0.004 Precipitation Type 0.500 0.001 0.300 0.105 0.012 0.011 Air Movement 0.500 0.085 0.072 0.300 0.751 0.735 Overall skill 0.500 0.008 0.300 0.280 0.208 0.146
To fit the BKT model, we used 10-fold stratified cross-validation. Specifically, for each fold, students were randomly divided into 10 subgroups, of which nine groups were used for training, and one group was used for testing. Two commonly-used fit measures, root-mean-squared error (RMSE) and accuracy, were used for model evaluation. The RMSE and accuracy were averaged across 10 folds. A lower RMSE value and a higher accuracy value were indicators of good model-data fit. The 10-fold cross-validation results show that the standard BKT model fits the data with an acceptable RMSE of 0.39 and a good accuracy of 0.77. The four model parameters for each skill are presented in Table 3. Wind speed and precipitation type had the lowest transitioning parameters 𝑝(𝑇𝑘), indicating that the successive learning opportunities may not be
very helpful for improving students’ chance of mastering these two skills. Wind direction and air movement had the largest transitioning parameters, around 9%, indicating that each time students used these skills, their chance of mastering these skills increased by 9%. Regarding the slip parameter 𝑝(𝑆𝑘), except for wind direction and air movement, other KCs achieve its upper boundary, indicating that students are very likely to make a mistake when applying these skills even if they have mastered them. Moreover, wind speed has much lower guess parameter,
𝑝(𝐺𝑘) = .000, than other skills, indicating that it is almost impossible for students to identify the wind speed correctly by chance. The mean of students’ final estimated probability of skill
𝑘, 𝑝̅𝑚𝑎𝑠𝑡𝑒𝑟𝑦𝑘, and the percentage of students who have mastered skill 𝑘, %𝑚𝑎𝑠𝑡𝑒𝑟𝑦𝑘, are also reported in Table 3. Results suggested that the majority of students had mastered wind direction and air movement but relatively fewer students for other skills.
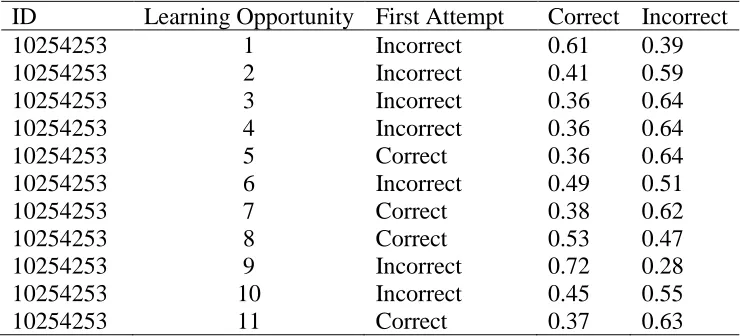
Table 4: Learning process of an example student while attempting the Air Movement outcome.
ID Learning Opportunity First Attempt Correct Incorrect
10254253 1 Incorrect 0.61 0.39
10254253 2 Incorrect 0.41 0.59
10254253 3 Incorrect 0.36 0.64
10254253 4 Incorrect 0.36 0.64
10254253 5 Correct 0.36 0.64
10254253 6 Incorrect 0.49 0.51
10254253 7 Correct 0.38 0.62
10254253 8 Correct 0.53 0.47
10254253 9 Incorrect 0.72 0.28
10254253 10 Incorrect 0.45 0.55
Based on the skill parameters and the student’s current response, BKT predicts the student’s probability of correctly answering the next question. For example, Table 4 demonstrates a student’s learning processes of the skill air movement and reports model-predicted probabilities during gameplay. It can be seen that at each learning opportunity, given whether the student produced a correct or incorrect response, the probability of a correct response for the next problem either increases or decreases. Students’ probabilities of mastery are updated along with these learning opportunities, and the correct rates of the last steps are used to calculate students’ final estimated probabilities of skill mastery.
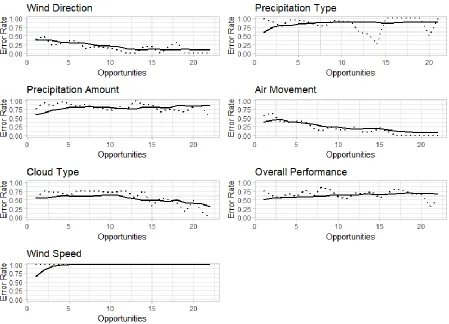
Figure 7: Learning curves for different skills by BKT.
Figure 7 plots the learning curves of individual skills in which the horizontal axis represents the learning opportunities, and the vertical axis represents the mean error rate. It can be seen that the BKT model fitted the data well given that the model-predicted error rates (represented by the solid lines) overlap the observed error rates (represented by the dotted lines). The error rates of wind direction, air movement, and cloud type decreased along with more learning opportunities. However, the error rates of wind speed and precipitation type and amount remained high regardless of the number of learning opportunities.
In addition, it might be helpful to provide clearer instructions at the beginning of the game by adding definitions of key terms, expectations, and requirements. Possibly adding worked examples or scaffolding may also assist students in better learning these skills.
5.4.DYNAMIC BAYESIAN NETWORKS ANALYSIS AND RESULTS
The DBN analysis was conducted using GeNIe, which is a free software for building graphical decision-theoretic models by the Decision Systems Laboratory at the University of Pittsburgh. GeNIe is a user-friendly development environment where the DBN model can be graphically constructed. In this study, the DBN structure was pre-established, and the model parameters were learned using the data of students’ first completion of the game. It should be noted that some students played the game more than once during the data collection. Given that the DBN analysis requires all the students to have the same number of time points, only data from the first completion of the game was used in the analysis. The model parameters were initialized by uniformization in learning. After learning, the model was tested on the same dataset to compare students’ real responses and the model-predicted responses.
The structure of the DBN used in this study is presented in Figure 8. In our study, students’ gameplay behaviors in chasing each storm could be modeled by a conventional BN. That is, for each storm, the six task steps of identifying air movement, cloud type, precipitation amount, precipitation type, wind direction and wind speed, and the final step of identifying storm type constitute the seven observed variables. Students’ latent skills underlying the six task steps and the final decision of storm types constitute the seven latent variables. In addition, we specify that students’ six task step skills affect their abilities of storm identification in the BN. Having one conventional BN for each of the 11 storms, we are able to construct a DBN to model the dependencies of students’ skills over the 11 storms. As we mentioned previously, a DBN is conventional BNs with additional temporal features, so there are 11 time slices in the DBN given the 11 storms. Specifically, in the DBN, we specify that each latent skill at time slice i affects the same skill at time slice i + 1, indicating that the posterior probability distributions of skills at time slice i are the inputs of their posterior probability distribution estimation at time slice i + 1. As such, the model is capable of modeling how students’ latent skills change with the increase of gameplay opportunities (i.e., the 11 storms). In Figure 8, the rectangle nodes represent all observed variables, and the round nodes indicate the latent variables. It should be noted that Figure 8 presents an integrated DBN of the 11 time-specific DBNs.
Figure 8: Structure of a Dynamic Bayesian Networks for Raging Skies (11 time slices).
A
M
WS
WD
CT
PA
PS
PT
Air Movement
Cloud Type
Precipitation Amount
Pick Storm
Precipitation Type
Wind
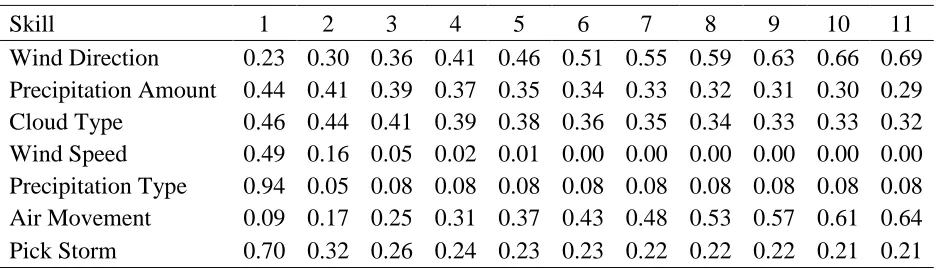
Table 5: Posterior mastery probability of each skill for each time slice estimated by DBN.
Skill 1 2 3 4 5 6 7 8 9 10 11
Wind Direction 0.23 0.30 0.36 0.41 0.46 0.51 0.55 0.59 0.63 0.66 0.69 Precipitation Amount 0.44 0.41 0.39 0.37 0.35 0.34 0.33 0.32 0.31 0.30 0.29 Cloud Type 0.46 0.44 0.41 0.39 0.38 0.36 0.35 0.34 0.33 0.33 0.32 Wind Speed 0.49 0.16 0.05 0.02 0.01 0.00 0.00 0.00 0.00 0.00 0.00 Precipitation Type 0.94 0.05 0.08 0.08 0.08 0.08 0.08 0.08 0.08 0.08 0.08 Air Movement 0.09 0.17 0.25 0.31 0.37 0.43 0.48 0.53 0.57 0.61 0.64 Pick Storm 0.70 0.32 0.26 0.24 0.23 0.23 0.22 0.22 0.22 0.21 0.21
Table 5 shows the posterior mastery probability of each skill for each time slice estimated by DBN. According to Table 5, wind direction and air movement showed the highest posterior mastery probabilities, 0.69 and 0.64, respectively. The posterior mastery probabilities of other skills stayed the same or decrease along with the increase of gameplay opportunities. Notably, precipitation type and wind speed showed extremely low mastery probabilities for most time slices, indicating that the gameplay contributed little to students’ learning and acquisition of these two skills.
The learning curves of individual skills from DBN analysis are shown in Figure 9. Again, we only modeled the first completion of the game using DBN, so the learning curves are presented for a total of 11 opportunities of applying each skill. It can be seen that the model-predicted error rates (represented by the solid lines) almost fully overlap the observed error rates (represented by the dotted lines), which indicates that the DBN model fitted the data very well. Similar to the learning curves by BKT, the error rates of wind direction and air movement decreased along with more learning opportunities, and wind speed and precipitation type and amount consistently showed high error rates for all learning opportunities.
5.5.CLASSIFICATION CONSISTENCY AND ACCURACY OF BKT AND DBN RESULTS
Figure 9: Learning curves for different skills by DBN.
Table 6: Classification accuracy and consistency indices calculated using pilot data.
Wind Direction
Precipitation Amount
Cloud Type
Wind Speed
Precipitation Type
Air Movement
Overall
BKT Accuracy 0.86 0.94 0.75 1.00 0.99 0.88 0.84
Consistency 0.58 0.88 0.38 1.00 0.97 0.50 0.72
DBN Accuracy 0.81 0.74 0.78 1.00 0.92 0.83 0.80
Consistency 0.46 0.46 0.40 1.00 0.85 0.43 0.63
6.
D
ISCUSSIONThis paper explores the use of Bayesian Knowledge Tracing (BKT) and Dynamic Bayesian Networks (DBNs) for analyzing student process data in game-based assessments. We argue that it is important to employ and compare multiple analytic models for the process data from game-based assessments given that the field is still in its infancy and it is not clear how to best analyze this new assessment data type in extracting evidence of student knowledge and skills. We find that BKT and DBNs are especially useful for game-based assessments because they both allow the state of student mastery of knowledge and skills to change over the course of the game. This is desirable as game-based assessments are typically considered as a formative learning and assessment tool with the potential to help students improve their skills during the gameplay.
To demonstrate the use of BKT and DBNs and evaluate their performance, process data from a game-based assessment, called Raging Skies, was analyzed with the two models. Raging Skies measured a set of knowledge and skills related to an elementary school science program of study. The assessment tasks were designed to be dynamic and interactive, as well as to mimic real-life tasks. Formative feedback was provided to students during the assessment to identify specific areas for further improvement. BKT and DBN proved to be valuable and informative for analyzing the process data of Raging Skies. The two models not only updated students’ mastery levels during the game but also provide insights regarding student learning trajectories. This type of information serves as indirect validity evidence, which can reveal problematic aspects of assessment tasks and improve game design accordingly. To evaluate the performance of the two models, the classification consistency and accuracy of BKT and DBN results were estimated using a simulation approach (Almond et al., 2015). BKT was found to outperform DBN for a majority of skills assessed by Raging Skies. A possible explanation is that DBN represents a more complex model with more model parameters. For example, the distribution of the observed variable 𝑦 on the latent variables 𝑥, 𝑃(𝑦𝑡|𝑥𝑡), and the state transition distribution of skill mastery, 𝑃(𝑥𝑡|𝑥𝑡−1), need to be estimated for each time slice. For a game with many tasks and levels, the DBN model can become very complex. Given that Raging Skies has a total of 11 tasks, our sample size may not be adequate for estimating all the DBN model parameters accurately and reliably. In comparison, BKT assumes that model parameters do not vary with time, which represents a much simpler model and requires a smaller sample size, which might explain why the classification accuracy and consistency of BKT results were found to be relatively higher compared to those of DBN. However, the finding of BKT outperforming DBN may not be generalizable to other games and situations. Future studies are needed to investigate whether the results of the current study can be replicated under other data conditions.
identify areas that need additional instructional and learning activities for the student. However, the effectiveness of this type of feedback is an empirical question, which requires a further experimental study with additional data collection and analysis.
Finally, BKT and DBT work well with games in which each step of the game can be scored right or wrong. However, for more open-ended tasks that allow for multiple processes and solutions, data may not be as well-structured in the sense of no clear right or wrong solution for each step. Models designed for well-structured student responses may not be directly applied. Methods of analyzing and interpreting unstructured data must be developed and examined to derive valid, fine-grained inferences about student learning and problem-solving. Possible solutions to this challenge will greatly enhance the practical use of game-based assessments that aim to be authentic and measure higher-level skills in different assessment contexts.
R
EFERENCESALBERTA EDUCATION 1996. Science (elementary). Alberta Education.
http://www.education.alberta.ca/media/654825/elemsci.pdf
ALMOND, R. G., MISLEVY, R. J., STEINBERG, L. S., WILLIAMSON, D. M., AND YAN, D. 2015. Bayesian Networks in Educational Assessment. Springer, New York.
AMERICAN EDUCATIONAL RESEARCH ASSOCIATION [AERA], AMERICAN PSYCHOLOGICAL ASSOCIATION [APA], AND NATIONAL COUNCIL ON MEASUREMENT IN EDUCATION [NCME]. 2014. Standards for Educational and Psychological Testing. Author, Washington, DC.
BARAB, S. A., GRESALFI, M. S., AND INGRAM-GOBLE, A. 2010. Transformational play: Using games to position person, content, and context. Educ. Res. 39, 525–536.
BEHRENS, J. T., MISLEVY, R. J., DICERBO, K. E., AND LEVY, R. 2012. Evidence centered design for learning and assessment. In Technology-based Assessments for 21st Century Skills: Theoretical and Practical Implications from Modern Research, M. Mayrath, J. Clarke-Midura, D. Robinson, and G. Schraw, Eds. Information Age Publishers, Charlotte, NC, 371–386.
BENNETT, R. E., PERSKY, H., WEISS, A. R., AND JENKINS, F. 2007. Problem solving in technology-rich environments: A report from the NAEP technology-based assessment project (NCES 2007–466). U.S. Department of Education. National Center for Education Statistics, Washington, DC. http://nces.ed.gov/nationsreportcard/pubs/studies/2007466.asp
BERTLING, M., JACKSON, G., ORANJE, A., AND OWEN, V. 2015. Measuring argumentation skills with game-based assessments: Evidence for incremental validity and learning. In C. Conati, N. Heffernan, A. Mitrovic, & M. Verdejo (Eds.), Proceedings of the 17th International Conference on Artificial Intelligence in Education. Springer International, New York, NY, 545-549.
BLACK, P., AND WILIAM, D. 1998. Inside the black box: Raising standards through classroom assessment. Phi Delta Kappan, 80, 139– 144.
CHU, M-W., AND CHIANG, A. 2018. Raging skies: Development of a digital game-based science assessment using evidence-centered game design. Alta. J. Sci. Educ. 45, 37–47.
CHU, M-W., ASTON, R., CUI, Y., SHOJAEE, N., AND BAWEL, B. 2018. Development of a digital
CORBETT, A. T., AND ANDERSON, J. R. 1994. Knowledge tracing: Modeling the acquisition of procedural knowledge. User Model. User-adapt. Interact. 4, 253–278.
DICERBO, K. (2017). Building the evidentiary argument in game-based assessment. Journal of Applied Testing Technology, 18, 7-18.
ERCIKAN, K. AND PELLIGRINO, J.W. (2017). Validation of score meaning using examinee response processes for the next generation of assessments. Routledge, New York. FORSYTH, C. M., JACKSON, G. T., HEBERT, D., LEHMAN, B., INGLESE, P. AND GRACE,L. (2017).
Striking a balance: User-experience and performance in computerized game-based assessment. In R.Baker, E. Andre, X. Hu, T. Rodrigo, B. du Bouley. The Proceedings of the International Conference on Artificial Intelligence in Education, LNCS, Springer- Verlag, 502-505.
GEE, J. P. (2007). Good Videogames + Good Learning: Collected Essays on Videogames, Learning and Literacy. Peter Lang Publishing, New York.
HABGOOD, J. M.P., AND AINSWORTH, S. E. (2011). Motivating children to learn effectively: exploring the value of intrinsic integration in educational games. Journal of the Learning Sciences, 20, 2, 169-206.
HECKERMAN, D., GEIGER, D., AND CHICKERING, D. M. 1995. Learning Bayesian networks: The combination of knowledge and statistical data. Mach. Learn. 20, 197–243.
INTERNATIONAL SOCIETY FOR TECHNOLOGY IN EDUCATION 2007. The National Educational Technology Standards and Performance Indicators for Students. ISTE, Eugene, OR. JENSEN, F. V. 1996. An Introduction to Bayesian networks. University College London Press,
London.
LEPPER, M. R., AND MALONE, T. W. (1987). Intrinsic motivation and instructional effectiveness in computer-based education. In R. E. Snow & M. J. Farr (Eds.), Aptitude, Learning, and Instruction: Vol. 3. Cognitive and Affective Process Analysis. Erlbaum, Hillsdale, NJ, 255-286.
MALONE, T. W., AND LEPPER, M. R. (1987). Making learning fun: A taxonomy of intrinsic motivations for learning. In R. E. Snow & M. J. Farr (Eds.), Aptitude, Learning, and Instruction: Vol. 3. Cognitive and Affective Process Analysis. Erlbaum, Hillsdale, NJ, 223-253.
MIHAJLOVIC, V., AND PETKOVIC, M. 2001. Dynamic Bayesian Networkss: A State of the Art.
https://ris.utwente.nl/ws/portalfiles/portal/27679465/0000006a.pdf
MILLIS, K., FORSYTH, C.M., WALLACE, P., GRAESSER, A.C., AND TIMMINS, G. 2016. The impact of game-like features on learning from an intelligent tutoring system. Technology,
Knowledge and Learning, 22, 1-22.
MISLEVY, R. J. 2006. Cognitive psychology and educational assessment. In Educational
Measurement (4th ed.), R. L. Brennan Ed. American Council on Education/Praeger, Westport, CT, 257–305.
MISLEVY, R. J., ALMOND, R. G., AND LUKAS, J. 2003. A brief introduction to Evidence-Centered Design (Research Report No. RR-03-16). Educational Testing Service.
https://www.ets.org/Media/Research/pdf/RR-03-16.pdf
MURPHY, K. P. 2002. Dynamic Bayesian Networks: Representation, Inference, and Learning. Ph.D. dissertation. University of California, Berkeley, CA.
NATIONAL RESEARCH COUNCIL. 2011. Learning Science through Computer Games and Simulations. National Academies Press, Washington, DC.
OECD. 2010. PISA 2009 Results: What Students Know and Can Do – Student Performance in Reading, Mathematics and Science (Volume I). PISA, OECD Publishing.
http://dx.doi.org/10.1787/9789264091450-en.
PELLEGRINO, J. W. AND QUELLMALZ, E. S. 2010. Perspectives on the integration of technology and assessment. J. Res. Tech. Educ. 43, 119–134.
QUELLMALZ, E. S., KREIKEMEIER, P., DEBARGER, A. H., AND HAERTEL, G. 2007. A study of the alignment of the NAEP, TIMSS, and New Standards Science Assessments with the inquiry abilities in the National Science Education Standards. Paper presented at the Annual Meeting of the American Educational Research Association, Chicago, IL.
QUELLMALZ, E. S., TIMMS, M. J., AND SCHNEIDER, S. A. 2009. Assessment of student learning in science simulations and games. National Research Council, Washington, D.C.
R CORE TEAM. 2018. R: A language and environment for statistical computing. R Foundation for Statistical Computing, Vienna, Austria.
RIEBER, L. 1996. Seriously considering play: Designing interactive learning environments based on the blending of microworlds, simulations, and games. Education and Technology Research & Development, 44, 42-58. Doi: 10.1007/BF02300540
SHUTE, V. J., AND VENTURA, M. 2013. Measuring and supporting learning in games: Stealth assessment. Massachusetts Institute of Technology Press, Cambridge, MA.
http://myweb.fsu.edu/vshute/pdf/white.pdf
STEVENS, R., BEAL, C. R., AND SPRANG, M. 2013. Assessing students’ problem solving ability and cognitive regulation with learning trajectories. In International Handbook of