Influence of PITA LOAN Information System on Telesales
Personal Loan Performance Using Technology Acceptance Model
Pelita Eka Yahya*, Heny Oktama Sejati**, Ahmad Jurnaidi Wahidin***
*( Faculty of Computer Science, , Budi Luhur University, Indonesia) **( Faculty of Computer Science, , Budi Luhur University, Indonesia) ***( Faculty of Computer Science, , Budi Luhur University, Indonesia)
---
************************
---Abstract:
At the beginning of the development of telesales still using the manual with armed with customer and telephone database, with the semi-manual work is a lot of human error, so it needs to be further observation about the system that has been built so that it can be in accordance with company expectations. This study uses a conceptual framework developed by Davis et al in 1989 regarding perceived ease of use, perceived usefulness, attitude toward using, and behavioral intention to use. The sampling technique using Nonprobability Sampling by distributing questionnaires to thirty two (32) respondents with 100% questionnaire return rate, this research also uses the concept of Technology Acceptance Model (TAM) framework and using independent variable that is suitability of the task, and testing this research using technique Confirmatory Factor Analysis with the help of SPSS software as data processing media, and data analysis using Partial Least Square approach. The results showed Perceived Usefulness (PU) as much as 32 respondents with an average value of 12.75 and a standard deviation of 1.685 and a varience of 2.839. Perceived Ease of Use (PEOU) with an average value of 12.59 and a standard deviation of 1.847 and a varience of 3.410. Attitude Toward Using (ATU) with an average value of 8.25 and a standard deviation of 0.803 and a varience of 0.645. Behavioral Intention To Use (BITU) with an average grade of 9.94 and a standard deviation of 0.564 and a varience of 0.319. Total suitability of user tasks with an average value of 5.34 and standard deviation of 1.181 and variance 1.394. Based on the results of 32 respondents of telesales personal loan staff who act as end-users, when viewed in terms of age of respondents, the age between 21-25 years assumes that the use of Pita Loan System does not have an impact on their performance, age between 26-35 years assume that there are only a few positive aspects of using the Pita Loan System, and over 35 years of age argue that the only positive value is in the ease of use.
Keywords — Technology Acceptance Model, Pita Loan Information System, Job Fit, Perceived Usefulness, Perceived Ease of Use, Attitude Toward Using, Behavioral Intention To Use.
---
************************
---I. INTRODUCTION
Currently, the banking industry has been using computerized systems including marketing of banking products and services, one of which is personal loan product or commonly abbreviated as
KTA. KTA's current product offerings are not only through brochures or direct sales that are commonly placed in every branch, but the banks are now more active in offering by phone or known as telesales.
At the beginning of its development, telesales still use manual way with armed with customer
database contained in computer each sales and telephone manual. By way of semi-manual work is a lot of human error, so built an information system that allows telesales to make phone calls with customers who are in the database just by pressing a dial button on the computer. However, it is necessary to observe further about the system that has been built, whether in accordance with the needs of the user in this case telesales, so it can be in accordance with the company's expectations of information systems built can positively affect the performance of telesales.
II. THEORETICALBASIS
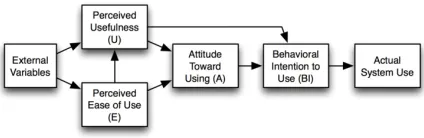
In this study modification of the conceptual framework developed by Davis et al in 1989 on perceived ease of use, perceived usefulness, attitude towards using and behavioral intention to use).
Fig. 1 Concept Framework TAM
A. Perceived Usefulness
Perceived usefulness (perceived usefulness) is a level where a person believes that the user of a particular system will improve the work performance of that person. Based on the definition is defined that the usefulness of the use of ICT can improve performance, work performance of people who use it. Thompsonet. al (1991) concluded the benefits of information technology is a benefit expected by users of information technology to carry out the task. Thompson (1991) also mentions that an individual will use ICT if the person knows the benefits or uses have a positive effect on their use.
According to Chin and Todd (1995) usefulness can be divided into two categories, among others (1) Utilization with the estimate of one factor, (2)
benefit with the estimation of two factors (usefulness and effectiveness). The dimensions of each are grouped as follows:
1) Utilization includes dimensions: making job easier, usefull, increasing productivity.
2) Effectiveness includes dimensions : increase effectiveness (enchance my effectiveness), develop job performance (improve my job performance).
B. Perceived Ease of Use
Davis (1989) defines ease of use (perceived ease ofuse) is a level where one believes that the use of a particular system can reduce one's effort in doing something. According to Goodwin (1987) and Silver (1988) in Maskur (2005), the intensity of use and interaction between users with the system can indicate the level of ease of use.
Davis (1989) provides some indicators of ease of use of IT include; (1) The computer is very easy to learn, (2) The computer does as easily as desired by the user (3) The user's skill will be increased by using the computer (4) The computer is very easy to operate. Iqbaria study findings (1994) prove that IT is used not absolutely because of social pressure, so it can be concluded that the use of IT is not because of the element of pressure, but because it is easy to use.
C. Attitude Toward Using
Attitude on the use of something according to Aakers and Myers (1997) is the attitude of liking or disliking the use in a product. is the attitude of liking or disliking of a product can be used to predict the behavior of one's intentions in using a product or not using it. Attitude toward the use of technology (attitude toward using technology), is defined as the evaluation of the user about his interest in using teknoology (Davis, 1989).
D. Behavioral Intention to Use
user's attention to the technology, such as the desire to add a supporting peripheral, the motivation to keep using, and the desire to motivate other users. Arief Hermawan (2008) in Suseno (2009) defines behavioral interest in using technology (behavioral intention to use) as a person's interest (desire) to perform certain behaviors.
E. Actual System Use
The actual usage is the real condition of system usage (Davis, 1989). Individuals will be content to use the system if they believe that the system is easy to use and can improve productivity, which is reflected in the real conditions of use (Natalia Tangke, 2004). Form of measurement of actual use (actual system usage) is the frequency and duration of time of use against ICT. The actual use of technology, measured by the amount of time used to interact with the technology and the frequency of use of the technology.
III. METHODOLOGYANDRESEARCH
DESIGN
A. Sample Selection
Sampling technique used is to use Nonprobability Sampling because not all the population in the room telemarketing can be sampled. The nonprobability sampling is used and to be more specific, this study uses a quota sampling form by determining samples from existing telemarketing populations and having jobdesk to market a cash loan product or personal loan, up to the desired quota amount.
Method of calculating the number of samples in this study using Krejcie and Morgan methods listed in a table.
TABLEI KREJCIE AND MORGAN METHOD
Populati on (N)
Sample (n)
Populati on (N)
Sample (n)
Populati on (N)
Sample (n)
10 10 220 140 1200 291
15 14 230 144 1300 297
20 19 240 148 1400 302
25 24 250 152 1500 306
30 28 260 155 1600 310
35 32 270 159 1700 313
40 36 280 162 1800 317
45 40 290 165 1900 320
50 44 300 169 2000 322
55 48 320 175 2200 327
60 52 340 181 2400 331
65 56 360 186 2600 335
70 59 380 191 2800 338
75 63 400 196 3000 341
80 66 420 201 3500 346
85 70 440 205 4000 351
90 73 460 210 4500 354
95 76 480 214 5000 357
100 80 500 217 6000 361
110 86 550 226 7000 364
120 92 600 234 8000 367
130 97 650 242 9000 368
150 108 750 254 15000 375
160 113 800 260 20000 377
170 118 850 265 30000 379
180 123 900 269 40000 380
190 127 950 274 50000 381
200 132 1000 278 75000 382
210 136 1100 285 1000000 384
B. Data Collection
Methods of data collection through the distribution of questionnaires to respondents telesales personal loan employees who use software Pita Loan System, the questionnaire will be directly in between the respondents and for the grace period of the questionnaire will be determined.
C. Analysis and Testing Techniques
This research uses the modification of TAM concept framework as well as using independent variable that is suitability of task.
Fig. 2 Concept Research Framework
Testing using Confirmatory Factor Analysis technique with the help of SPSS software as data processing media. Data analysis using Partial Least Square approach.
Factor Loading on Kaiser-Mayer-Olkin Measure of Sampling Adequacy used in this study is> 0.50. Test reliability using Cronbach Alpha technique with value> 0.70 or if more :
1) If alpha> 0.90 then reliability is perfect
2) If the alpha is between 0.70 - 0.90 then the reliability is high
3) If the alpha is between 0.50 - 0.70 then the reliability is moderate
4) If alpha <0.50 then reliability is low
The suitability testing model uses linear regression analysis.
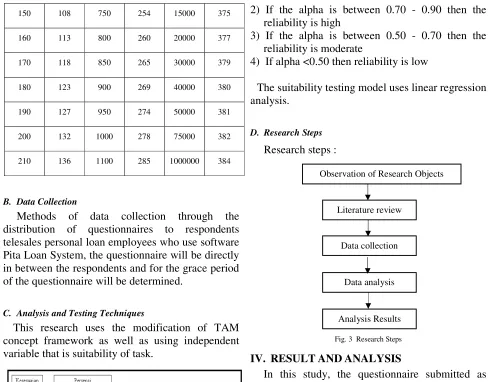
D. Research Steps
Research steps :
Fig. 3 Research Steps
IV. RESULTANDANALYSIS
In this study, the questionnaire submitted as many as thirty two (32) respondents, the questionnaire returned as many as thirty two (32) questionnaires, so because there is no questionnaire that is flawed or incomplete so that all questionnaires qualify to be processed. So the return rate of the questionnaire of the respondents is 100% the questionnaire has returned all of its. Then the return rate of the questionnaire as a whole is 100%. More data can be seen in the following table:
TABLEIII DETAIL SUMMARY OF QUESIONER
Number of respondents
Number of questionnai res in spread
Number of questionnai
res returned
Questionnaire retrieval level
Questionnai re was dropped /
damaged
Questionnai re used
32 32 32 100% 0 32
Total 32 32 100% 0 32 Observation of Research Objects
Literature review
Data collection
Data analysis
In this study there are some characteristics of respondents, among others by gender, age, and education last.
TABLEIIIII
RESPONDENCES CATEGORY BASED ON SEX FREQUENCY
Gender Number of Respondents (people)
Percentage (%)
Man 13 40,6 %
Woman 19 59,4 %
Total 32 100 %
TABLEIVV
RESPONDENCES CATEGORY BASED ON AGE FREQUENCY
Age Number of Respondents (people)
Percentage (%)
21 – 25 years 8 25 %
26 – 30 years 15 46,9 %
31 – 35 years 6 18,8 %
> 35 years 3 9,4 %
Total 32 100 %
TABLEV
RESPONDENCES CATEGORY BASED ON
Duration of Work (years)
Number of Respondents (people)
Percentage (%)
1 – 2 tahun 12 37,5 %
3 – 4 tahun 15 46,9 %
5 tahun 5 15,6 %
Total 32 100 %
A. Statistic Analysis
TABLEVI
DESCRIPTIVE STATISTIC ANALYSIS
Variabel Min Max Sum Mean St. Deviation
Varien ce
Sum PU 9 15 408 12,75 1,685 2,839
Sum PEOU 7 15 403 12,59 1,847 3,410
Sum ATU 7 10 264 8,25 0,803 0,645
Sum BITU 9 11 318 9,94 0,564 0,319
Sum JF 3 7 171 5,34 1,181 1,394
Total 32
The table above shows that the total perception of users on the use (PU / Perceived Usefulness) as many as 32 respondents and have a minimum of 9, and maximum 15, the number 408, with a mean value of 12.75 indicates that the respondents rate the ribbon loan system something quite useful for them. The standard deviation value shows a deviation of 1.685 from the mean of respondents' answers to questions about the user's perception of usability of 12.75 and the varience of 2.839.
Total Perceived User Perceptions of Ease of Use (PEOU / Perceived Ease of Use) are 32 respondents and have minimum result of 7 and maximum result 15, total 403 with mean value equal to 12,59 and deviation standard equal to 1,847 and varience 3,410. With an average value (mean) of 12.59 can be said that respondents feel ribbon loan system is quite easy for them to use.
Total perception of attitudes of users (ATU / Attitude Toward Using) as many as 32 respondents and have a minimum of 7, and a maximum of 10, the number 264, with an average value of 8.25 indicates that respondents rate band loan system less they can receive . The standard deviation value shows a deviation of 0.803 from the mean of respondents' answers to questions about user attitude perceptions of 8.25 and varience of 0.645.
Total perception of interest in behavior (BITU / Behavioral Intention to Use) as many as 32 respondents and have a minimum of 9, and a maximum of 11, the number 318, with an average value of 9.94 indicates that the respondents rate band loan system interesting enough they use. The standard deviation value shows a deviation of 0.564 from the mean of respondents' answers to questions about the user's perception of behavioral intention to use of 9.94 and the varience of 0.319.
suitability of the user's task in using the ribbon loan system of 5.34.
B. Test Validity
In this research, the statement is valid if it has loading factor> 0,349.
TABLEVII TEST VALIDITY
Statement
The value of
r count
R value
of table Information
Variable Utilization
statement 1 0,417 0,349 Valid
Variable Utilization
statement 2 0,665 0,349 Valid
Variable Utilization
statement 3 0,707 0,349 Valid
Variable Utilization
statement 4 0,712 0,349 Valid
Variable Utilization
statement 5 0,743 0,349 Valid
Variable Utilization
statement 6 0,707 0,349 Valid
Variable Utilization
statement 7 0,665 0,349 Valid
Variable Utilization
statement 8 0,602 0,349 Valid
Variables Attitude User
statements 9 0,669 0,349 Valid
Variables Attitude User
statements 10 0,197 0,349 Invalid
Variables Attitude User
statements 11 -0,249 0,349 Invalid
Interests Variables
Behavior statements 12 0,002 0,349 Invalid
Interests Variables
Behavior statements 13 0,254 0,349 Invalid
Interests Variables
Behavior statements 14 0,358 0,349 Valid
Variables Task Complianc
15 0,657 0,349 Valid
Variables Task Complianc
16 0,803 0,349 Valid
From the table above is known that there are some data that is not valid, that is the data number 10, 11, 12 and 13 then the data must be issued so that all data is valid, so :
TABLEVIII TEST VALIDITY
Statement
The value of
r count
R value
of table Information
Variable Utilization
statement 1 0,417 0,349 Valid
Variable Utilization 0,665 0,349 Valid
statement 2 Variable Utilization
statement 3 0,707 0,349 Valid
Variable Utilization
statement 4 0,712 0,349 Valid
Variable Ease statement 5 0,743 0,349 Valid
Variable Ease statement 6 0,707 0,349 Valid
Variable Ease statement 7 0,665 0,349 Valid
Variable Ease statement 8 0,602 0,349 Valid
Variables Attitude User
statements 9 0,669 0,349 Valid
Interests Variables
Behavior statements 14 0,358 0,349 Valid
Variables Task Complianc15 0,657 0,349 Valid Variables Task Complianc16 0,803 0,349 Valid
C. Test Reliability
In this study using alpha cronbach as for its value as follows :
1) If alpha> 0.90 then reliability is perfect
2) If the alpha is between 0.70 - 0.90 then the reliability is high
3) If the alpha is between 0.50 - 0.70 then the reliability is moderate
4) If alpha <0.50 then reliability is low
TABLEIX TEST RELIABILITY
Variables
The value of Cronbach's
Alpha
Reliable
Variable Utilization statement 1 ,886 High
Variable Utilization statement 2 ,878 High
Variable Utilization statement 3 ,869 High
Variable Utilization statement 4 ,871 High
Variable Ease statement 5 ,871 High
Variable Ease statement 6 ,869 High
Variable Ease statement 7 ,878 High
Variable Ease statement 8 ,878 High
Variables Attitude User
statements 9 ,872 High
Interests Variables Behavior
statements 14 ,888 High
Variables Task Complianc 15 ,878 High
Variables Task Complianc16 ,868 High
D. Model Conformity Test
In this study using simple linear regression because there are independent variables only one (1), namely the suitability of tasks and dependent variables (ease of use, usability, user attitude, and interest in behavior.
ribbon loan system affect the performance of telesales.
TABLEX DATA QUESTIONNAIRE
Nu mb.
Total Perceived Usefulness
Total Perceived
Ease of Use
Total Attitude Toward Using
Total Behavioral
Intention To Use
Total Task Compliance
1 12 13 3 3 5
2 11 11 3 3 6
3 10 8 2 3 3
4 13 13 3 3 7
5 14 13 3 3 6
6 9 10 3 3 3
7 13 14 4 3 7
8 13 14 4 4 5
9 13 14 4 4 6
10 14 14 4 4 4
11 14 13 3 3 7
12 13 13 4 4 5
13 13 13 3 3 6
14 14 14 4 4 6
15 15 14 3 3 7
16 12 11 3 3 5
17 14 12 3 3 5
18 14 14 4 4 6
19 11 11 3 3 3
20 15 15 4 4 5
21 14 14 3 3 7
22 12 13 3 3 5
23 15 15 4 3 6
24 14 14 3 4 5
25 12 11 3 4 5
26 13 14 4 4 6
27 9 7 2 3 3
28 11 12 4 3 5
29 13 12 4 3 6
30 10 11 3 3 5
31 13 13 3 3 5
32 15 13 4 3 6
Hypothesis Testing Influence Independent Variables Job Fit Dependent Variables Perceived Usefulness
TABLEXI MODEL SUMMARY
Model R R
Square
Adjusted R Square
Std. Error of the Estimate
1 ,661 ,437 ,418 1,286
a. Predictors: (Constant), total_jf
b. Dependent Variable: total_pu
The value of R square (R²) in the table above is 0.437. The number R Square is also called coefficient of determination. The amount of coefficient of determination is 0,437 or equal to
43,7%. That number means, as big as 43,7% expediency level that happened, can be explained by using task suitability variable. While the rest of 56.3% (100% - 43.7%) should be explained by other factors causing factors. In other words the magnitude of the effect of the suitability of task to benefit is 43.7% while the rest of 56.3% influenced by other factors outside this regression model.
The standard error value of the estimate (SEE) in the table is 1.286. this value will be used to assess the feasibility of predictors (independent variables) in relation to dependent variables. The rule is that if the value of SEE < deviation standard value, then the predictor used to predict the dependent variable is feasible. In the output table above, the value of SEE is 1.286 <the standard deviation value for the dependent variable is 1,685. So it can be concluded that the free variable suitability of the task is feasible to be a predictor for the dependent variable benefit.
TABLEXII COEFFICIENT
Model
Unstandardized
Coefficients
Std.
Coeffi
cients t Sig.
B Std.
Error Beta
1 (Constant) 7,711 1,069 7,211 ,000
2 Total
Variables
Task
Compliance
,943 ,196 ,661 4,822 ,000
a. Dependent Variable: total_pu
one level, then the usability level increases by 0.943.
The value of the SPSS calculation results listed in column t in the above table is the variables associated with the linear variables with the dependent variable of benefit is 4.822. To calculate the t table / value of table t can be done by determining the significance level of 0.05 and degrees fredoom (DF) with the provision, DF = N-2, so DF = 32-2 = 30, then the provision obtained for t table of : 1.697.
The calculation result with SPSS shows t otal equal to 4,822> t table equal to 1,697, thus its result is Ho rejected and Haun, meaning there is a linear relationship between independent variables with dependent variable of expediency. Because there is a linear relationship between the two variables, the independent variables affect the dependent variable of benefit. The beta coefficient value is 0.661 or 66.1%. This calculation is significant because the probability significance value of SPSS calculation result is shown on column sig table 4. 22 0.000 <0,01.
Hypothesis Testing Influence Dependent Variable Perceived Ease of Use Against Dependent Variable Perceived Usefulness
TABLEXIII CORRELATIONS
Variable
Pearson Correlation
Significance Perceived
Ease of Use
Perceived
Usefulness
Perceived Ease
of Use 1 ,848 ,000
Perceived
Usefulness ,848 1 ,000
**. Correlation is significant at the 0.01 level (2-tailed).
From the table above there is a relationship of variable perceived usefulness with variable perceived ease of use. The value of the relationship is 0.848. The nature of positive correlation shows that the relationship between the variable perceived usefulness with variable perceived ease of use unidirectional. This means that if the benefit
variable has increased then the level of ease will increase as well.
The relationship between variable perceived usefulness and variable perceived ease of use is significant if seen in the signification number 0,000 <0.01. Based on the provisions, if the significance number <0.01 then the relationship between the two variables is significant, and indicates the relationship between ease of use variables and variable perceived usefulness.
Hypothesis Testing Influence Dependent Variable Perceived Usefulness Dependent Variable Attitude Toward Using
TABLEXIV CORRELATIONS
Variable
Pearson Correlation
Significance Perceived
Usefulness
Attitude
Toward
Using
Perceived
Usefulness 1 ,533 ,002
Attitude Toward
Using ,533 1 ,002
**. Correlation is significant at the 0.01 level (2-tailed).
From the table above there is a relationship of variables perceived usefulness with attitude toward using variable. The value of the relationship is 0.533. The nature of positive correlation shows that the relationship between the variable of expediency with variable direct user attitude. This means that if the variables perceived usefulness variable has increased then the level of attitude toward using will increase as well.
Hypothesis Testing Effect of Dependent Variables Perceived Ease of Use Against Dependent Variables Attitudes Toward Using
TABLEXV CORRELATIONS
Variable
Pearson Correlation
Significance Perceived
Ease of Use
Attitude
Toward
Using
Perceived Ease of
Use 1 ,710 ,000
Attitude Toward
Using ,710 1 ,000
**. Correlation is significant at the 0.01 level (2-tailed).
From the table above there is a relation of perceived ease of use variable with attitude toward using variable. The value of the relationship is 0.710. The nature of positive correlation shows that the relationship between variable perceived ease of use with variable attitude toward using. This means that if the variable perceived ease of use has increased then the level of attitudes toward using will increase as well.
The relationship between perceived ease of use variables and attitude toward using variables is significant if seen in the signification number 0,000 <0.01. Based on the provisions, if the significance number <0.01 then the relationship between the two variables is significant, and indicates the relationship between perceived ease of use variables and attitude toward using variables.
Hypothesis Testing Influence Dependent Variables Attitudes Toward Using Against Dependent Variables Behavioral Intention To Use
TABLEXVI CORRELATIONS
Variable
Pearson Correlation
Significance Attitude
Toward
Using
Behavioral
Intention to
Use
Attitude Toward 1 ,520 ,002
Using
Behavioral
Intention to Use ,520 1 ,002
**. Correlation is significant at the 0.01 level (2-tailed).
From the table above there is a relationship variable attitude toward using with behavioral intention to use variables. The value of the relationship is 0,520. The nature of positive correlation shows that the relationship between attitude toward using variable with the variable of interest of direct behavior. This means that if the variable attitude toward using has increased the level of interest in behavior will increase as well.
The relationship between attitude toward using variables and behavioral intention to use variables is significant if seen see the significance number 0.002 <0.01. Based on the provisions, if the significance number <0.01 then the relationship between the two variables is significant, and shows the relationship between user attitude toward using variables and behavioral intention to use variables.
V. CONCLUSIONS
Based on the results of 32 respondents telesales personal loan staff who serve as end-users or users directly ribbon loan system in doing office work every day, indicating that the suitability of tasks (job fit) telesales staff have a positive influence on the benefits of the ribbon loan system, which means the greater the suitability between tasks with the functions contained in the ribbon loan system, the greater the bandwidth of the loan system for the user.
However, when viewed based on the frequency of sex, age and duration of work. Female respondents believe that task conformity positively affects the utility of the system, perceived ease of use of the system positively affects the perceived usefulness of the system, usability and perceived ease of use of the system positively affect the attotude toward using of system usage, and attitude of system users positively influence with behavior interest. While the male respondents only believe that the suitability of the task positively affect the perceived usefulness of the system, perceived ease of use positively affect the perceived usefulness, and perceived ease of use positively affect the attitude toward using of the Ribbon Loan.
And when viewed in terms of age, the respondents with age ranges between 21-25 years assumed that the use of the Pita Loan System does not have an impact on their performance. Respondents with age ranges between 26-35 years thought that there were only some positive aspects of using the Pita Loan System, and according to respondents with over 35 years of age argued that the only positive value was on perceived ease of use, so they felt confident in using the Pita Loan System. And on the user's attitude towards the interest in using the Pita Loan.
Meanwhile, when viewed from the long working respondents, with a long working between 1-2 years assumed the suitability of the task has a positive influence on the perceived usefulness of the system, the perceived ease of use of the system also affect the perceived usefulness of the system, and the easier the system is used then they are more to
using of the system. And for respondents who work between 3-4 years assume that the perceived ease of use of the system affect the perceived usefulness of the system and the easier the system is used then they are more confident to use the system. But for respondents with a 5-year working life, they just assume the easier the system can be used, the more sure they use it.
REFERENCES
[1] Lin, J dan Chang, H. (2011), The Role Of Technology Readiness In Self-Service Technology Acceptance. Managing Service Quality, An International Journal, 21(4), 424 – 444.
[2] Abramson, J., Dawson, M. and Stevens, J. (2015), An Examination of the Prior Use of E-Learning Within an Extended Technology Acceptance Model and the Factors That Influence the Behavioral Intention of Users to Use M-Learning, Sage Open, page 1-9.
[3] Sayekti, F. and Putarta, P. (2016), Implementation Technology Acceptance Model (TAM) In Testing Model Acceptance of Regional Financial Information System, Journal of Theory and Applied
Management Year 9. No. 3.
[4] Muntianah. (2012), Influence of Behavioral Behavior to Actual Use of Information Technology with Approach of Teory Acceptance Model,
Profit, Vol. 6, No. 1.
[5] Priyanka, S and Kumar, A. (2013), Understanding The Evolution of Technology Acceptance Model, International Journal of Advance Research in Computer Science and Management Studies, 1(6), 144-148.
[6] Devi, N.L. and Suartana, I.W. (2014), Technology Acceptance Model Analysis (TAM) Against Use of Information System At Nusa Dua Beach Hotel & Spa, EJurnal Accounting of Udayana University 6.1, 167-184
[7] Hanggono, A.A., Handayani, S.R. and Susilo, H. (2015), Analysis of Practice Technology Acceptance Model (TAM) In Supporting Online Business By Utilizing Instagram Social Networking, Journal of
Business Administration (JAB),Vol. 26 No. 1.