1. Introduction:
This scientific revolution that invades the world of information and the Internet has imposed new challenges for the various researchers in recent years and has led them to design new technologies to contain and process these enormous volumes of data. Several models of parallel programming and distributed file management systems have emerged, mainly; the Hadoop Framework is positioned as the most widespread solution in the IT field [1]. Hadoop is a distributed, high-performance and scalable execution environment, it offers a
distributed storage system via its Hadoop Distributed File System (HDFS) file system and a data analysis and processing system based on the MapReduce programming model for perform parallel and distributed processing on large volumes of data. Our paper aims to study the methods and technologies of Big Data, we will focus particularly on technology Hadoop HDFS and MapReduce with its components [2]. Large amounts of information are put online on the web by thousands of companies, organizations and individuals, the load and the volume of data to manage have grown
Performance optimization in distributed DataWarehouses with
MapReduce: Treatment of data partitioning and distribution problems
Sara Riahi
*
, Azzeddine Riahi
**
*
Department of Mathematics and Computer Science, Chouaib Doukkali University, Faculty of Sciences , Po Box 20 , Postcode,24000, El Jadida, Morocco.
**
IMC Laboratory, Department of Physics , Chouaib Doukkali University , Faculty of Sciences, Po Box 20 , Postcode, 24000,El JADIDA , Morocco
---
************************
---Abstract:
We are currently facing an explosion of structured or unstructured data massively produced by different digital data sources. Firstly applications that generate data from logs, sensor networks, traces of GPS, etc., and secondly, users produce a lot of data such as photographs, videos and music. According to IBM, every hour 2.5 trillion bytes of data are generated. According to forecasts made, by 2020 this growth will be greater than 40 Zettabytes, while a Zettabyte of digital data only, were generated from 1940 to 2010. Many "inseparable" concepts currently dominate the IT field: "Cloud Computing", "Big Data", "NoSQL" or "MapReduce". Strict constraints put different researchers in the field, as for the storage and analysis of these data masses. The growth rate forecasts for the volumes of data processed exceed the limits of traditional technologies, namely relational databases or data warehouses. Our problem is how to manage the rapid growth geographically remote data volumes and how to manage this powerful scalability. What are the technologies and programming models proposed to overcome these various problems caused by this deluge of data.
Keywords—Big Data, HDFS, Hadoop, DataWarehouse ,MapReduce, Business intelligence
exponentially, For this, companies have resorted to the Datawarehouse for data analysis and storage.
Generally the Datawarehouse is centralized in a server connected to a storage array, this solution is difficult to scalable (addition of power on demand) in addition to the fact that it only manages the structured data in DBMS [3]. To cope with the explosion of data volume, we are currently talking about petabyte (byte count) or zettaoctet (trillion bytes) and also about the wide variety of data (image, text, web, etc.). A new technological field has emerged: the big data invented by the giants of the web, the first rank like Yahoo, Google and Facebook, which have been the very first to deploy this type of technology.
This concept provides a distributed and scalable architecture for processing and storing data. The main goal of this new paradigm is to improve performance and increase the velocity of execution of requests and processes. The rest of the paper is organized as follows in part 2 we explain the Big Data specifications ,Cloud Computing is reserved to part 3,Hadoop and its componentsare explained and detailed in part 4, MapReduce modeling systems are given in part 5 , The last section concludes the paper .
2. Big data and cloud computing:
2.1 Definition:
The term Big Data refers to the explosion of the volume of data (by their number, the speed at which they are produced and their variety) and the new solutions proposed to manage this volume by the ability to store and explore, and recently by the ability to analyze and use the data in a real-time approach [2]. Big data is an English expression used to refer to data sets that become so large that it becomes difficult to work with traditional database management tools. It is therefore a set of technologies, architecture, tools and procedures allowing an organization to quickly capture, process and analyze large quantities and heterogeneous and
changing contents, and extract relevant information at an affordable cost.
2.2 Big Data specifications:
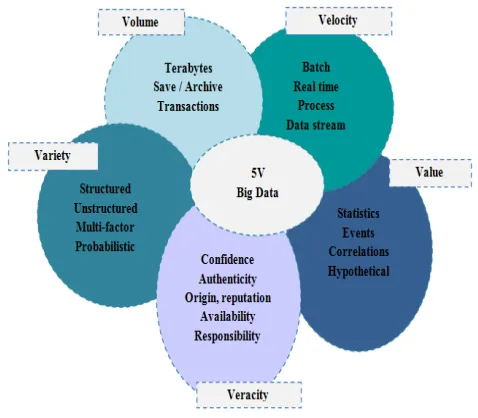
Big Data is a family of tools that address issues (Figure 1) : This is the so-called 5V rule.
Figure 1: Big Data, 5V
2.2.1 Volume:
Big Data is associated with a dizzying volume data, currently ranging between a few tens of terabytes and several petabytes in a single data set. Companies and all sectors combined will have to find ways to manage the volume of data constantly increasing, which is created daily. Catalogs of more than 10 million products have become the rule rather than the exception.
Here are some figures to illustrate this phenomenon [4]:
• 90% of the current data was created in the
last two years only;
• Twitter as an example, generates 7TB of
2.2.2 Velocity:
Velocity describes the frequency at which data are generated, captured and shared. Companies must grasp the Velocity not only in terms of data creation, but also in terms of their processing, analysis and restitution to the user in accordance with the requirements of real-time applications [3].
2.2.3 Variety:
The growth of the variety of data is the consequence of new multi-structural data and the expansion of data types from different heterogeneous sources. Today, information sensors are found in home appliances, trains, cars and planes, which produce a wide variety of information. These new unstructured data are varied [5]: Pictures ; Mails (with the semantic analysis of their content); Data from social networks (comments and opinions of users on Facebook or Twitter for example).
2.2.4 Veracity:
The veracity refers to data reliability. With so many sources and large forms of data, quality and accuracy are less controllable.
2.2.5 Value:
Value refers to the ability to turn big data into clear business value, which requires access and analysis to produce a meaningful result. These five characteristics illustrated by the five "V" are the principles that define Big Data. Above all, it is a change of direction on the use of the data. In sum, the key point of Big Data is to make sense of these big data and for that, it is necessary to analyze them.
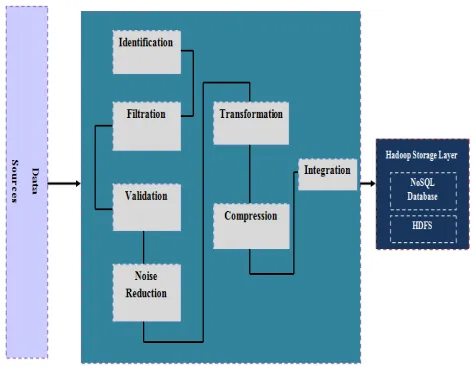
2.3 Process of loading and data collection in Big data:
The layer responsible for loading data into Big Data, should be able to handle huge volume of data, with high velocity, and a wide variety of data. This
layer should have the ability to validate, cleanse, transform, reduce (compression), and integrate data in large data stack for processing [6]. Figure 2 illustrates the process and components that must be present in the data load layer.
Figure 2: Data loading layer in Big Data
The data loading layer of Big Data collects the final relevant information, without noise, and loads it into the Big Data storage layer (HDFS or NoSQL base). It must include the following components [7]:
Identification of different known data formats, by default Big Data targets unstructured data;
Filtration and selection of relevant incoming information for the companies;
Validation and analysis of data permanently; Reduction of noise involves data cleansing by removing noise;
Transformation can lead to the division, convergence, standardization or synthesis of data;
2.4 Difference between Business Intelligence and Big Data:
The traditional BI methodology works on the principle of grouping all the data of the company in a central server (Data warehouse ). The data is usually offline analysis [8].
The data is usually structured in RDBMS with very little unstructured data. A Big Data solution is different from a traditional BI in the following aspects [4]:
Data is stored in a distributed and scalable file system rather than on a central server; The data is of different formats, both structured and unstructured;
The data is analyzed in real time;
Big Data technology is based on massively parallel processing (MPP concept).
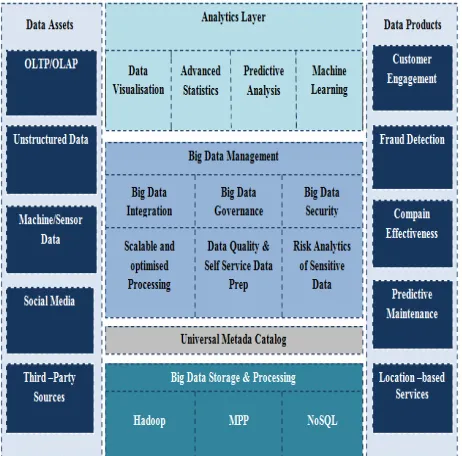
2.5 Big Data Architecture:
We distinguish mainly the following layers (Figure 3) [9]:
Hardware layer (Layer infrastructure): maybe VMware virtual servers, or blade servers;
Storage layer: the data will be stored either in a NoSQL database, or directly in the distributed file system or Datawarehouse;
Management and treatment layer: this layer contains tools for processing and analyzing data such as MapReduce or Pig;
Visualization layer: for visualization of the treatment result.
Figure 3: Big Data Architecture
2.6 Benefits of Big Data Architecture:
Several advantages can be associated with Big Data architecture, we can cite for example [10]:
Scalability: What is the size that will have your infrastructure? How much disk space is needed today and in the future? Big Data concept allows us to overcome these issues, because it brings a scalable architecture.
Performance: With the parallel processing of data and its distributed file system, Big Data concept is highly effective in reducing query latency [7].
Low cost: The main Big Data tool namely Hadoop is Open Source, in addition we will not need to centralize data storage arrays often excessively expensive, with Big Data and through the distributed file system internal drives of servers suffice.
2.7 The analysis, the key point of Big Data:
Big Data meets many specific objectives, including the extraction of useful information from stored data, the analysis of this data, the efficient retrieval of analysis results, and increased interactivity between users and data. The combination of this deluge of information and intelligent software algorithms opens up new business opportunities.
Take, for example, Google and Facebook which are "Big Data companies", but also IBM or JDA Software [11]. Analysis is the key point of using Big Data. It allows to better know its customers, to optimize its marketing, to detect and prevent frauds, to analyze its image on the social networks and to optimize its business processes.
2.8 The fields of use of Big Data:
Big Data has its place in many areas [12]:
In the first category, there are sectors that handle very large amounts of data daily, with associated velocity problems .They include:
• Banks: the sanctuarization of old data due
to regulatory constraints;
• Telecommunication: the analysis of the
state of the network in real time;
• Digital Media: advertising targeting and
website analysis;
• Financial Markets: transaction analysis for
risk management and fraud management, as well as for client analysis.
The second category is more heterogeneous, needs, but also the use that is made of big data, can be very different [8]. They include:
• Public services : counter analysis (gas,
electricity, etc.) and equipment management;
• Marketing: advertising targeting and trend
analysis;
• Health: analysis of medical records and
genomic analysis.
2.9 Big Data and Data Warehouse:
Data warehouses are traditionally supports structured data and were closely related to the operational and transactional business systems (RDBMS). These carefully constructed systems are now in the midst of important changes after the emergence of Big Data. Datawarehouse is a database (structured data) that includes some or all of the functional data of a company.
It comes within the framework of business intelligence; its purpose is to provide a set of data that serves as a unique reference, used for decision-making in the company by statistical arrays and reports made through reporting tools. From a technical point of view, it is mainly used to 'offload' the operational databases of queries that can affect their performance [13]. Organizations will inevitably continue to use data warehouses to manage the type of structured and operational data that characterizes relational systems (RDBMS). These warehouses will always be provided to analysts with the ability to analyze key data, trends, and so on.
We can interface Big Data with the Data Warehouse (DW) (Figure 4), actually unstructured data from different sources can be combined in a HDFS before being transformed and loaded with specific tools in the data warehouse and the traditional tools of BI. As traditional DW do not manage unstructured data, Big Data can serve as a storage medium and analysis of unstructured data that will be loaded into the DW [9].
Figure 4: Link between Big Data and DW
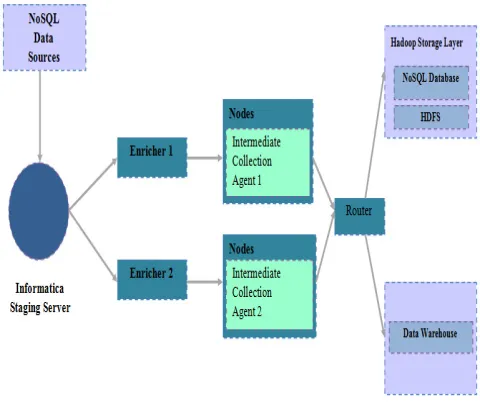
2.10 Big Data and ETL (extraction, transformation and loading):
Some traditional ETL tools are starting to adapt with the Big Data world. ETL tools are used to transform the data into the format required by the data warehouse (Figure 5) . The transformation is actually made in an intermediate location before the data will be loaded into the data warehouse [14]. For Big Data ETL tools such as Informatica have been used to provide a fast and flexible ingestion of unstructured data (over 150 GB / day).
Figure 5: Using ETL Informatica for Big Data
2.11 The main technologies of Big Data:
They are numerous. To optimize processing times on giant databases, several solutions must be taken into consideration (Figure 6) [15]:
NoSQL databases that implement storage systems considered more efficient than traditional SQL for mass data analysis (oriented key / value, document, or column chart).Server infrastructures to distribute the processing on tens, hundreds, even thousands of nodes. This is called the massively parallel processing. The Hadoop Framework is undoubtedly the best known of them [12].
Figure 6: Storage solutions
2.12 NoSQL Databases:
NoSQL databases are a subject very fashionable right now. The term NoSQL refers to a category of database management systems designed to handle large databases for large audience sites. NoSQL databases are scalable, they can process data in a distributed manner. Among the advantages of NoSQL we find [16]:
Their performance will never crumble whatever the volume processed. Their response time is proportional to the volume;
They migrate easily. Unlike conventional RDBMS, it is not necessary to perform a service interruption to carry out the deployment of a feature impacting data models [8]; They are easily scalable. For example, the largest cluster of NoSQL is 400 TB, while Oracle can handle up to twenty terabytes (for reasonable response times).
3. Cloud Computing:
Since its inception, the Internet technology is growing exponentially. Currently, a new "trend" is dominant, it is Cloud Computing. This technology is based on the WEB 2.0, provides opportunities for companies to reduce operating costs by their software applications online. In the next section, we will present the basics of Cloud Computing, its issues, developments and usefulness [17].
3.1 Definition:
Cloud Computing is a concept that makes accessible and usable data and applications across a network. This term refers to both the applications as Internet services and the hardware and software that provide these services [14].
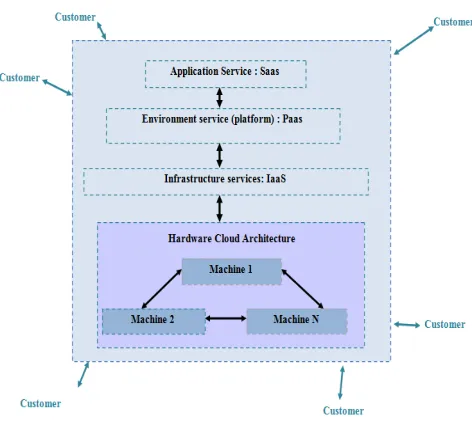
3.2The different services:
The concept "Cloud Computing" is used to designate a set of services, there are three categories of services provided(Figure 7) [12]:
Figure 7: Cloud Computing Services
Infrastructure as a service (IaaS): it is the provision, on demand, of infrastructure resources, most of which are located remotely in data centers.
Platform as a service (PaaS): refers to services that provide a complete environment for developing and deploying applications.
3.3 Deployment forms of cloud computing:
We distinguish three forms of Cloud Computing: The public cloud, also the first appeared, the private cloud and hybrid cloud which is actually the combination of the first two [18].
The public cloud:
The principle is to host applications, usually web applications, on a shared environment with an unlimited number of users. The implementation of this type of cloud is managed by third-party companies (example Amazon, Google, etc.). The public cloud providers, the best known are Google and Amazon.This model is characterized by [19]:
• Establishment of heavy investments for the
service provider.
• Offers maximum flexibility
• Is not secure.
The Private Cloud:
It is an environment deployed within a company using internal infrastructure of the company, and using technologies such as virtualization [16]. Resources are owned and controlled by the company's IT department.
Hybrid Cloud:
In general, hybrid cloud refers to the cohabitation and communication between a private cloud and a public cloud in an organization sharing data and applications.
4. Hadoop and its components:
The Big data includes several new technologies and tools to address three problems: a large amount of data to process, a large variety of information (structured or unstructured), and a certain level of Velocity to be achieved. To meet these needs, it turns out that the ecosystem Hadoop is the ultimate open source solution [20].
Apache Hadoop (High-availability distributed object-oriented platform) is a distributed system that addresses these issues. First, it provides a distributed file system, HDFS (Hadoop Distributed File System) for storage and data integrity by duplicating multiple copies of the same block through dozens, hundreds, or even thousands of different machines, which causes a Hadoop cluster to be configured without requiring a RAID system. In addition, Hadoop provides a data analysis system called MapReduce to perform processing on large data volumes due to its efficient distribution of work on different computing nodes.
4.1 Introducing Hadoop:
Hadoop is an open source Java framework for Apache for processing massive volumes of data, in the order of several Petabytes (several thousand TB). Hadoop was designed by Doug Cutting in 2004, also behind the Nutch Open Source engine. Doug Cutting looking for a solution to increase the index size of its engine [21]. He had the idea to create a distributed file management framework. Yahoo, then became the main contributor, the portal used the infrastructure to support its historical search engine. With more than 10,000 Linux clusters in 2008, it was one of the first Hadoop architectures worthy of the name. Created especially for large volumes. Facebook for log analysis, Google for query analysis, etc ... It is characterized by [17]:
• Robust: if a compute node falls, tasks are
automatically distributed to other nodes. The data blocks are replicated;
• Cost : it optimizes costs through better use
of resources presented;
• Flexible: because it responds to the
Virtualization: no longer rely directly on the physical infrastructure (expensive storage array), but choose the virtualization of its Hadoop clusters.Three main Hadoop distributions are now available: Cloudera, Hortonworks, MapR. We will present two fundamental concepts of Hadoop: Its own version of the MapReduce algorithm namely Hadoop MapReduce and its HDFS distributed file system.
4.2 The Hadoop Distributed File System (HDFS):
Hadoop uses a virtual file system of its own: the HDFS (Hadoop Distributed File System). HDFS is a distributed, extensible and portable file system inspired by the Google File System (GFS) [22]. It was designed to store very large volumes of data on a large number of machines equipped with unmarked hard drives; it allows the abstraction of physical storage architecture, to manipulate a distributed file system as if it were a single hard drive. However, HDFS stands out a classic file system for the following main reasons (Figure 8) :
HDFS is not dependent on the kernel of the operating system. It provides portability and can be deployed on different operating systems. One of its disadvantages has to request an external application to mount an HDFS disk drive [23]; HDFS is a distributed system on a conventional system, disk size is generally considered as the overall limit of use. In HDFS, each node of a cluster corresponds to a subset of the overall volume of the cluster data. To increase the overall volume, just add new nodes. We also find in HDFS, a central service called NameNode which will have the task of managing metadata;
HDFS uses much larger block sizes than conventional systems. By default, the size is set to 64 MB. However, it is possible to increase to 128 MB, 256 MB, 512 MB or even 1 GB. While on conventional systems, the size is usually 4 KB, the interest of providing larger sizes to reduce the
access time to a block. Note that if the file size is less than the block size, the file will not occupy the total size of the block [18]; HDFS provides a block replication system with a configurable number of replications. During the writing phase, each block corresponding to the file is replicated to multiple nodes. In the read phase, if a block is not available on a node, copies of this block will be available on other nodes.
Figure 8: The architecture of HDFS
4.3 The components of HDFS:
HDFS defines two types of nodes [24]:
The main node or NameNode:
It is characterized by (Figure 9) :
Responsible for distribution and replication of the blocks;
HDFS information server for HDFS client; Stores and manages metadata;
Contains the list of blocks for each file (for reading);
Keep file attributes (eg name, creation date, replication factor);
Logs any metadata and any transaction in a persistent medium;
Reading / writing; Creations / deletions;
Starts from an image of HDFS (fsimage).
The DataNode :
It is characterized by [25]:
Stores data blocks in the local file system; Maintain metadata on owned blocks ; Data block and metadata server for the HDFS client;
Heartbeat with NameNode:
Heartbeat is a system that allows Linux to cluster multiple servers to perform a fault-tolerance process. The Heartbeat process will send a message to the NameNode indicating: its identity, its total capacity, its used space, its remaining space.
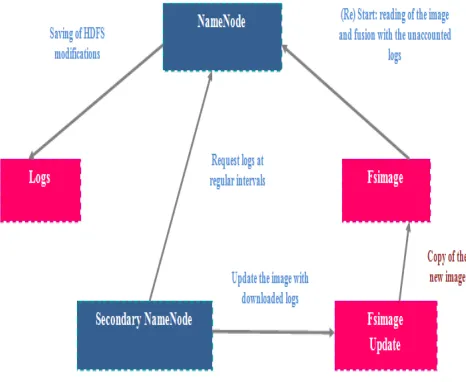
Secondary NameNode :
The NameNode in the Hadoop architecture is a single point of failure [20]. If this service is stopped, there is no way to extract the blocks from a given file. To solve this problem, a Secondary NameNode has been implemented in the Hadoop architecture.
Its role is to:
Download regularly logs on NameNode; Creates a new image by merging the logs with the HDFS image;
Returns the new image to NameNode.
Figure 9: Secondary NameNode operation
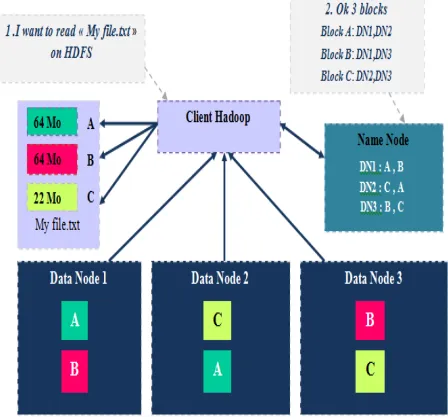
4.4 Reading a HDFS file:
To read a file within HDFS, the following steps must be followed (Figure 10) [26]:
Step 1: The client tells the NameNode that he wants to read the data.txt file
Step 2: The NameNode will indicate the file size (number of blocks) and the various Data Node hosting the n blocks.
Step 3: The client retrieves each block to one of DataNodes.
Figure 10: Reading a HDFS file
4.5 Writing to an HDFS file or volume:
To write a file within HDFS (Figure 11) [27]:
Step 1: We will use the main control management Hadoop: Hadoop, with fs option. Suppose we want to store the data.txt file on HDFS.
Step 2: The program will divide the file into blocks of 64KB (or depending on the configuration) - Suppose that we have 3 blocks.
Step 3: The NameNode desinate which DataNodes to contact.
Step 4: The client contacts directly DataNode concerned and asks it to store the block.
Step 5: the DataNodes will attend - informing the NameNode - to replicate data between them to prevent loss of data.
Step 6: The cycle is repeated for the next block.
Figure 11: Writing process in a volume or HDFS file.
5. Map Reduce :
MapReduce is a paradigm (model) parallel programming offered by Google. It is mainly used for distributed processing on large volumes of data within a cluster of nodes. It is designed for scalability and fault tolerance. The programming model provides a framework for a developer to write a Map function and a Reduce function. The whole point of this programming model is to simplify the developer's life. Thus, this developer does not have to worry about the work of parallelization and distribution of the work. MapReduce allows the developer to focus only on the algorithmic part [25].
A MapReduce program can be summarized in two functions Map ( ) and Reduce ( )
execute the MAP operation for each machine in the cluster on a separate fragment.
The Map function is written as follows (Figure 12):
( 1, 1) List( 2, 2)
Map Key Value → Key Value
Figure 12: Implementing the Map Function for the Word Count Example
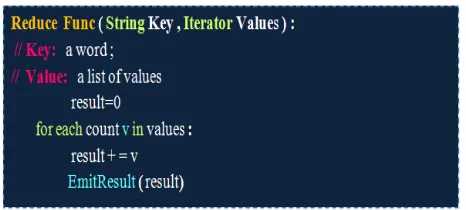
The second REDUCE, will apply a processing to all the values of each of the distinct keys produced by the MAP operation. After the REDUCE operation, there will be a result for each of the separate keys [27]. Here, we assign to each cluster machine a unique key generated by MAP, giving it a list of the associated values with the key. Each machine will then perform the REDUCE operation for this key.
The Reduce function is written as follows (Figure 13) :
( 2, ( 2)) ( 2)
Reduce Key List Value →List Value
Figure 13: Implementing the Reduce Function for the Word Count Example
5.1 MapReduce modeling system:
5.1.1 Modeling challenges:
The challenges of modeling such a system are very numerous, but the two main ones are: MapReduce has a complex architecture, which implies a great difficulty in the detailed behavior modeling. Such a model would be for example a nonlinear hybrid model of very large size, varying in time, and therefore likely of questionable value [28]. In addition, since it is very difficult to integrate the effect of congestion points - network, IO, CPU - into a mathematical model, several strong assumptions must be made (such as a single job is running at every moment in the cluster) that is not valid in the real clusters. In addition, we must mention that the performance of MapReduce systems varies from one distribution to another and even within the same distribution, due to continuous development. This complicates more the construction of a general model.
The existing models of MapReduce systems only take into account the generally static response, therefore they are very difficult to exploit [24]. One of the main reasons for the absence of dynamic models is the great complexity of the mentioned system.
5.1.2 Modeling overview:
In this section, we discuss the challenges presented above.Managing the complexity of the system.It is observed that, even if the system is nonlinear, we can linearize around an operating point characterized by a number of reference nodes and clients. After the service provider has decided how many nodes he wants for his requests (usually based on financial constraints), our algorithm gradually increases the number of customers it can accept, until the cluster flow is maximized (which is very important for environmental and financial reasons).
major challenges in current MapReduce deployments is that it needs to ensure some minimum response times. Therefore, our control objective is to keep the average service time below a given threshold, for work that has finished in the last window of time. This time window is introduced to assign measurable dynamics to the system. Defining the length of the window is not very simple because the more the window is great we lose more dynamic while smaller it is the more measures its noisy. For the optimal value of choosing the size of the window is usually at least twice as large as the average execution time of the task [23]. The choice of the control inputs of the many parameters of Hadoop (more than 170) is not obvious. As we want the model is not dependent on the implementation, we take into consideration that the parameters have a strong influence regardless of the version used MapReduce. Two of these factors, which have been identified as being among those with the greatest degree of influence, are the number of Mappers and Reducers available for the system. Since these parameters are fixed per node, we have chosen the number of nodes as the command entry because it influences both at the same time.
5.1.3 Structure of the studied model:
The complexity of a MapReduce system and continuous changes in behavior due to upgrades and software enhancements, prompted us to avoid the use of a white box modeling technique and opt for a technique that is agnostic to these. This leads us to a gray box or black box modeling technique. The dividing line between these two techniques is not well defined, but we consider our model as a gray box model since the structure of the model was defined based on our observations of the operating linearity regions of the system [21].
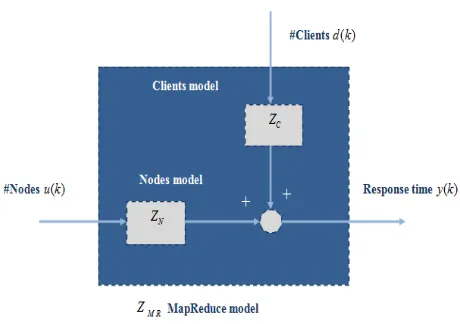
We study a dynamic model that predicts the performance of a MapReduce cluster, in this case
the average response time, depending on the number of nodes and the number of customers. It is the first performance-oriented dynamic model for MapReduce systems. The model structure is shown in Figure 14. The control input ( )u k is given by the number of nodes in the cluster while the changes of clients d k( ) is considered as a measurable disturbance. The output ( )y k is the average of the response times of the tasks in the kth time interval .Since around the point of operation of the system is linear, we can apply the superposition principle to calculate the output [22]:
( ) C( ) ( ) N( ) ( )
y k =Z z d k +Z z u k
Where ZN is the discrete model between the response time and the number of nodes and ZC is the discrete model between the response time and the number of clients.
Figure 14: Diagram of the theoretical model of MapReduce control
The MapReduce is a programming model associated with implementation initially proposed by Google. It allows the processing and generation of large data. The input data format is specified by the user and application dependent. The output is a set of couples<Key Value, >. The user describes his
The Map function takes a set of data and produces an intermediate list of couples<Key Value, >.
The Reduce function is applied to all intermediate data and merges the results with the same key. A typical pseudo-code of these functions is given above. This is an example that counts the number of occurrences of each word in a set of documents. A major advantage of this model is its simplicity. Each Job MapReduce submitted by a user is a working unit of input data, the two functions Map and Reduce and configuration information. The job is then automatically parallelized and run on a cluster or on a set of data centers. Figure 14 shows the general architecture. The input data is divided into M units denoted splits.
Each split is processed in parallel by a Map task invoking the Map function [26].The intermediate keys generated by the Map tasks are divided into R fragments, called partitions, which are distributed to Reduce tasks. The data fragments received by a Reduce task are then sorted by key and processed by the Reduce function. Like the Map tasks, Reduce tasks are executed in parallel. The initial data and the data produced at the end of a MapReduce are stored in a fault-tolerant distributed storage system such as HDFS or Google File System.The intermediate results produced by the Map tasks are however only kept on disk nodes running tasks without special mechanism to tolerate faults. Current implementations are based on a master-slave architecture. A MapReduce is submitted by the user to a master node that chooses free slave nodes and assigns them Map or Reduce tasks to execute. The free node faults are treated automatically. If a node is suspected of being faulty, the master restarts its tasks on a new machine.
However, the master of the failures is not taken into account. On the other hand, if a node performing tasks is inefficient, the master can speculatively launch a copy of his tasks on another machine to
obtain a result more quickly. However, the speculation mechanism is to schedule an additional replica if the calculation of the task was not performed in a pre-defined period [28]. Hadoop is an open-source implementation of MapReduce widely used. It was proposed by Apache and uses HDFS storage system (Hadoop Distributed File System).In HDFS, each file is divided into a set of fixed-size blocks stored in independent units on the discs of the platform. HDFS provides high availability and reliability by replicating each data with a degree of replication set by default to 3.
To control the execution of tasks, Hadoop defines a single master, the JobTracker, which manages the status of submitted jobs and orders the execution of tasks. On slave machines, a process, the TaskTracker, checks the availability of the execution slots of this machine. Note that to improve performance, computing phase and inputs / outputs can be covered by executing several Map and Reduce tasks in parallel on the same slave machine. Whenever a TaskTracker detects an available slot on the machine, it contacts the JobTracker calling for a new task. If it is a Map task, the JobTracker takes into account the location of the slave and chooses a task whose input data (split sound) is as close as possible to the TaskTracker machine. In contrast to Reduce tasks, it is not possible to take into account data locality.
6. Conclusion:
Acknowledgment:
We would like to thank the CNRST of Morocco (I 012/004) for support.
References:
[1] Azzeddine RIAHI, Sara RIAHI,’’ The Big Data
Revolution, Issues and Applications’’, International Journal of Advanced Research in Computer Science and Software Engineering’’, Volume 5, Issue 8, ISSN: 2277 128X, August- 2015, pp. 167-173.
[2] Sara Riahi, Azzeddine Riahi" Innovation and
opportunities of Big Data: promote business
Intelligence"Vol. 3 - Issue 6 ( 470 - 481 ) - November - December 2017,International Journal of Engineering and
Techniques (IJET), ISSN: 2395 - 1303 ,
www.ijetjournal.org
[3] Sara Riahi, Azzeddine Riahi ,’’ Visualization of Big Data with the Map-Reduce program execution platform: Hadoop ‘’ , International Journal of Engineering Trends and Technology (IJETT) Volume 54 Issue2- December 2017, ISSN: 2231-5381, www.ijettjournal.org
[4] Furqan Alam, Rashid Mehmood, Iyad Katib, Nasser
N. Albogami, Aiiad Albeshri, "Data Fusion and IoT for Smart Ubiquitous Environments: A Survey", Access
IEEE, vol. 5, pp. 9533-9554, 2017, ISSN 2169-3536.
[5] Thusoo, A. Sarma, J.S., Jain, N., Shao, Z., Chakka, P. Zhang, N.,Antony, S., Liu, H., and Murthy, R. Hive – A Petabyte Scale Data Warehouse Using Hadoop. Proc. of ICDE, 2010.
[6] Colin White, BI Research, July 2011, IBM
Sponsored, Using Big Data for Smarter Decision Making.
[7] Bendre, M. R., & Thool, V. R. (2016). Analytics, challenges and applications in big data environment: A survey. Journal of Management Analytics, 3(3), 206– 239. doi:10.1080/23270012.2016.1186578
[8] Santos, M. Y., & Costa, C. (2016a). Data models in
NoSQL databases for big data contexts.
In Y. Tan & Y. Shi (Eds.), Data mining and big data: First international conference, DMBD 2016, Bali, Indonesia, June 25-30, 2016. Proceedings (pp. 475– 485). Cham: Springer International. doi:10.1007/978-3-319-40973-3_48
[9] W. H. Inmon, Building the Data Warehouse,
Published by John Wiley & Sons, Inc, 2002.
[10] Di Tria, F., Lefons, E., Tangorra, F.: Design
process for Big Data warehouses. In: 2014
International Conference on Data Science and Advanced Analytics (DSAA), pp. 512–518. IEEE (2014)
[11] Thusoo, A., Sarma, J.S., Jain, N., Shao, Z., Chakka, P., Zhang, N., Antony, S., Liu, H., Murthy, R.: Hive-a petabyte scale data warehouse using hadoop. In: 2010 IEEE 26th International Conference on Data Engineering (ICDE), pp. 996–1005. IEEE (2010) [12] S. YiChuan and X. Yao, “Research of Real-time Data Warehouse Storage Strategy Based on Multilevel Caches,” Phys. Procedia, vol. 25, no. 0, pp. 2315–2321, 2012.
[13] R. S. Xin, J. Rosen, M. Zaharia, M. J. Franklin, S. Shenker, and I. Stoica, “Shark: SQL and Rich Analytics at Scale,” in Proceedings of the 2013 ACM SIGMOD International Conference on Management of Data, 2013.
[14] Devlin B, Cote LD. Data Warehouse: From
Architecture to Implementation. Addison-Wesley
Longman Publishing Co.; 1996. Todman C. Designing a Data Warehouse: Supporting Customer Relationship Management. Prentice Hall PTR Upper Saddle River; 2000.
[15]Vaibhav N. Keskar, Amit A. Kathade, Gopal S.
Sarda and Amit D. Joshi : “An Automation Tool for Single-node and Multi-node Hadoop Cluster”. Journal of Artificial Intelligence, 6: 82-88, 2013 .
[16] V Srinivas Jonnalagadda at al, “ A Review Study of
Apache Spark in Big Data Processing” International Journal of Computer Science Trendsand Technology (I
JCST) – Volume 4 Issue 3, May - Jun 2016.
[17] J. Dean and S. Ghemawat. Mapreduce: simplified data processing on large clusters. In OSDI’04: Proceedings of the 6th Symposium on Opearting Systems Design & Implementation, pages 10–10, 2004.
[18] E.Sivaraman, Dr.R.Manickachezian, “High
Performance and Fault Tolerant Distributed File System for Big Data Storage and Processing using Hadoop”, 2014 International Conference on Intelligent Computing Applications,IEEE, 2014
[19] N. Saravanan, R. Baskaran, M. Shanmugam, M.S. SaleemBasha and P. Victer Paul, "An Effective Model for QoS ssessment in Data Caching in MANET.
[20]Ivanilton Polatoa, Reginaldo Reb, Alfredo Goldman,
Fabio Kona, "A Comprehensive View of Hadoop Research - A Systematic Literature Review", Journal of Network and Computer Applications, Volume 46, PP 1-25, November 2014
[21] A. Pavlo et al., "A Comparison of Approaches to Large-Scale Data Analysis", In Proc. of ACM SIGMOD, 2009.
In Proceedings of the sixteenth international workshop on Data warehousing and OLAP (pp. 67-70). ACM [23] Hongyong Yu, Deshuai Wang Proc., “ Mass Log Data Processing and Mining Based on Hadoop and Cloud Computing ”, Computer Science & Education (ICCSE 2012)July 14-17, 2012.
[24] Dawei Jiang G CA. K. H. Map-join-reduce: Towards scalable and efficient data analysis on large clusters. IEEE Transactions on Knowledge and Data Engineering, 2011, 23(9): 1299–1311
[25] Cohen, J., Dolan, B., Dunlap, M., Hellerstein, J.M., and Welton, C. MAD Skills: New Analysis Practices for Big Data. PVLDB 2(2), 2009.
[26] Dean J, Ghemawat S. Mapreduce: Simplified data processing on large clusters. In: Proceedings of the 6th Symposium on Operating Systems Design and Implementation. 2004, 137–150
[27] Jörg, T., & Dessloch, S. (2014). Near Real-Time Data Warehousing Using State-of-the-Art ETL Tools. In Enabling Real-Time Business Intelligence (pp. 100– 117). Springer Berlin Heidelberg.