Copyright © 2013 IJECCE, All right reserved 654
International Journal of Electronics Communication and Computer Engineering
Volume 4, Issue 2, ISSN (Online): 2249–071X, ISSN (Print): 2278–4209
Performance Metrics of ATM & IP Network for
Multiple Profiles with 99% Background Utilization of
Link
Dr. G. S. Sunitha, Dr. Suresh Chandra Mohan
Abstract–This paper investigates the performance metrics end-to-end delay and response time for pure ATM, pure IP networking technologies for multiple profiles with 99 percent background utilization of link. To study the said metrics a university network of size 1000 km X 2000 km geographical area has been considered with University and four zones in the top most layer with varying distances of 20 kms, 800 kms, 900 kms and 1000 kms respectively followed by college layer comprising of distance 10 kms and 250 kms and bottommost layer, department layer consisting of three departments represented typically by Dept_EC, Dept_CS and Dept_CV. Each department is capable of handling the multimedia traffic for multiple profiles. The model has been built andsimulated using OPNET IT Guru Academic Edition 9.1, to study the performance metrics for data rate, OC3 (149Mbps) for ATM network and 100 Mbps for IP network. A G711 and G723.1 encoder scheme has been used for voice, low and high resolution for video and low and high load has been used for FTP and EMAIL.
The results of simulation indicate that pure ATM has better performance compared to pure IP network with respect to voice and video due to prior path establishment feature in ATM. The large delay offset included in ATM is for the reservation of network resources to assure quality of voice and video information. The response time of pure ATM network is better compared to pure IP network due to random path detection in IP networks.
Keywords–ATM, Link Utilization, OPNET.
I. I
NTRODUCTIONNetworking technologies play important role in our lives. It is undisputed that Internet has become an integral part of Education, Business, Industry, Economy as well as residential world of our society. Performance based network infrastructure and bounded end-to-end delays is the need of ever growing Internet and distributed real-time applications. Networking technologies like ATM and IP that offer packet routing services are prominent in present
day’s ever growing real time traffic. The vital role in a network is its enhancement of real time traffic which is sensitive to end-to-end delay. Voice and Video traffic of multimedia are delay sensitive and require extra care to provide quality of service [8]. ATM and IP have special features to support multimedia. ATM technology has an enormous impact on future distributed systems because of its attractive features[1][6].The core features of ATM include high speed, cell switching, virtual networking and scalable technology. ATM has an inherent mechanism for Quality of Service (QoS)[2][3][10]. IP technology requires a protocol to specify delay limits in the form of Resource reSerVation Protocol (RSVP). These two technologies are considered to be backbone of a network in terms of their routing capabilities[7][12].
II. B
UILDING THEN
ETWORK ANDS
IMULATIONThe real-time distributed system is modeled as a Network for University(NU)with anarea of 1000Km X2000 Km. Network for University has 3 layers. Layer1 has university and four zones, Zone_20, Zone _800, Zone_900,and Zone_1000.The numeral in Zone indicates the distance in kilometers between Zone and University. Layer 2 has two Colleges, College_10and College_250, which represent the colleges under that Zone located at a distance of 10and 250 kilometers respectively. Layer 3 has three departments in college, Dept_EC, Dept_CS and Dept_CV with C10_EC_Voice_src1, C10_EC_Video_ src1, C10_EC_data1 as user voice source, user video source and user data source. The University, different zones and different colleges under a zone are knit by Public Network whereas the departments of a college use a Private Network. Each department is facilitated with bidirectional multimedia communication over a single network. OPNET IT Guru Academic Edition 9.1, 2003, simulation tool is used for modeling NU system[5][13].
The layered architecture enable the setting up of NU system in top-down approach in steps of increasing complexity, thus ensuring its completeness and validity at each layer. The Application Config object in the project workspace named as Applications is configured for Voice, Video, FTP and EMAIL. Profile_1 node is used to create user profiles for NU system as FTP_P, EMAIL_P, Voice_P1 and Video_P1. The applications defined are used by Profile_1 to configure profiles. This Profile_1 will cause the Voice and Video application to run every 300s.Similarly multiple profiles Pro1, Pro5, Pro10, Pro15 and Pro20 also configured.
A. Configuration of Subnet Dept_EC
Copyright © 2013 IJECCE, All right reserved Fig.1. SubnetDept_EC
B. Configuration of other subnets
The other subnets Dept_CS and Dept_CVare built and configured similar to subnet Dept_EC. The department subnets along with server are connected to C10_Switch which is linked to C10_Router. The department together with server, switch and router forms college_10 subnet as shown in Fig. 2. Similarly other college subnets are created and configured.
Fig.2. Subnet of College_10
The subnet Zone_20 encapsulates the College_10 and College_250 along R20_Server, R20_Switch and R20_Router as shown in Fig. 3.
Fig.3. Subnet of Zone_20
This process is repeated for other Zone_800, Zone_900, Zone_1000 and University. All Zones are linked to University by bidirectional links. The complete NU system is as shown in Fig. 4.
Fig.4. NU System
The configuration of QoS in ATM is inherent and set for default settings and in IP configured using RSVP.
The different statistics that are collected for ATM and IP network are:
Voice: Packet End-to-End Delay (s)
Video Conferencing: Packet End-to-End Delay (s)
FTP: Download Response Time (s)
EMAIL: Download Response Time (s)
Link Statistics: Point-to-point Utilization collected between Regions and University only.
Scenarios of the remaining zones with low and high loads, with and without QoS are created by duplication and suitable modification of the base scenario built. The different projects are created for ATM and IP networks and are simulated.
III. R
ESULTS ANDC
ONCLUSIONSThe NU system is modeled for ATM and IP networks. NU system is simulated for different scenario to compare the performance of ATM and IP networks. The different applications considered for model NU system are Voice, Video, FTP and Email. The ATM uses atm_adv link with data rate of 149 Mbps for OC3 and IP uses BaseX_link with data rate of 100Mbps. Bck99 represents the average 99% background utilization of the link. This section discusses, infers results obtained from simulation scenarios. Copyright © 2013 IJECCE, All right reserved
Fig.1. SubnetDept_EC
B. Configuration of other subnets
The other subnets Dept_CS and Dept_CVare built and configured similar to subnet Dept_EC. The department subnets along with server are connected to C10_Switch which is linked to C10_Router. The department together with server, switch and router forms college_10 subnet as shown in Fig. 2. Similarly other college subnets are created and configured.
Fig.2. Subnet of College_10
The subnet Zone_20 encapsulates the College_10 and College_250 along R20_Server, R20_Switch and R20_Router as shown in Fig. 3.
Fig.3. Subnet of Zone_20
This process is repeated for other Zone_800, Zone_900, Zone_1000 and University. All Zones are linked to University by bidirectional links. The complete NU system is as shown in Fig. 4.
Fig.4. NU System
The configuration of QoS in ATM is inherent and set for default settings and in IP configured using RSVP.
The different statistics that are collected for ATM and IP network are:
Voice: Packet End-to-End Delay (s)
Video Conferencing: Packet End-to-End Delay (s)
FTP: Download Response Time (s)
EMAIL: Download Response Time (s)
Link Statistics: Point-to-point Utilization collected between Regions and University only.
Scenarios of the remaining zones with low and high loads, with and without QoS are created by duplication and suitable modification of the base scenario built. The different projects are created for ATM and IP networks and are simulated.
III. R
ESULTS ANDC
ONCLUSIONSCopyright © 2013 IJECCE, All right reserved 656
International Journal of Electronics Communication and Computer Engineering
Volume 4, Issue 2, ISSN (Online): 2249–071X, ISSN (Print): 2278–4209
C. Voice Application
TheDelay for G723.1 and G711 multiple profileswith data rate of OC3 for ATM[4] and 100 Mbps for IP network for without QoS and with QoS / without RSVP
and with RSVP are tabulated as shown in Table 1,Table2 and corresponding graph isas shown in Fig.5 and Fig. 6 respectively.
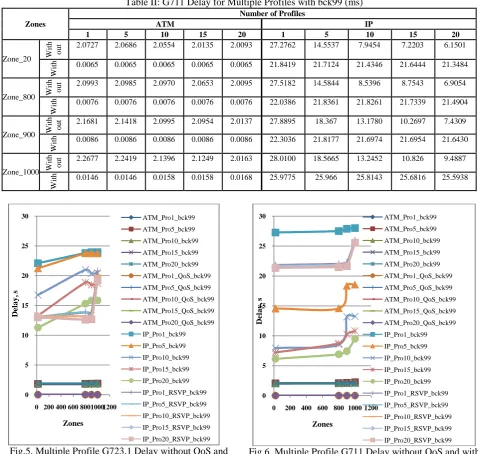
Table I: G723.1 Delay for Multiple Profiles with bck99(ms) Zones
Number of Profiles
ATM IP
1 5 10 15 20 1 5 10 15 20
Zone_20 With out 1.7742 1.8347 1.8572 1.8634 1.9028 22.0945 21.2426 16.7639 13.2897 11.2868
With 0.0217 0.0217 0.0217 0.0217 0.0217 13.0532 13.0808 13.0348 12.9873 12.9969
Zone_800 With out 1.7763 1.8441 1.8694 1.8739 1.9030 23.8147 23.7665 20.9848 18.8602 15.3065
With 0.0227 0.0227 0.0227 0.0227 0.0227 13.8415 13.0841 13.1972 12.6193 12.6012
Zone_900 With out 1.7767 1.8764 1.8733 1.8847 1.9039 23.9529 23.7564 20.3644 18.4602 15.8589
With 0.0233 0.0233 0.0233 0.0233 0.0233 13.8716 13.0694 13.1281 12.6938 12.6809
Zone_1000 With out 1.7793 1.8872 1.8972 1.8979 1.9042 23.9481 23.7530 20.4769 18.7436 15.8533
With 0.0237 0.0237 0.0237 0.0237 0.0237 20.7791 20.0057 19.9907 19.2600 19.2109
Table II: G711 Delay for Multiple Profiles with bck99 (ms) Zones
Number of Profiles
ATM IP
1 5 10 15 20 1 5 10 15 20
Zone_20 W
it
h
o
u
t 2.0727 2.0686 2.0554 2.0135 2.0093 27.2762 14.5537 7.9454 7.2203 6.1501
W
it
h 0.0065 0.0065 0.0065 0.0065 0.0065 21.8419 21.7124 21.4346 21.6444 21.3484
Zone_800 W
it
h
o
u
t 2.0993 2.0985 2.0970 2.0653 2.0095 27.5182 14.5844 8.5396 8.7543 6.9054
W
it
h 0.0076 0.0076 0.0076 0.0076 0.0076 22.0386 21.8361 21.8261 21.7339 21.4904
Zone_900 W
it
h
o
u
t 2.1681 2.1418 2.0995 2.0954 2.0137 27.8895 18.367 13.1780 10.2697 7.4309
W
it
h 0.0086 0.0086 0.0086 0.0086 0.0086 22.3036 21.8177 21.6974 21.6954 21.6430
Zone_1000 W
it
h
o
u
t 2.2677 2.2419 2.1396 2.1249 2.0163 28.0100 18.5665 13.2452 10.826 9.4887
W
it
h 0.0146 0.0146 0.0158 0.0158 0.0168 25.9775 25.966 25.8143 25.6816 25.5938
Fig.5. Multiple Profile G723.1 Delay without QoS and with QoS/without RSVP and with RSVP with bck99 (ms)
Fig.6. Multiple Profile G711 Delay without QoS and with QoS / without RSVP and with RSVP with bck99 (ms)
0 5 10 15 20 25 30
0 200 400 600 80010001200
D
e
la
y
,
s
Zones
ATM_Pro1_bck99
ATM_Pro5_bck99
ATM_Pro10_bck99
ATM_Pro15_bck99
ATM_Pro20_bck99
ATM_Pro1_QoS_bck99
ATM_Pro5_QoS_bck99
ATM_Pro10_QoS_bck99
ATM_Pro15_QoS_bck99
ATM_Pro20_QoS_bck99
IP_Pro1_bck99
IP_Pro5_bck99
IP_Pro10_bck99
IP_Pro15_bck99
IP_Pro20_bck99
IP_Pro1_RSVP_bck99
IP_Pro5_RSVP_bck99
IP_Pro10_RSVP_bck99
IP_Pro15_RSVP_bck99
IP_Pro20_RSVP_bck99
0 5 10 15 20 25 30
0 200 400 600 800 1000 1200
D
e
la
y
,
s
Zones
ATM_Pro1_bck99
ATM_Pro5_bck99
ATM_Pro10_bck99
ATM_Pro15_bck99
ATM_Pro20_bck99
ATM_Pro1_QoS_bck99
ATM_Pro5_QoS_bck99
ATM_Pro10_QoS_bck99
ATM_Pro15_QoS_bck99
ATM_Pro20_QoS_bck99
IP_Pro1_bck99
IP_Pro5_bck99
IP_Pro10_bck99
IP_Pro15_bck99
IP_Pro20_bck99
IP_Pro1_RSVP_bck99
IP_Pro5_RSVP_bck99
IP_Pro10_RSVP_bck99
IP_Pro15_RSVP_bck99
Copyright © 2013 IJECCE, All right reserved The difference in delay for multiple profiles for G723.1
without and with QoS in ATM network is attributed to the inherent difference in the service category used. The difference in delay for IP network is attributed to best effort service and RSVP used in without and with RSVP respectively.
For multiple profiles without RSVP there is an increase in delay with RSVP because reservations are made at intermediate switches, which act as shared pipe whose capacity is the largest of resource requests for that link from all receivers.
The delay in IP is doubled as compared to ATM for without QoS/RSVP for increasing number of profiles.
The delay in ATM is fairly constant in milliseconds for increase in number of profiles due to prior connection establishment and its inherent QoS.
D. Video Conferencing Application
The Delay for Low and High Resolution Video for multiple profiles with data rate of OC3 for ATM and 100 Mbps for IP network for without QoS and with QoS / without RSVP and with RSVP aretabulated as in Table 3,Table 4 and corresponding graph is as shown in Fig.7 and Fig.8 respectively.
Table III: Low Resolution Video Delay for Multiple Profiles with bck99 (ms) Zones
Number of Profiles
ATM IP
1 5 10 15 20 1 5 10 15 20
Zone_20 W
it
h
o
u
t 2.2496 2.2498 2.2520 2.2532 2.2530 27.1016 28.5674 20.8298 16.4384 13.6804
W
it
h 0.0217 0.0217 0.0217 0.0217 0.0217 14.6789 14.5896 14.6200 14.5044 14.3479
Zone_800 W
it
h
o
u
t 2.2518 2.2490 2.2481 2.2480 2.2489 28.0610 28.6653 26.8970 24.0830 19.6079
W
it
h 0.0228 0.0228 0.0228 0.0228 0.0228 14.3383 14.2227 14.6510 14.5916 14.5934
Zone_900 W
it
h
o
u
t 2.2525 2.2476 2.2445 2.2435 2.2434 28.2806 28.5636 26.3583 23.6384 20.0593
W
it
h 0.0233 0.0233 0.0233 0.0233 0.0233 14.4301 14.4832 14.6290 14.6786 14.6548
Zone_1000 W
it
h
o
u
t 2.2547 2.2535 2.2540 2.2521 2.2537 28.2969 26.3958 18.0487 15.9185 13.3925
W
it
h 0.0238 0.0238 0.0238 0.0238 0.0238 22.5412 22.1733 22.5389 22.6263 22.5754
Table IV: High Resolution Video Delay for Multiple Profiles with bck99 (ms) Zones
Number of Profiles
ATM IP
1 5 10 15 20 1 5 10 15 20
Zo
n
e_
2
0
W
it
h
o
u
t
2.5645 2.6134 2.3604 2.4960 2.3165 33.8666 17.2120 9.0340 7.9289 6.5724
W
it
h
0.0217 0.0217 0.0217 0.0217 0.0217 25.8833 25.8838 25.3747 25.7765 25.6145
Zo
n
e_
8
0
0
W
it
h
o
u
t
2.5648 2.6067 2.4461 2.4921 2.3144 33.6312 17.1398 9.7866 9.3364 6.5543
W
it
h
0.0228 0.0228 0.0228 0.0228 0.0228 25.6590 25.6366 25.7069 25.9070 25.7070
Zo
n
e_
9
0
0
W
it
h
o
u
t
2.5617 2.6076 2.4451 2.4898 2.3224 33.8798 22.0601 15.7620 11.7424 8.3042
W
it
h
0.0233 0.0233 0.0233 0.0233 0.0233 25.8786 25.5579 25.8880 25.8581 25.8003
Zo
n
e_
1
0
0
0
W
it
h
o
u
t
2.5625 2.6088 2.4440 2.4951 2.3187 34.0337 22.2823 15.6451 12.4377 10.5709
W
it
h
0.0238 0.0238 0.0238 0.0238 0.0238 28.7333 29.0153 29.2344 29.4280 29.3860
Low Resolution Video show similar trend as that of G723.1 with respect to the delay metrics for with and without QoS in ATM network as well as for with and without RSVP in IP network.
The delay in High resolution Video with QoS is larger than without QoS for ATM network. The delay in High resolution Video with RSVP is larger than without RSVP for IP network.
High Resolution Video show similar trend to G711 with respect to the delay metrics for with and without QoS in
ATM network as well as for with and without RSVP in IP network.
E. FTP Application
Copyright © 2013 IJECCE, All right reserved 658
International Journal of Electronics Communication and Computer Engineering
Volume 4, Issue 2, ISSN (Online): 2249–071X, ISSN (Print): 2278–4209
Fig.7. Multiple Profile Low Resolution Video Delay without QoS and with QoS/without RSVP and with RSVP
with bck99 (ms)
Fig.8. Multiple Profile High Resolution Video Delay without QoS and with QoS/without RSVP and with RSVP
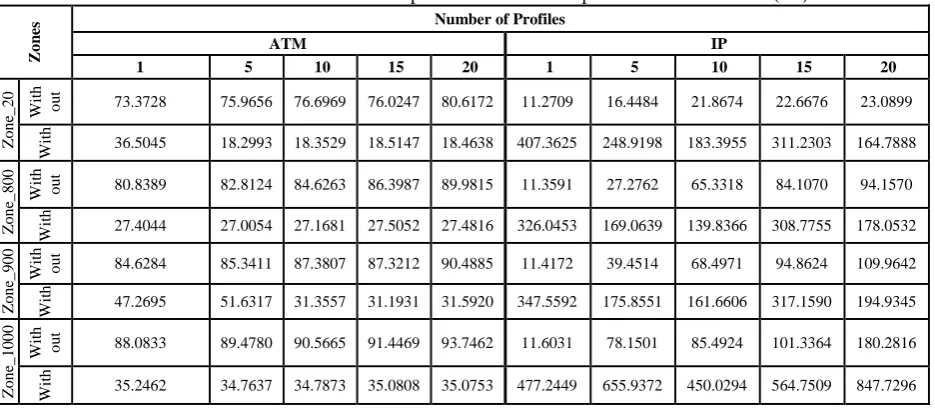
with bck99 (ms) Table V: FTP Low Load Response Time for Multiple Profiles with bck99 (ms)
Z
o
n
e
s
Number of Profiles
ATM IP
1 5 10 15 20 1 5 10 15 20
Zo
n
e
_
2
0 Wit
h
o
u
t
65.9368 67.9267 69.2675 73.2532 74.2532 96.9617 66.9617 17.3837 11.3837 4.8907
W
i
th 33.4521 17.1270 15.8156 15.3139 17.3633 89.7098 93.6808 113.3430 178.9753 192.0044
Zo
n
e_
8
0
0
W
it
h
o
u
t
77.3808 78.4704 76.9737 81.0482 82.3762 144.2982 138.8277 70.4303 13.5123 7.5381
W
it
h
26.4947 25.4286 26.0694 27.0304 25.1506 111.5129 118.4921 124.5197 125.9064 129.4152
Zo
n
e_
9
0
0
W
it
h
o
u
t
78.4863 79.7692 79.7950 82.3894 83.1984 146.1599 142.7321 88.9397 14.1212 8.0605
W
it
h
44.4513 29.6190 30.2570 31.2194 29.3321 156.5374 223.0028 252.8695 258.7362 268.0508
Zo
n
e_
1
0
0
0
W
it
h
o
u
t
81.6750 82.5906 82.7989 83.3480 84.1788 177.3193 166.1542 116.1542 86.8397 17.1982
W
it
h
34.2593 33.4250 34.6219 34.6110 34.1239 410.8374 427.1407 435.3490 473.1793 483.4667
Table VI: FTP High Load Response Time for Multiple Profiles with bck99 (ms)
Z
o
n
es Number of Profiles
ATM IP
1 5 10 15 20 1 5 10 15 20
Zo
n
e_
2
0
W
it
h
o
u
t
551.7777 561.1787 521.1787 437.1937 417.1937 321.5061 278.3006 256.3519 242.3143 212.3142
W
it
h
408.6249 100.0158 69.1046 67.1034 111.6464 323.1334 313.8093 305.2351 293.3371 273.3371
Zo
n
e_
8
0
0
W
it
h
o
u
t
561.0018 564.7977 542.4736 504.9627 495.7758 393.1769 368.3696 288.3696 265.4375 225.4374 0
5 10 15 20 25 30
0 200 400 600 800 10001200
D
el
ay,
s
Zones
ATM_Pro1_bck99
ATM_Pro5_bck99
ATM_Pro10_bck99
ATM_Pro15_bck99
ATM_Pro20_bck99
ATM_Pro1_QoS_bck99
ATM_Pro5_QoS_bck99
ATM_Pro10_QoS_bck99
ATM_Pro15_QoS_bck99
ATM_Pro20_QoS_bck99
IP_Pro1_bck99
IP_Pro5_bck99
IP_Pro10_bck99
IP_Pro15_bck99
IP_Pro20_bck99
IP_Pro1_RSVP_bck99
IP_Pro5_RSVP_bck99
IP_Pro10_RSVP_bck99
IP_Pro15_RSVP_bck99
IP_Pro20_RSVP_bck99
0 5 10 15 20 25 30
0 200 400 600 800 1000 1200
De
la
y
,
s
Zones
ATM_Pro1_bck99
ATM_Pro5_bck99
ATM_Pro10_bck99
ATM_Pro15_bck99
ATM_Pro20_bck99
ATM_Pro1_QoS_bck99
ATM_Pro5_QoS_bck99
ATM_Pro10_QoS_bck99
ATM_Pro15_QoS_bck99
ATM_Pro20_QoS_bck99
IP_Pro1_bck99
IP_Pro5_bck99
IP_Pro10_bck99
IP_Pro15_bck99
IP_Pro20_bck99
IP_Pro1_RSVP_bck99
IP_Pro5_RSVP_bck99
IP_Pro10_RSVP_bck99
IP_Pro15_RSVP_bck99
Copyright © 2013 IJECCE, All right reserved
W
it
h
423.6518 184.6447 120.3561 142.4581 122.2564 329.3464 312.7293 302.7293 294.4044 280.7386
Zo n e_ 9 0 0 W it h o u t
562.2000 569.7692 529.0840 510.0646 500.0816 400.8162 356.7517 286.7517 273.6252 260.6252
W
it
h
427.3310 198.8323 124.5347 146.6253 126.4441 338.4642 318.4642 319.5277 293.5277 292.9942
Zo n e_ 1 0 0 0 W it h o u t
568.5023 564.7570 473.7867 439.0099 397.8943 410.8182 381.6721 328.1062 289.1061 271.2324
W
it
h
432.4961 244.6927 147.2987 147.3096 127.3623 358.4642 338.4642 329.5277 308.0891 306.7892
Fig.9. Multiple Profile FTP Low Load Response Time without QoS and with QoS/without RSVP and with RSVP
with bck99 (ms)
Low Load download response time remains almost same for ATM networks for without and with QoS due to configuration of UBR service category which provides the best effort service.
High Low download response time has similar trend of Low Load download response time for ATM networks for without and with QoS due to configuration of UBR service category which provides the best effort service.
Fig.10. Multiple Profile FTP High Load Response Time without QoS and with QoS / without RSVP and with
RSVP with bck99 (ms)
F. EMail Application
The Download Response Time for EMAIL Low Load multiple profileswith data rate of OC3 for ATM and 100 Mbps for IP networkfor without QoS and with QoS / without RSVP and with RSVP are tabulated as in Table 7,Table 8 and the corresponding graph isas shown in Fig.11 and Fig.12 respectively.
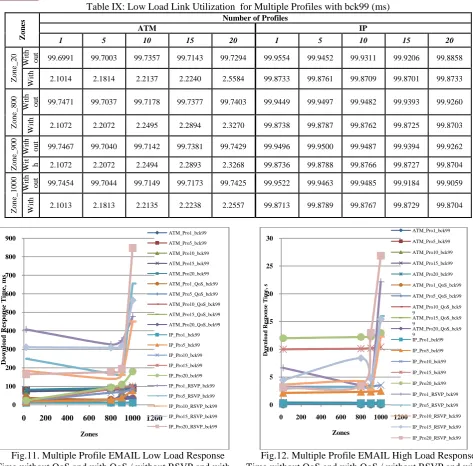
Table VII: EMAIL Low Load Response Time for Multiple Profiles with bck99 (ms)
Z
o
n
es Number of Profiles
ATM IP
1 5 10 15 20 1 5 10 15 20
Zo n e_ 2 0 W it h o u t
73.3728 75.9656 76.6969 76.0247 80.6172 11.2709 16.4484 21.8674 22.6676 23.0899
W
it
h
36.5045 18.2993 18.3529 18.5147 18.4638 407.3625 248.9198 183.3955 311.2303 164.7888
Zo n e_ 8 0 0 W it h o u t
80.8389 82.8124 84.6263 86.3987 89.9815 11.3591 27.2762 65.3318 84.1070 94.1570
W
it
h
27.4044 27.0054 27.1681 27.5052 27.4816 326.0453 169.0639 139.8366 308.7755 178.0532
Zo n e_ 9 0 0 W it h o u t
84.6284 85.3411 87.3807 87.3212 90.4885 11.4172 39.4514 68.4971 94.8624 109.9642
W
it
h
47.2695 51.6317 31.3557 31.1931 31.5920 347.5592 175.8551 161.6606 317.1590 194.9345
Zo n e_ 1 0 0 0 W it h o u t
88.0833 89.4780 90.5665 91.4469 93.7462 11.6031 78.1501 85.4924 101.3364 180.2816
W
it
h
35.2462 34.7637 34.7873 35.0808 35.0753 477.2449 655.9372 450.0294 564.7509 847.7296 0 50 100 150 200 250 300 350 400 450 500
0 200 400 600 800 1000 1200
D o w n lo a d R e sp o ns e T im e , m s Zones ATM_Pro1_bck99 ATM_Pro5_bck99 ATM_Pro10_bck99 ATM_Pro15_bck99 ATM_Pro20_bck99 ATM_Pro1_QoS_bck99 ATM_Pro5_QoS_bck99 ATM_Pro10_QoS_bck9 9 ATM_Pro15_QoS_bck9 9 ATM_Pro20_QoS_bck9 9 IP_Pro1_bck99 IP_Pro5_bck99 IP_Pro10_bck99 IP_Pro15_bck99 IP_Pro20_bck99 IP_Pro1_RSVP_bck99 IP_Pro5_RSVP_bck99 IP_Pro10_RSVP_bck99 IP_Pro15_RSVP_bck99 50 150 250 350 450 550 650
0 200 400 600 800 1000 1200
Copyright © 2013 IJECCE, All right reserved 660
International Journal of Electronics Communication and Computer Engineering
Volume 4, Issue 2, ISSN (Online): 2249–071X, ISSN (Print): 2278–4209
Table IX: Low Load Link Utilization for Multiple Profiles with bck99 (ms)
Z
o
n
es Number of Profiles
ATM IP
1 5 10 15 20 1 5 10 15 20
Zo
n
e_
2
0
W
it
h
o
u
t
99.6991 99.7003 99.7357 99.7143 99.7294 99.9554 99.9452 99.9311 99.9206 99.8858
W
it
h
2.1014 2.1814 2.2137 2.2240 2.5584 99.8733 99.8761 99.8709 99.8701 99.8733
Zo
n
e_
8
0
0
W
it
h
o
u
t
99.7471 99.7037 99.7178 99.7377 99.7403 99.9449 99.9497 99.9482 99.9393 99.9260
W
it
h
2.1072 2.2072 2.2495 2.2894 2.3270 99.8738 99.8787 99.8762 99.8725 99.8703
Zo
n
e_
9
0
0
W
it
h
o
u
t
99.7467 99.7040 99.7142 99.7381 99.7429 99.9496 99.9500 99.9487 99.9394 99.9262
W
it h 2.1072 2.2072 2.2494 2.2893 2.3268 99.8736 99.8788 99.8766 99.8727 99.8704
Zo
n
e_
1
0
0
0
W
it
h
o
u
t
99.7454 99.7044 99.7149 99.7173 99.7425 99.9522 99.9463 99.9485 99.9184 99.9059
W
it
h
2.1013 2.1813 2.2135 2.2238 2.2557 99.8713 99.8789 99.8767 99.8729 99.8704
Fig.11. Multiple Profile EMAIL Low Load Response Time without QoS and with QoS / without RSVP and with
RSVP with bck99 (ms)
Fig.12. Multiple Profile EMAIL High Load Response Time without QoS and with QoS / without RSVP and with
RSVP with bck99 (ms) Table X: High Load Link Utilization for Multiple Profiles with bck99 (ms)
Z
o
n
e
s
Number of Profiles
ATM IP
1 5 10 15 20 1 5 10 15 20
Zone_20 W
it
h
o
u
t
99.4648 99.4715 99.4790 99.4795 99.4805 99.9101 99.8034 99.6870 99.6805 99.5727
W
it h 4.1555 4.2555 4.2752 4.2842 4.3970 99.9101 99.8034 99.6870 99.6805 99.5727
Zone_800 W
it
h
o
u
t
99.5484 99.4843 99.4889 99.5300 99.5100 99.9086 99.8604 99.8113 99.7273 99.6987
W
it
h
4.1553 4.2533 4.2663 4.2693 4.3770 99.9086 99.8604 99.8113 99.7273 99.6987
Zone_900 W
it
h
o
u
t
99.5470 99.4844 99.4826 99.5302 99.5131 99.9096 99.8603 99.8113 99.7397 99.7464
W
it
h
4.1553 4.2532 4.2652 4.2691 4.3765 99.9096 99.8603 99.8113 99.7397 99.7464
Zone_1000 W
it
h
o
u
t
99.5467 99.4841 99.4823 99.4889 99.5130 99.9085 99.8214 99.6938 99.6308 99.6496
W
it
h
4.1553 4.2532 4.2536 4.2625 4.3765 99.9085 99.8214 99.6938 99.6308 99.6496 0
100 200 300 400 500 600 700 800 900
0 200 400 600 800 1000 1200
D
o
w
n
lo
a
d
R
e
sp
o
n
se
T
im
e
,
m
s
Zones
ATM_Pro1_bck99 ATM_Pro5_bck99 ATM_Pro10_bck99 ATM_Pro15_bck99 ATM_Pro20_bck99 ATM_Pro1_QoS_bck99 ATM_Pro5_QoS_bck99 ATM_Pro10_QoS_bck99 ATM_Pro15_QoS_bck99 ATM_Pro20_QoS_bck99 IP_Pro1_bck99 IP_Pro5_bck99 IP_Pro10_bck99 IP_Pro15_bck99 IP_Pro20_bck99 IP_Pro1_RSVP_bck99 IP_Pro5_RSVP_bck99 IP_Pro10_RSVP_bck99 IP_Pro15_RSVP_bck99 IP_Pro20_RSVP_bck99
0 5 10 15 20 25 30
0 200 400 600 800 1000 1200
D
o
wn
loa
d
R
es
p
o
n
se
T
im
e,
s
Zones
ATM_Pro1_bck99 ATM_Pro5_bck99 ATM_Pro10_bck99 ATM_Pro15_bck99 ATM_Pro20_bck99 ATM_Pro1_QoS_bck99 ATM_Pro5_QoS_bck99 ATM_Pro10_QoS_bck9 9
ATM_Pro15_QoS_bck9 9
ATM_Pro20_QoS_bck9 9
Copyright © 2013 IJECCE, All right reserved Email Download response time has same trend as that
of FTP download response time for both low and high load. It is observed that the download response time for ATM networks is lesser as compared with IP networks.
G. Link Utilization
Fig.13. Multiple Profile bck99 Low Load Utilization without QoS and with QoS / without RSVP and with
RSVP (s)
It is observed that utilization of link is almost independent of distance in ATM. For bck99 without QoS/RSVP both the networks utilize maximum resource about 98%, but with QoS/RSVP utilization of ATM is 2% when compared to IP which is 99%.
Fig.14. Multiple Profile bck99 High Load Utilization without QoS and with QoS / without RSVP and with
RSVP (s)
For multiple profiles, it is observed that utilization of link is independent of distance in ATM. For bck99 without QoS/RSVP both the networks utilize maximum resource, but with QoS/RSVP utilization of ATM is 4% when compared to IP which is 99%. IP utilizes more resources because number of packet is large in case of IP and predicts the best available path when compared to ATM. Relatively less utilization of ATM does not mean inefficiency. However, it will be benefitted at the time of congestion.
IV. C
ONCLUSIONSWith increasing number of profiles, variation in end-to-end delay is almost constant since jitter is in nanoseconds and milliseconds for ATM and IP network respectively.
The larger response time is due to the fact that FTP and Email uses UBR service category in ATM network which is given the least priority amongst multimedia. The response time decreases for IP with increasing number of profiles due to connectionless nature.
R
EFERENCES[1] Dr.S.S Riaz Ahamed: “The Role of ATM Technology in Future Data Communication Systems”, Journal of Theoretical and
Applied Information Technology, 2005-2008 JATIT, pp.624-628.
[2] Farhad Pourreza: “Impact of QoS on Application Response Time”, International Journal: Mathematical Manuscripts, vol. 1,
No 1, 2007, pp 174-179.
[3] G S Sunitha , Suresh Chandra Mohan, “A study of Quality of Service in high speed ATM Networks”, Proceedings of the
National Conference on Computer Networks(NCCN 2009), Reva Institute of Technology & Management, Bangalore, pp. 105-107, Feb 2009.
[4] GSSunitha,Suresh Chandra Mohan,“Performance Comparison of CODEC for ATM Networks using OPNET”, Proceedings
National Conference on Electronics, Communications and Computers(NCECC 2009), IETE Navi Mumbai subcentre, pp. 59-61, Feb 2009.
[5] GSSunitha,SureshChandra Mohan, “Performance Comparison of
ATM and IP Network for Multiple Profiles using OPNET
Simulator”,International Journal on Communications Antenna and Propagation (IRECAP), ISSN 2039-5086 Vol 1, No.5, Oct 2011,pp 471-477, Italy.
[6] J.Y.Hui: “Resource Allocation for Broadband Networks”, IEEE
Journal on Selected Areas in Communications, Vol.6, No.9, Dec 1998, pp.1598-1608.
[7] Jason Schreiber, Mehrdad Khodai Joopari and M.A. Rashid,
“Performance of Voice and Video Conferencing over ATM and Gigabit Ethernet Backbone Networks”, Res. Lett. Inf. Math. Sci.,
vol.7, 2005, pp19-27.
[8] Kotikalapudi Sriram, and Yung-Terng (Y.T.) Wang, “Voice over
ATM Using AAL2 and Bit Dropping: Performance and Call
Admission Control”, IEEE Journal on Selected Areas in
Communications, Vol. 17, No. 1, January 1999
[9] P Indumathi, S Shanmugavel and HC Mahesh: “Buffer Leaky
Bucket Algorithm for Congestion Control in ATM Networks”,
IETE Journal of Research, Vol.48, No 1, Jan-Feb 2002, pp59-67. [10] Parag Jain Sandip Vijay, S.C. Gupta : “ATM Network QoS Parameters and performance analysis using OPNET Simulator”,
International Journal of Recent Trends in Engineering, Vol 2,No.4,Nov 2009, pp 228-231.
[11] R. Guerin, H. Ahmadi and M. Naghshineh: “Equivalent Capacity
and its Application to Bandwidth Allocation in High Speed
Network”, IEEE Journal on Selected Areas of Communications,
Vol.9, No.7, Sept 1991, pp. 968-981. 0
10 20 30 40 50 60 70 80 90 100
0 200 400 600 800 1000 1200
%
U
ti
li
za
ti
o
n
Zones
ATM_Pro1_bck99
ATM_Pro5_bck99
ATM_Pro10_bck99
ATM_Pro15_bck99
ATM_Pro20_bck99
ATM_Pro1_QoS_bck99
ATM_Pro5_QoS_bck99
ATM_Pro10_QoS_bck99
ATM_Pro15_QoS_bck99
ATM_Pro20_QoS_bck99
IP_Pro1_bck99
IP_Pro5_bck99
IP_Pro10_bck99
IP_Pro15_bck99
IP_Pro20_bck99
IP_Pro1_RSVP_bck99
IP_Pro5_RSVP_bck99
IP_Pro10_RSVP_bck99
IP_Pro15_RSVP_bck99
IP_Pro20_RSVP_bck99
0 10 20 30 40 50 60 70 80 90 100
0 200 400 600 800 1000 1200
%
U
tiliz
a
ti
o
n
Zones
Copyright © 2013 IJECCE, All right reserved 662
International Journal of Electronics Communication and Computer Engineering
Volume 4, Issue 2, ISSN (Online): 2249–071X, ISSN (Print): 2278–4209
[12] Shivkumar Kalyanaraman, Raj Jain, Sonia Fahmy and Rohit
Goyal: “Performance and Buffering Requirements of Internet Protocols over ATM ABR and UBR Services”, IEEE
Communications Magazine, Vol. 36, No.6, 1998, pp.152-157. [13] Xiangqian Yu and Jun Shao: “ATM Network Simulation with
OPNET”, EE5570: Communication Networks, Course Project
Report, Dec 2002.
A
UTHOR’
SP
ROFILEDr. G.S. Sunitha
born in Davangere,Karnataka, India on18th Feb.1967. Obtained B.E Degree from the department of Electronics & Communication Engineering [ University of Mysore], Davanagere , Karnataka in
1990, Master’s degree in Digital Electronics &
Advanced Communication from Karnataka Regional Engineering College [Mangalore University, Surathkal, Karnataka in 1996 & Doctoral degree from university B.D.T College of Engineering [ Kuvempu University], Davanagere in 2011. Research interests include computer communication & networking, digital signal processing, information theory coding and hardware descriptive language.
She is presently Professor & Head, Department of Electronics & Communication Engineering, Bapuji Institute of Engineering & Technology, Davanagere, Karnataka, India. . She has published one paper in International Journal & presented paper in two National Conferences. She has teaching experience of 22 years at under graduate level. She has authored two books, Digital Telephony and Error Control Coding, under Ministry of Human Resource & Development, India. Dr. Sunitha is a Life Member of ISTE &M IETE.
Dr. Suresh Chandra Mohan
obtained his B.E from Mysore University, M.E from Madras University & PhD from University of Roorkee. His area of interest are Digital Communication, Information Coding Theory, Signal Processing, Logic Design and Computer Networking
Presently he is working as principal of PESIT college of Engineering, Shivamogga, Karnataka, India. He has a total academic experience of 41 years and worked at different administrative levels as Head of the. Department & Chairman in Department of Studies in Electronics & Communication Engineering, Dean Academic & Principal of U.B.D.T.C.E., Davangere, Karnataka, India. He has guided many M.Tech. students and Three PhD scholars. He has served publication in national and international conferences/ Journals.