World Journal of Advanced Research and Reviews
e-ISSN: 2581-9615, Cross Ref DOI: 10.30574/wjarrJournal homepage:https://www.wjarr.com
Corresponding author
E-mail address:
Copyright © 2020 Author(s) retain the copyright of this article. This article is published under the terms of the Creative Commons Attribution Liscense 4.0. (RESEARCH ARTICLE)
Some aspects of associations and interactions between biomedical variables
Alrawi Rakhad Abdulrazak 1, *, Abdulrahman Jubran Mohamed 2, Al-Rawi Rafal Abdulrazaq 3 and Al-Rawi Raafat Abdulrazak 4
1 Grand Canyon University, Arizona, USA.
2 Center of Research and Educational Studies, Ministry of Education, Iraq.
3 Deptartment of Pathology, Hawler Medical University, Erbil, Kurdistan, Iraq.
4 ArlövKronetorpsvägen 2 (Burlöv Center), Malmo, Swede.
Publication history: Received on 12 January 2020; revised on 25 January 2020; accepted on 27 January 2020
Article DOI: https://doi.org/10.30574/wjarr.2020.5.1.0018
Abstract
The objective of this text is to investigate the association between biomedical variables using Fisher’s exact test as non-parametric tests. In common applications of Fisher’s exact test, one can find the associations between categorical variables through calculation the probability of significance. For the purpose of illustration, represented different levels of categorical variables, several contingency tables were simulated for the investigation the associations as well as interactions between biomedical variables. The results of Fisher’s exact test indicated some discrepancy between statistical and biological issues, which may indicate that some statistical result may not match biological features. The results presented in 13 Figures showed plots of descriptive variables (gender and disease incidence). The association pattern is more obvious when the lines representing the sex in the plots are not parallel; these imply that there is an interaction effect between gender and diseases incidence. Whereas, when the lines were parallel, these indicate no interaction. It was concluded that the non-significant biometric association between biomedical variables need precise biological understanding of the mode of action, and that further investigations are needed.
Keywords: Biomedical variables; Association; Interaction;
1. Introduction and justification
Medicineis thescience and practice of establishing the diagnosis, prognosis, treatment, and prevention of diseases.
Medicine is general term includes biomedical science, biomedical research, medical technology, and medical statistics. Medical statistics deals with applications ofstatistics to medicine and clinical research. It is the science of collecting, summarizing, presenting and interpreting data in medical practice, as well as using them to estimate the magnitude of associations and test hypotheses. Medical research, experiment design, and statistics are to be unified in order to get better understanding of the results [1].During our statistical analysis, to investigate comparison of the proportions of categorized variables (the prevalence level of Helicobacter pylori: low, moderate or high) of gastritis in males and females using a Fisher's exact test of independence, some results were found not realistic. The results of Fisher’s exact test did not show significant associations between gender and disease incidence for data without interaction, although both sexes have similar linear trends indicating the magnitude and direction of each sex value depend on the value of
the other variable, which should come up with a significant association between gender and diseases incidence. Such
contradictory between statistical and biological outcomes may indicate that some statistical result may not match
biological background. It was reported that “Fisher's test is said to be exact, but some say it providesan exact answer
96 1.1.Biological variables
Identification and description of variables used in biomedical research is a necessary component. Research question, objectives and rational are the steps in any research work. Depending on the data collected, researchers decide what the statistical methods to be used for analysis [3]. Researchers have to be familiar with the variety of variables involved for result presentation. Information collected about a sample of patients comprises characteristics which vary among the patients, such as age, sex, body temperature, blood glucose level, blood group, blood pressure, pulse rate, severity of disease (mild, moderate, severe), and sensitive/resistance to diseases are some examples for biological variables. A basic distinction among these variables is their quantitative or qualitative (categorical) measurements. Quantitative variables are those which can be measured quantitatively (numerically), such as blood pressure, glucose level, as well as other biochemical variables namely {glutathione-S-transferase activity (GST), super oxide dismutase activity (SOD), glutathione reductase activity (GR), catalase activity (Cat), total antioxidant activity (TAC) and malondialdehyde (MDA), Creatinine (Creat), Alanine Aminotransferase (ALT), AST, Gamma-Glutamyl transferase}. In statistics, these variables represent continuous variables. Furthermore, discrete variables (discontinuous variable usually counts) can take only few numbers of values, such number of children in a family, number of patients visited a clinic per day. On the other hand, qualitative (categorical) variables may have two or more categories such as sex (male/female), alive/dead, blood group (A/B/O), genotypes (AA/Aa/aa), and stages of a disease (stage I to stage IV). Usually, for data analysis, categories are coded as numerical values (e.g., 1 for male, 2 for female). Qualitative variables are summarized through counting (frequency) and percentage. Data for two or more categorical variables may be presented in the form of a contingency table showing count, frequency and percentages. Furthermore, it is possible to convert a measurement variable to categorical ones, dividing individuals up into a two or more classes based on ranges of the variable. Many researchers convert quantitative continuous variables to categorical ones using “Cut-points”. Instead of presenting the mean fasting glucose level, one may prefer to present the proportion of diabetics in population using a fasting glucose level of 110 mg/dL as the cut-point to categorize the subjects as diabetic/ non-diabetic. Other example if researchers are studying the relationship between levels of HDL (the "good cholesterol") and blood pressure, you could measure the HDL level, then divide people into two groups, "low HDL" (less than 40 mg/dl) and "normal HDL" (40 or more mg/dl) and compare the mean blood pressures of the two groups. Converting measurement variables to categorical variables, if you split into two groups, "categorizing" in general is common in medicine. For example, in a population one measured the variable systolic blood pressure in a sample of 40 males and 40 females, and the null hypothesis is “Males and females have the
same systolic blood pressure”. One would compare the mean blood pressure in males and females with a two-sample t
-test (parametric -test). But if the variable is converted to hypertension status (hypertensive/normal), as qualitative (categorical) variable, then researcher can compare the hypertension frequencies in males and females with a Chi-square test or Fisher’s exact test (non-parametric test). However, statistical analysis of quantitative continuous variables give more accurate and precise compared for categorizing variables. That’s to say that by categorizing measurement variables, researchers may have made an obvious, highly significant relationship between variables become completely non-significant [3, 4].
1.2.Statistical analysis of data
97 1.3.Association and interaction
It is very important to understand relationship between variables to draw the right conclusion from a statistical analysis. The relationship between biomedical variables determines how the right conclusions are reached. Without an understanding of this, one may fall into many pitfalls that accompany statistical analysis and infer wrong results from the data. There are several different kinds of relationships between variables. Before drawing a conclusion, one should first understand how one variable changes with the other. How the variables are related, is the relationship linear or quadratic or inverse or logarithmic or something else? There could be a number of indirect consequences and deducing cause and effect can be challenging. Correlation between variables can be positive or negative. Positive correlation implies an increase of one quantity causes an increase in the other whereas in negative correlation, an
increase in one variable will cause a decrease in the other. Association between two variables means the values of one
variable relate in some way to the values of the other. Association is usually measured by correlation for two continuous
variables and by cross tabulation and a Chi-square test or Fisher’s exact test for categorical variables. Essentially,
association means the values of one variable generally co-occur with certain values of the other. The direction of
association would always depend on the variables that you have whether both variables are moving in one direction or
either of the variables are going in opposite directions. On the other hand, an interaction between two variables means
the effect of one of those variables on other variable is not constant (the effect differs at different values of the other) [3 - 6].
2.
Methodology
Due to some results in statistical analysis of my experimental data were found to be not realistic using a Fisher's exact test of independence, as we were not satisfied, the authors were ambition to learn more and more about the test and why some results did not sound realistic. Therefore, we took the initiative to simulate some contingency tables for statistical analysis to mimic the real medical data. Many 2x2 and 2x3 contingency tables have been formed and built up to figure out the association between biomedical variables. It was focused on gender and disease incidence as a sample and model for the present study. The null hypothesis (Ho) of this study assumed that males and females have similar susceptibility or resistance to a particular disease. Statistical Analysis was done by using GraphPad Software statistical package computer software. Fisher’s exact test was used to calculate the significant differences between studied variables. A probability value of less than 0.05 was considered statistically significant (probability of rejection of null hypothesis when it’s in fact true). Simulated data were plotted on Microsoft Excel Worksheet. The patterns of the plots were moved to Microsoft Word [2].
3.
Results and discussion
The results come up with 13 Figures showing plots of the descriptive statistics (gender and number of disease incidence) as medical models manipulated in this study to investigate the associations of a 2x2 and a 2x3 contingency tables using Fisher's exact test. The probability values are presented in each plot. The plots are obvious when the lines representing the sex in the plot are not parallel; this implies there is an interaction effect between gender and diseases incidence. When the lines are parallel these indicate there were no interaction (no statistical significant interaction). The patterns of the plots were presented and discussed in 5 scenarios, as follow:
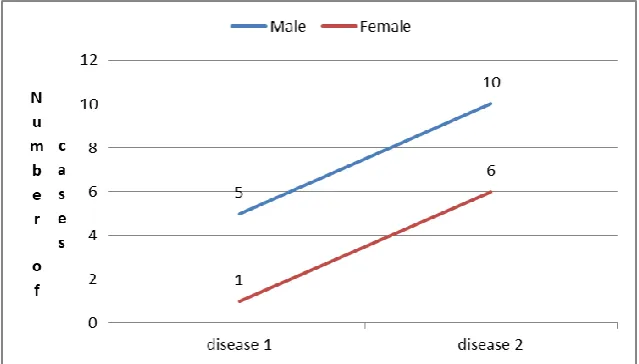
3.1.First scenario: No associations and no interactions between biomedical variables:
98 Figure 1 A plot of a 2x2 contengency table of disease incidence and gender
(Similar trend, no interaction, P = 0.6158)
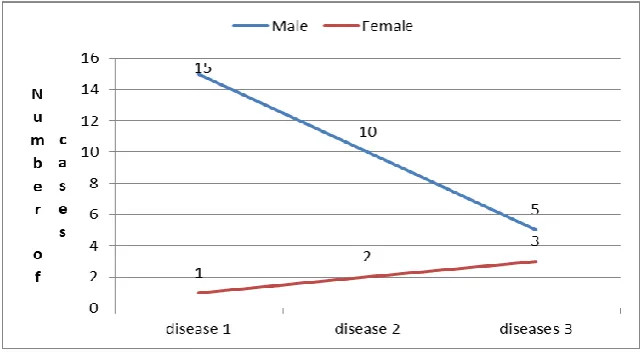
Figure 2 A plot of a 2x3 contengency table of disease incidence and gender
(Similar trend, no interaction, P = 0.9336)
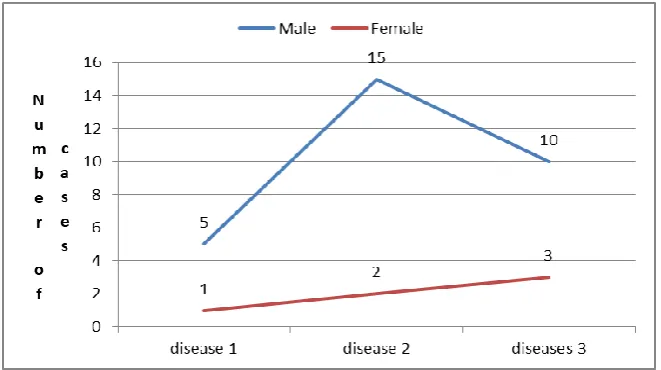
3.2.Second scenario: No associations between biomedical variables, but interactions exist without changing rank of sex:
99 Figure 3 Number of diseases incidence of the male and female cases (Different trends, interaction with out change in
rank, P = 0.5282).
Figure 4 Number of diseases incidence of the male and female cases (Different trends, interaction with out change in rank, P = 0.3962).
100 Figure 6 Number of diseases incidence of the male and female cases (Different trends, interaction with out change in
rank, P = 0.8366)
Figure 7 Number of diseases incidence of the male and female cases (Different trends, interaction with out change in rank, P = 0.7177)
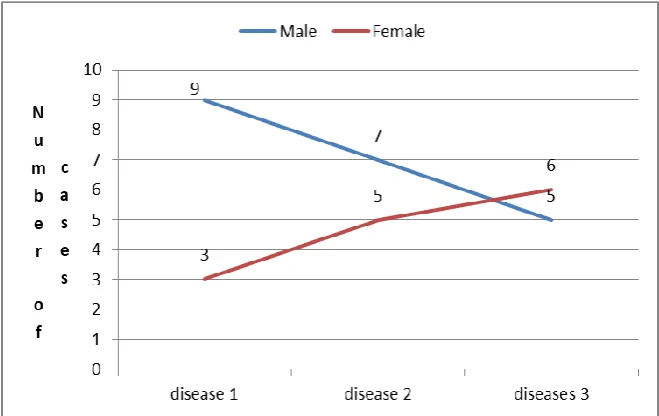
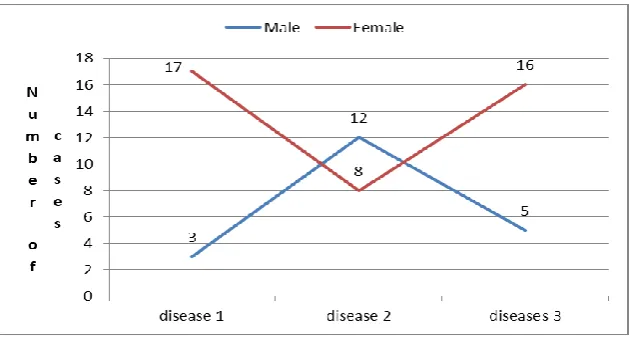
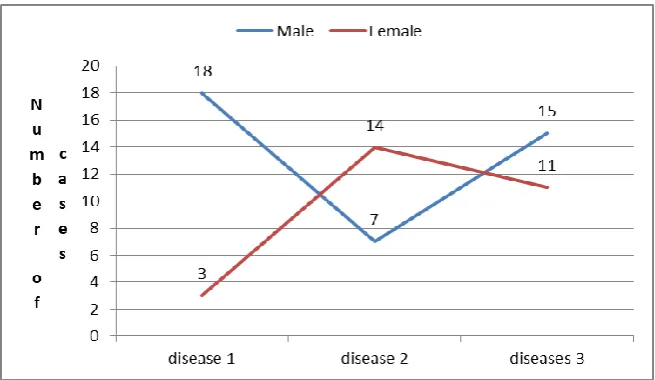
3.3.Third scenario: No associations between biomedical variables, but interactions exist with changing rank of sex:
101 Figure 8 Number of diseases incidence of the male and female cases (Different trends, interaction exist and change in
rank, P = 0.5136).
Figure 9 Number of diseases incidence of the male and female cases (Different trends, interaction exist and change in rank, P = 0.3906)
3.4.Fourth scenario: Both associations and interactions exist between biomedical variables
102 Figure 10 Number of diseases incidence of the male and female cases (Different trend, interaction with change in
rank, P = 0.0014).
Figure 11 Number of diseases incidence of the male and female cases (Different trend, interaction with extreme change in rank, P = 0.0029).
103 Figure 13 Number of diseases incidence of the male and female cases (Different trend, interaction with extreme
change in rank, P = 0.0023).
4.
Final remark
During many attempts of various data combinations of a 2x2 and 2x3 contingency tables, results of Fisher’s exact test did not show significant associations between gender and disease incidence for data without interaction. It is surprise, although both sexes have similar linear trends indicating additive pattern, and refers to a situation where both the magnitude and direction of each variable's value can depend on the value of the other variable, which should come up with a significant association betweengender and diseases incidence
.
In other words, this indicating each sex is responding to disease incidence in a similar way, indicating that both sexes have similar linear trends and should have biological background and cause. Once again, the discrepancy between statistical and biological outcomes may indicate that some time statistical result may not match biological issue. The scenario that showed “associations exist and no interactions between biomedical variables” phenomena must be discussed by biostatistician and medical researchers.5.
Conclusion and suggestion
It is concluded that integrated multidisciplinary team (statisticians, biologists, physicists, and pathologists) should work together in medical research activities to have more efficient and tangible impact on better interpreting and understanding statistical results.
Compliance with ethical standards
Acknowledgments
The authors express their thanks to Prof. Dr. Abdulrazaq Abdulhamid for his help in statistical manipulation. Acknowledgments must be inserted here.
Disclosure of conflict of interest
The authors declare that they have no conflicts of interest.
References
[1] Rafal A. (2017). Is medical research at the right track? Global Journal of Medical Research. K Interdisciplinary,
16(6), 1-7.
[2] GraphPad Software, Inc. (2018). 7825 Fay Avenue, Suite 230, La Jolla, CA 92037 USA.
[3] Barbara I and Susan D. (2018). Introductory Statistics. Rice University. Houston, Texas 77005. OpenStax.org.
104
[5] Wikipedia, The free encyclopedia. (2019). Association (Statistics).
[6] KarenG. (2019). The Difference between Interaction and Association.
How to cite this article