VOLTAMMETRIC CHARACTERIZATION OF THE BEHAVIOR OF
BIOLOGICALLY ACTIVE COMPOUND ENOXIL IN VARIOUS MEDIA
Gheorghe Nem
ţ
oi
1*, Tudor Lupa
ş
cu
2, Alexandra Ciomaga
1, Alexandru Cecal
11 A.I.Cuza University, Faculty of Chemistry, 11-Carol 1 Bvd, 7000506- Iasi, Romania
2 Institute of Chemistry of ASM, 3. Academiei str, Chisinau, 2028 MD, R. Moldova
E-mail: [email protected], tel.+40232201334, fax.+40232201313
Abstract. This paper presents the results of scientifi c research related to the electrochemical behavior of the complex preparation, Enoxil. It was established that the oxidation-reduction process of Enoxil is quasireversible. The reactivity of Enoxil obtained from alcohol soluble enotannins is more pronounced, compared to that obtained from standard enotannins. The dependence of cathodic current intensity on Enoxil concentration is linear. This can be used to establish Enoxil concentration in solution. Cyclic voltammograms were used to establish reduction and oxidation potential and the formal redox potential on platinum electrode in sodium perchlorate aqueous environment. These features can be used for identifi cation and determination of Enoxil in pharmaceuticals.
Keywords: complex biologically active compound Enoxil, cyclic voltammetry, standard redox potential, dosage of
pharmaceuticals.
Introduction
Domestic and imported drugs are subjected to a rigorous control of their correspondence with the quality indices set out in The Analytical and Normative Documentation.
For the identifi cation and determination of pharmaceutical substances in drugs a number of physical, physico-chemical and physico-chemical methods are currently used. The most common physical and physico - physico-chemical methods used for identifi cation and determination of active substance in drugs are IR spectroscopy, UV/Vis, mass spectroscopy, atomic spectroscopy, nuclear magnetic resonance spectroscopy, chromatographic methods, electrochemical methods, etc.
Enoxil is a mixture of substances of natural origin obtained at oxidation of grape seed tannins [1]. As a result of chemical oxidation processes, the breaking of polymer chain takes place in enotannins forming new compounds containing carboxyl, peroxide, alcoholic, aldehyde, ketone, ether, ester, and other functional groups. These new compounds are soluble in water and have an astringent taste. The presence of functional groups listed above has been demonstrated by acid-base titration, and spectral methods [2]. The purpose of the research presented in the current paper is to study the voltammetric behavior of Enoxil.
Electrochemical methods are commonly used in analysis of food tocopherons. Resulted tocopherylquinones give reduction polarographic waves with heights proportional to concentrations, which allows the determination of tocopherol in the initial samples [3]. The synthetic phenolic antioxidants such as Vitamin E and provitamin A can also be detected by electrochemical methods [4-6]. Due to the presence of electroactive groups in natural and synthetic oxidants molecules, the electroanalytical complex evaluation of charge transfer capabilities provides extremely valuable information on the mechanism of reactions involving these compounds in the process of preventing the degradation caused by oxidative stress [7]. Biologically active compound Enoxil exhibits signifi cant antioxidant properties [8].
Experimental
Six types of Enoxil were taken into the study, labeled as follows: E1- homogenized Enoxil for Î.M. Farmaco S.A. 2009;
E2- Enoxil homogenized on 13.XI.2009;
E3- Enoxil from standard enotannins with μW, 24.03.2010; E4- Enoxil from standard enotannins without μW, 25.03.2010; E5- Enoxil from enotannins alcohol solution with μW, 24.03.2010; E6- Enoxil from enotannins alcohol solution without μW, 25.03.2010.
The cyclic voltamogram (CV) was drawn using the working electrode (WL), platinum disc electrode
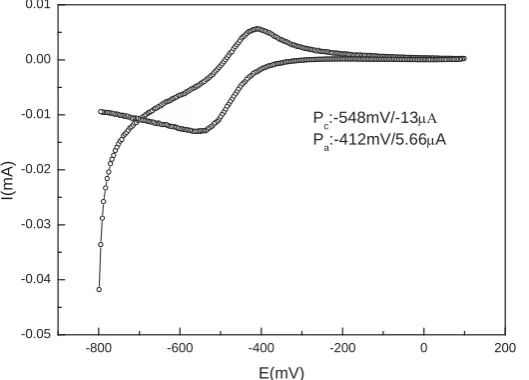
(EDPt-Φ2mm), reference electrode, SCE (saturated calomel electrode) and the auxiliary electrode (AE), platinum wire electrode, connected to the Electrochemical Combine VoltaLab 32 (Radiometer Copenhagen) and provided with software VoltaMaster2 [9.10], the working temperature being 25 °C. As a result, was obtained a CV characteristic to quasireversible processes, shown in Figure 1. The values of potential are all determined using the SCE used as reference. In order to perform the pH and electroconductivity measurements, the electrochemical multimeter Consort 831 (Belgium) was used.
-800 -600 -400 -200 0 200 -0.05
-0.04 -0.03 -0.02 -0.01 0.00 0.01
P
c:-548mV/-13P$ Pa:-412mV/5.66PA
I(m
A
)
E(mV)
Fig. 1. Cyclic voltamogram of E1 in ITBA at scan speed of 50mV/s
By further introducing volumes of 0.3mL of E1, the solution becomes more opalescent, thus confi rming the tendency of precipitate formation, voltammetric results obtained are presented in Table 1.
Results and discussions
Table 1
Cyclic voltammetry characteristics for E1 in ITBA at different concentrations and scan speed of 50mV / s
102c (g/100mL)
ECD (mV)
EPC (mV)
IPC (μA)
EPA (mV)
IPA (μA)
4.95 127 -548 -13.0 -412 5.66
9.80 125 -648 -20.4 -388 4.71
14.56 123 -676 -28.3 -360 4.74
19.23 120 -723 -34.6 -340 4.19
23.81 122 -735 -42.0 -328 4.24
The following conclusions may be drawn from table 1:
- open-circuit potential values (ECD) change very little with increasing concentration of E1, proving that no adsorption phenomena take place on the surface of EL;
- shift of the cathodic peak potential (EPC) to more negative values and of the anodic peak potential (EPA) towards more positive values , with increasing Enoxil concentration shows that complexation phenomena occur;
0.0 5.0x10⁻²
1.0x10⁻¹
1.5x10⁻¹
2.0x10⁻¹
2.5x10⁻¹ -4.5x10⁻⁵
-4.0x10⁻⁵ -3.5x10⁻⁵ -3.0x10⁻⁵ -2.5x10⁻⁵ -2.0x10⁻⁵ -1.5x10⁻⁵ -1.0x10⁻⁵
R=-0.99962 I(A)=-5.5005x10⁻⁶-1.5314x10⁻⁴c(gE
1/100mL)
I(
A
)
c(gE1/100mL)
Fig. 2. Dependence of the cathodic current intensity on Enoxil concentration (E1) in alcohol solution of ITBA
Considering all mentioned above on the voltammetric behavior of Enoxil in alcoholic solution of tetrabutylammonium iodide on platinum electrode, its determination on the basis of the cathodic process can be recommended, using the calibration graph (Fig. 2).
On acidifi cation of solution with HClO4 at a pH below 2.6, no cathodic peak can be revealed (there is a continuous decrease of cathode current), hazing of the solution is more obvious due to the formation of a yellowish precipitate. By alkalinization of the solution with NaOH to pH 8.8 the precipitate darkens, yellow fl akes are present, and the CV doesn’t present any peaks. The electroreduction process evidenced for the considered above system, may be due to the presence of peroxide group in Enoxil, which is reduced, process facilitated by the presence of iodide ion in the electrolytic background.
In order to avoid the infl uence of the electrolytic background, we will consider an aqueous solution 0.1M of NaClO4 with pH=5.5 and electronegativity 10.78 mS/cm and using VoltaLab32 we will draw the CV in the range -800÷1200÷-800 with a scan speed of 50 mV/s.
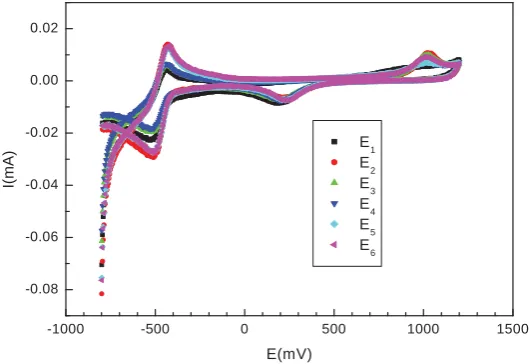
The solutions with 5% (5g Enoxil/100mL solution) were prepared of each type of Enoxil, of which were taken volumes of 0.3mL or 1.0mL (at the end for the last addition) that were added to 30mL 0.1M solution NaClO4 and CV were drawn, at working temperature of 25 °C. Removing oxygen from the solution was achieved by bubbling nitrogen for 5 minutes before plotting the voltamogram. Figure 3 presents the CV obtained for the most diluted solutions of Enoxil (4.95x10⁻²%) and Figure 4 - the 6 types of Enoxil of conc. 19.23x10⁻²%.
-1000 -500 0 500 1000 1500
-0.08 -0.06 -0.04 -0.02 0.00 0.02
I(
mA
)
E(mV) E1 E2 E3 E4 E5 E6
Figure 3 shows that overlapping peaks found in the positive range of potentials can be attributed to electrolytic background, while in the negative range of potentials, the anodic peak coupled with the cathodic one, reveals a quasireversible redox process characteristic to Enoxil. The variation in peak intensities of the anodic processes (IPA) is different from the cathodic ones (IPC) and can be grouped as follows:
IPA: E2,E5,E6 > E3,E4 > E1; IPC: E2 > E5,E6 > E1 > E4,E3.
-1000 -500 0 500 1000 1500
-0.30 -0.25 -0.20 -0.15 -0.10 -0.05 0.00 0.05 0.10
I(m
A
)
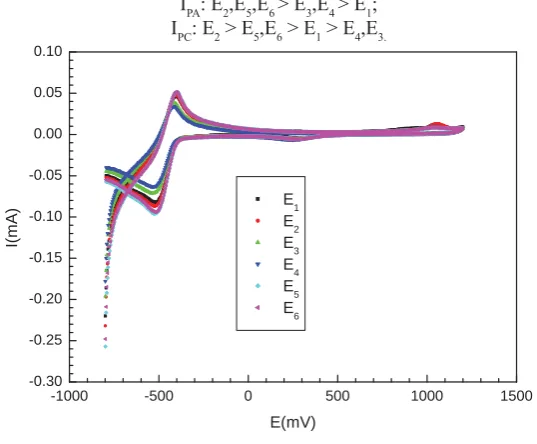
E(mV) E1 E2 E3 E4 E
5 E6
Fig. 4. CV of the 6 types of Enoxil at 19.23x10⁻²% in 0.1 M NaClO4 at a scan speed of 50 mV/s
CV in fi gure 4 confi rms the existence of peaks in the positive range of potentials due to the medium, and for that reason in fi gure 5, we will present for E1, the CVs both for expanded and restricted ranges, where only Enoxil characteristic peaks occur. The reproducibility is very good, given by the overlapping peaks.
-1000 -500 0 500 1000 1500
-0.25 -0.20 -0.15 -0.10 -0.05 0.00 0.05 0.10
-1000 -500 0 500 1000 1500
-0.25 -0.20 -0.15 -0.10 -0.05 0.00 0.05 0.10
I(
mA)
E(mV)
E1,CV:-800/1200/-800 E1,CV:-800/0/-800
Fig. 5.CV of E1 at a concentration of 19.23x10⁻²%
in 0.1 M NaClO4 at a scan speed of 50 mV/s for expanded and restricted ranges
Considering the variation of peak current intensity for Enoxil concentration 19.23x10⁻²%, the 6 types of Enoxil may be grouped as follows:
IPA: E5,E2,E6 > E3,E4 , E1; IPC: E5,E6 > E2 > E1 > E3,E4.
Table 2
Solutions parameters and peak characteristics of CVs For aqueous solutions of 0.1M NaClO4 of the 6 types of Enoxil
102c (g/100mL)
pH
κ
mS/cm
-EPC (mV)
-IPC (μA)
-EPA (mV)
IPA (μA) E1
4.95 2.94 11.10 523 22.2 431 6.85
9.80 2.71 11.30 516 45.8 420 25.0
14.56 2.58 11.48 511 65.4 412 37.0
19.23 2.49 11.69 524 88.0 408 45.1
34.16 2.32 12.05 528 132.0 392 62.8
IPC(μA)= 5.3208 – 570.75823c + 492.24991c2; R=0.99898 IPA(μA)= -10.91388 + 405.99054c – 558.70508c2; R=0.99685
E2
4.95 2.88 11.07 508 29.3 431 14.0
9.80 2.71 11.34 512 48.2 424 28.1
14.56 2.59 11.52 524 68.0 415 38.3
19.23 2.49 11.72 524 87.2 408 48.1
38.46 2.28 12.25 536 155.0 388 82.8
IPC(μA)= -7.36359 – 4.39348c + 0.01437c2; R=0.99984 IPA(μA)= 1.09012 + 2.82228c – 0.01819c2; R=0.9993
E3
4.95 3.02 11.14 523 19.7 439 6.32
9.80 2.80 11.28 512 40.9 420 22.8
14.56 2.68 11.43 528 57.0 420 31.8
19.23 2.61 11.52 540 71.2 412 38.2
34.16 2.46 11.77 540 112.0 404 60.3
IPC(μA)= 0.54852 – 441.465c + 329.27349c2; R=0.99928 IPA(μA)= -6.44928 + 304.78515c – 323.07386c2; R=0.99167
E4
4.95 3.04 10.88 511 18.5 432 6.5
9.80 2.84 10.90 516 34.5 428 16.4
14.56 2.72 10.91 519 49.2 420 25.2
19.23 2.64 11.03 536 63.7 416 34.0
34.16 2.48 11.14 559 102 408 55.8
IPC(μA)= -0.97988 – 361.38485c + 191.8709c2; R=0.99994 IPA(μA)= -4.44 + 227.15128c – 148.47841c2; R=0.9999
E5
4.95 2.86 11.16 516 27.5 428 12.8
9.80 2.63 11.32 512 52.5 416 27.7
14.56 2.51 11.50 508 74.1 408 40.1
19.23 2.41 11.85 528 96.2 404 51.5
34.16 2.24 12.28 527 151 395 61.7
IPC(μA)= -0.3855- 564.72738c + 361.95061c2; R=0.99987 IPA(μA)= -7.13662 + 425.25416c – 653.75472c2; R=0.99844
E6
4.95 2.85 11.06 516 27.6 424 13.5
9.80 2.63 11.26 516 52.8 412 29.8
14.56 2.50 11.46 516 73.5 412 41.1
19.23 2.41 11.61 524 94.1 400 51.4
34.16 2.25 12.09 532 148.0 388 71.6
IPC(μA)= -1.65877 – 548.01533c + 350.42436c2; R=0.99988
Table 2 shows that increasing concentration of Enoxil in the electrochemical cell where the electrolytic background is sodium perchlorate, leads to a decrease in pH accompanied by a slight increase in electroconductivity (κ), which can be attributed to hydrogen ions generated by Enoxil during dissolution. For every type of Enoxil, the dependency of peak current upon concentration was established, for both the anodic (IPA(μA)) and cathodic (IPC(μA)) processes. Also, the corresponding correlation coeffi cients (R) are given, with values very close to unity, by 2nd order polynomial fi tting of experimental data.
Table 3 presents the mean values of reduction potentials (EPC) and oxidation potentials (EPA) as well as a formal redox potential (E0’) calculated according to the formula:
2
E
E
E
0' PC PATable 3
The mean values of reduction and oxidation potentials, as well as Enoxil formal redox potential on platinum electrode in aqueous solution of 0.1MNaClO4
Enoxil -EPC
mV
-EPA mV
- E0’ mV
E1 520.4 412.6 466.5
E2 520.8 413.2 467.0
E3 528.6 419.0 473.8
E4 528.2 420.8 474.5
E5 518.2 410.2 464.2
E6 520.8 407.2 464.0
The close values of each of the three forms of potential shown in Figure 3, prove that regardless of the type of Enoxil, the electrochemically reactive group of Enoxil is characterized by a reduction potential EPC 522.8mV and
an oxidation potential EPA 413.8mV and the formal redox potential of this group will be E0' 468.3mV. These
values should be qualitative indicators of Enoxil presence and the intensity of the peak current will provide quantitative estimates for a subsequent dosing of Enoxil by voltammetry.
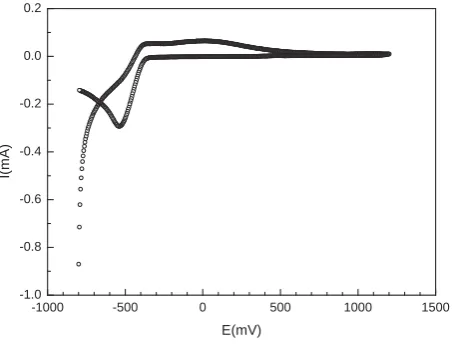
By acidifying the solution with HClO4 gives a marked rise in cathode current (increased speed of the reduction process) and anodic peak fl attening, as shown for E4 in fi gure 6.
-1000 -500 0 500 1000 1500 -1.0
-0.8 -0.6 -0.4 -0.2 0.0 0.2
I(
m
A
)
E(mV)
Fig. 6. CV at pH=1.86 for the solution of 34.16x10⁻²% E 4 in 0.1M NaClO4 at a scan speed of 50 mV/s
-1000 -500 0 500 1000 1500 -0.03
-0.02 -0.01 0.00 0.01 0.02
I(
m
A
)
E(mV)
Fig. 7.CV at pH=7.46 for the solution of 34.16x10⁻²% E 4 in 0.1M NaClO4 at scan speed of 50 mV/s.
After the voltammetric measurements were performed in 0.1M NaClO4 solution on platinum electrode, as shown in Table 2, pH values are functions of Enoxil concentration, acidifi cation or alkalinization of the solution leading to changes in CV and even annihilation of Enoxil electroreactivity.
This study allows us to conclude that hydrosoluble Enoxil can be studied by voltammetry in aqueous sodium perchlorate medium as electrolytic background on platinum electrode by highlighting a quasireversible redox process.
Conclusions
- The dependence of cathodic current intensity of Enoxil concentration is linear. This can be used to determine the concentration of Enoxil in unknown solutions.
- The analysis of cyclic voltammograms reveals a quasireversible redox process characteristic to Enoxil.
- The Enoxil samples obtained from alcohol soluble enotannins are more reactive over time, compared with enoxil obtained from standard enotannins.
- The analysis of reduction and oxidation potentials and of the formal redox potential of Enoxil samples allows us to estimate these values, which may serve as qualitative indices of Enoxil preparation that can be used for its determination by voltammetry.
References
Duca Gh., Lupaşcu T., Vlad P., Kulciţki V., Nastas R. Studies on the water solubilization processes of oenotanins [1].
and their physico-chemical properties. Chemistry Journal of Moldova. 2006, 1 (1), P. 74-79.
Lupaşcu T., Duca Gh., Giurgincă M., Vlad P. et. Natural compounds with antioxidant propertes. Key Engeenering [2].
Materials, 2009, V. 415, P.P.25-28.
Wisser K., Heimann W., Fritsche C., Fresenius Z. Anal. Chem., 1967, 230, 189. [3].
Ruiz M.A., Yanez-Sedeno Poloma, Pingaron J.M., Electroanalysis 1994, 6, 475. [4].
Ishar M.P.S., Kaur R., Kaur G., Gandhi R.P., Indian J. Chem, 1996, 35B, 641. [5].
Surez – Fernendaz A.L., Alaines-Varela G, Costa-Garcea A., Electrochimica Acta, 1999, 44, 4489. [6].
Liteanu S., G.L. Radu. Elemente de bio-electroanaliză a unor principii active antioxidante. Editura Printech, [7].
Bucureşti, 2005, 232 p.
Brevet de Invenţie. 3979 MD F 1. Compus cu proprietăţi antioxidante. Lupaşcu T., Duca Gh., Lupaşcu L., [8].
Giurgincă M., Meghea A. BOPY, nr. 11/2009.
Nemtoi Gheorghe, Ionica Florica, Lupascu Tudor and Cecal Alexandru,Voltammetric characterirization of the [9].
iron behaviour from steels in different electrolytic media, Chemistry Journal of Moldova. General,Industrial and Ecological Chemistry, 5,(1), 2010, 98-105
Mareci D., Bocanu C., Nemtoi Gh. and Aelenei Delia, Electrochemical behaviour of titanium alloys in artifi cial [10].