Brain Tumor Segmentation Using Fuzzy C Means With Ant
Colony Optimization Algorithm
Ganesh S. Raghtate
Research Scholar, B. D. COE, Sevagram, Wardha, India. Email ID: [email protected]
Suresh. S. Salankar
Professor, G. H. Raisoni COE, Nagpur, India. Email ID: [email protected]
Abstract — In computer vision, image segmentation is an important problem and plays vital role in medical imaging. Analysis and diagnosis of tumor in MRI brain image involves segmentation as very essential steep. It separates the region of interest objects from the background and the other objects. Several approaches are used for MRI brain tumor segmentation. Fuzzy C Means (FCM) is most widely used fuzzy clustering algorithm. The accuracy of this algorithm for segmentation is not efficient due to limitation in initialization. In this paper, ant colony algorithm with min max ant system is used to improve the segmentation accuracy by maximum 32 % and reduce the computational time by maximum 2.5 times respectively.
Keyword —Magnetic Resonance Image (MRI), Brain Tumor segmentation, Fuzzy Interference System (FIS), Fuzzy C Means (FCM), Ant Colony Algorithm (ACA), Min Max Ant System (MMAS).
1.
I
NTRODUCTIONImage segmentation is a process in which the image is partitioned into regions which are homogeneous in nature with respect to one or more characteristics. In medical field it is used for brain tumor detection and other various applications like detection of coronary border, surgical planning, measuring tumor volume and its volumetric response to therapy, classification of blood cells, detection of micro calcification on mammograms, heart image extraction from cardiac cine angiograms etc.
The brain tumor segmentation is achieved by using the methods such as thresholding, region growing and clustering. Clustering is the most popular approach for segmentation of brain MR image and performs better than the other methods.
Clustering is about dividing or partitioning a given data set into clusters (groups) such that the data points in a cluster are more similar to each other than points in different clusters. In clustering process, there are no predefined classes and no examples that would show what kind of desirable relations should be valid among the data. Clustering produces initial categories in which values of a data set are classified during the classification process.
In this paper, clustering algorithm such as fuzzy C Means (FCM) is implemented to extract the suspicious
region in MRI image. Ant colony algorithm with Min Max Ant System is used to improve the segmentation accuracy and reduce the computational time respectively.
2.
L
ITERATURER
EVIEWImage segmentation is an important basic operation for meaningful analysis and interpretation of acquired image. There are various methods for image segmentation. These methods are classified into three major classes i.e. thresholding, region based segmentation methods and clustering algorithm.
Thresholding is a powerful manual approach for segmenting images having light objects on dark backgrounds [1]. A multilevel image is converted into a binary image. It selects a threshold T to divide the image pixels into several regions and separate objects from the background. Any pixel (x, y) is considered as part of object if its intensity is greater than or equal to threshold value i. e., f(x, y) ≥ T, else pixel belongs to background [2, 3]. Depending on threshold value [4], this approach is classified into global and local thresholding.
Segmentation algorithm based on region is relatively simple and more immune to noise [4, 5]. Segmentation algorithms based on region mainly includes region growing and region splitting and merging. Region growing is a procedure [3] that groups pixels into sub regions or larger regions based on predefined criterion [6]. Clustering is an unsupervised learning task, where one needs to identify a finite set of categories known as clusters to classify pixels [4]. It is used when classes are known in advance. A similarity criteria is defined between pixels [7] and then similar pixels are grouped together to form clusters. In clustering technique, an attempt is made to extract a vector from local areas in the image. A standard procedure for clustering is to assign each pixel to the nearest cluster mean.
Tie Qi Chen and Yi Lu [9] developed a fuzzy clustering algorithm that iteratively generates color clusters using a uniquely defined fuzzy membership function and an objective function for clustering optimization. The region segmentation algorithm merges clusters in the image domain based on color similarity and spatial adjacency. Martin Tabakov [10] described a way of medical image segmentation using an appropriately defined fuzzy clustering method based on a fuzzy relation. The considered relation is defined in terms of Euclidean distance.
Ahmed Mohamed N., Yamany Sameh M. et al. [11] presented an algorithm for fuzzy segmentation of MRI data and estimation of intensity inhomogenities using fuzzy logic. The algorithm is formulated by modifying the objective function of the standard fuzzy C means algorithm to compensate for such inhomogenities and allow the labeling of a pixel to be influenced by the labels in its immediate neighborhood.
3.
I
MAGEA
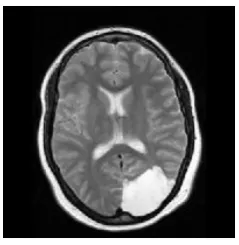
CQUISITIONThe MRI data is obtained from open data source http://www.cancerimagearchive.net/display/public/collecti ons. A sample of total 10 MRI brain images is taken for segmentation purpose. These images are with the default size of 512 x 512. The following fig.1 displays a MRI Brain Image.
Fig.3: Acquired Brain MRI image
4.
S
KULLR
EMOVALSkull stripping is a major phase sometimes refers to a pre-process in MRI brain imaging applications which refers to the removal of brain non-cerebral tissues. The grayscale image is converted to binary image by thresholding. The output image BW replaces all pixels in the input image with luminance greater than threshold with the value 1 (white) and replaces all other pixels with the value 0 (black). Otsu's method [6] is used, which chooses the threshold to minimize the intra class variance of the black and white pixels.
Fig. 4. (a) Original Image (b) Skull Removed Image
5.
I
MAGEE
NHANCEMENTImage enhancement makes a graphic display more useful for display and analysis. Image enhancement consists of gray level and contrast manipulation, noise reduction, edge crispening and sharpening, filtering, interpolation and magnification.
Fuzzy inference system is selected for image pre processing, as it have higher PSNR value as compared to others.
5.1.
F
UZZYI
NFERENCES
YSTEMFuzzy inference system is the process of formulating the mapping from a given input to an output using fuzzy logic. The mapping provides the basis from which decisions can be made. The process of fuzzy inference involves membership functions, fuzzy logic operators and if-then rules. Fuzzy inference system is associated with fuzzy-rule-based system and fuzzy-expert system.
The steps followed for image enhancement are: Step 1: Morphological Processing
Step 2: Conversion of image into fuzzy domain data Step 3: Membership Modifications
Step 4: Defuzzification
Step 5: Displaying the enhanced image.
Fig 5.1 (a) Original Image (b) Enhanced Image
6.
I
MAGES
EGMENTATION6.1.
I
NTRODUCTIONT
OF
UZZYC
M
EANS(
FCM)
This algorithm works by assigning membership to each data point corresponding to each cluster centre, on the basis of distance between the cluster centre and the data point [13]. More the data is near to the cluster centre more is its membership towards the particular cluster centre. Clearly, summation of membership of each data point should be equal to one. After every iteration, the up-gradation of the membership and cluster centers is done.
Parameters:
n : is the number of data points. vj: represents the cluster centre. m: is the fuzziness index m Є [1, ∞].
c: represents the number of cluster centre. : represents the membership of data to cluster centre.
: represents the Euclidean distance between ℎ and ℎ
data and cluster centre.
Main objective of FCM is to minimize:
…. (6.1.1)
Where ||xi –vj||, is the Euclidean distance between ith data and jth cluster centre.
Algorithmic steps for FCM:
Let X ={x1, x2, x3 ..., xx} be the set of data points and V = {v1, v2, v3 ..., vv}be the set of centers. Step 1: Randomly select c cluster centers.
Step 2: Calculate the fuzzy membership function µij using:
……. (6.1.2) Step 3: Compute the fuzzy centers vj using:
……. (6.1.3)
Vj=1, 2, …, c.
Step 4: Repeat Step 2&3 until the minimum ‟J‟ value is achieved or ||Uk+1−Uk|| < β where,
k: is the iteration step.
β: is the termination criterion between [0, 1]. U = (µij) + c is the fuzzy membership matrix. J: is the objective function.
The less accuracy of FCM is due to the fact that it is sensible to initialization. Thus to increase the
segmentation accuracy Ant Colony Algorithm (ACA) is used. ACA initializes the cluster center to best proper value thereby increasing the segmentation accuracy.
6.2.
A
NTC
OLONYA
LGORITHMThe parameters taken here are total ants K and Tinit. Tinit is the starting initial value of pheromone matrix.
Construction of ant solution gets possible through the local search on the solution space i.e., the image matrix [14]. Ants decide to move from node i to another j through the probabilistic action rule which is as follows,
……. (6.2.1)
if, jεΩi
where (Ti,j)(n-1) is pheromone information in the previous loop while moving from node i to node j; Ωi is the neighborhood nodes for the recent ant given that it is in the node i; the constants α and β influences the pheromone information and heuristic information, respectively.
The local pheromone update is performed as followed by the equation:
Tij = (1-φ) Tij + φ To ……. (6.2.2)
Where φε (0, 1] is the pheromone decay coefficient and To is the pheromone initial values. The offline pheromone update is performed by the equation as follows:
(6.2.3)
Exploitation is the process of attaining the maximum probability path. The exploitation of the learned experience is applied during solution construction with the help of pseudo-random proportion rule of ACS. After applying ACA to image processing it is found that it increases the segmentation accuracy of FCM to a greater extent. But it increases the computational time as well. Thus to reduce the computational time max-min ant system is used. This reduces time nearly to 50% as that of ACA keeping segmentation accuracy nearly same as that of ACA.
6.3.
A
NTC
OLONYA
LGORITHMThe Max-Min Ant System (MMAS) is a direct improvement over AS [15]. The main modifications introduced by MMAS with respect to AS are the following.
Last, the pheromone trails are initialized to the upper trail limit, which causes a higher exploration at the start of the algorithm. After all ants have constructed a solution, the pheromone trails are updated according to
Tij (t+1)= (1-ρ)*Tij(t)+∆Tijbest ……. (6.3.1)
where, ∆Tijbest =1/Lbest. The ant which is allowed to add pheromone may be the iteration-best solution Tib, or the global-best solution Tgb. Hence, if specific arcs are often used in the best solutions, they will receive a larger amount of pheromone. Experimental results have shown that the best performance is obtained by gradually increasing the frequency of choosing Tgb for the trail update.
Trail limit, In MMAS lower and upper limits on the possible pheromone strengths on any arc are imposed to avoid search stagnation. In particular, the imposed trail limits have the effect of indirectly limiting the probability Pij of selecting a city j when an ant is in city i to an interval [Pmin; Pmax], with 0 < Pmin ≤ Pij ≤ Pmax ≤ 1. Only if an ant has one single possible choice for the next city, then Pmin = Pmax = 1. Experimental results suggest that the lower trail limits used in MMAS are the more important ones, since the maximum possible trail strength on arcs is limited in the long run due to pheromone evaporation.
Trail initializations, the pheromone trails in MMAS are initialized to their upper pheromone trail limits. Doing so the exploration of tours at the start of the algorithms is increased, since the relative differences between the pheromone trail strengths are less pronounced.
7.
E
XPERIMENTSA
NDR
ESULTSThe brain tumor segmentation is implemented by using Matlab 7.9. The experimental results are tested in Intel Core 2 Duo CPU 2GHz processor with 1GB RAM.
A)Skull Removal Results:
The removal of non-cerebral tissues from MRI brain image is achieved by using the skull removal method (Otsu's method). The results are as shown,
Original Image Original Image
Skull Removed Image
Original Image Original Image
Skull Removed Image
Fig 7.1: Skull Removal from MRI Images.
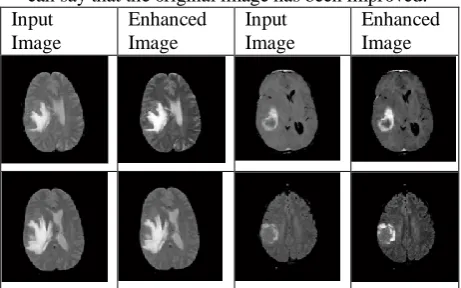
B)Enhancement Results:
Skull removed image is enhanced using Fuzzy Inference system. If the enhanced image can make observer perceive the region of interest better, then we can say that the original image has been improved. Input
Image
Enhanced Image
Input Image
Enhanced Image
Fig7.2: Enhanced Image using Fuzzy Inference System
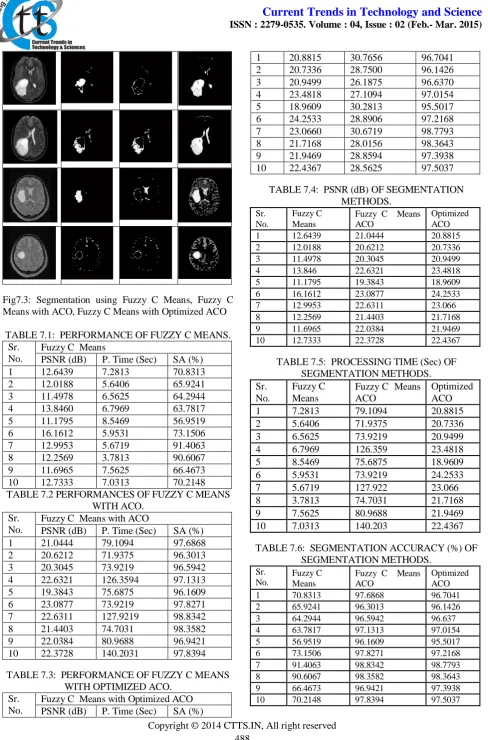
C)Segmentation Results:
MRI image segmentation using Fuzzy C Means, Fuzzy C Means with Ant Colony System and Fuzzy C Means with Optimized Ant Colony System with Min Max Ant System is shown.
Original Image
Fuzzy C Means
Fuzzy C Means ACO
Optimized
Fig7.3: Segmentation using Fuzzy C Means, Fuzzy C Means with ACO, Fuzzy C Means with Optimized ACO
TABLE 7.1: PERFORMANCE OF FUZZY C MEANS. Sr.
No.
Fuzzy C Means
PSNR (dB) P. Time (Sec) SA (%) 1 12.6439 7.2813 70.8313 2 12.0188 5.6406 65.9241 3 11.4978 6.5625 64.2944 4 13.8460 6.7969 63.7817 5 11.1795 8.5469 56.9519 6 16.1612 5.9531 73.1506 7 12.9953 5.6719 91.4063 8 12.2569 3.7813 90.6067 9 11.6965 7.5625 66.4673 10 12.7333 7.0313 70.2148 TABLE 7.2 PERFORMANCES OF FUZZY C MEANS
WITH ACO. Sr.
No.
Fuzzy C Means with ACO
PSNR (dB) P. Time (Sec) SA (%) 1 21.0444 79.1094 97.6868 2 20.6212 71.9375 96.3013 3 20.3045 73.9219 96.5942 4 22.6321 126.3594 97.1313 5 19.3843 75.6875 96.1609 6 23.0877 73.9219 97.8271 7 22.6311 127.9219 98.8342 8 21.4403 74.7031 98.3582 9 22.0384 80.9688 96.9421 10 22.3728 140.2031 97.8394
TABLE 7.3: PERFORMANCE OF FUZZY C MEANS WITH OPTIMIZED ACO.
Sr. No.
Fuzzy C Means with Optimized ACO PSNR (dB) P. Time (Sec) SA (%)
1 20.8815 30.7656 96.7041 2 20.7336 28.7500 96.1426 3 20.9499 26.1875 96.6370 4 23.4818 27.1094 97.0154 5 18.9609 30.2813 95.5017 6 24.2533 28.8906 97.2168 7 23.0660 30.6719 98.7793 8 21.7168 28.0156 98.3643 9 21.9469 28.8594 97.3938 10 22.4367 28.5625 97.5037
TABLE 7.4: PSNR (dB) OF SEGMENTATION METHODS.
Sr. No.
Fuzzy C Means
Fuzzy C Means ACO
Optimized ACO
1 12.6439 21.0444 20.8815
2 12.0188 20.6212 20.7336
3 11.4978 20.3045 20.9499
4 13.846 22.6321 23.4818
5 11.1795 19.3843 18.9609
6 16.1612 23.0877 24.2533
7 12.9953 22.6311 23.066
8 12.2569 21.4403 21.7168
9 11.6965 22.0384 21.9469
10 12.7333 22.3728 22.4367
TABLE 7.5: PROCESSING TIME (Sec) OF SEGMENTATION METHODS. Sr.
No.
Fuzzy C Means
Fuzzy C Means ACO
Optimized ACO 1 7.2813 79.1094 20.8815 2 5.6406 71.9375 20.7336 3 6.5625 73.9219 20.9499 4 6.7969 126.359 23.4818 5 8.5469 75.6875 18.9609 6 5.9531 73.9219 24.2533 7 5.6719 127.922 23.066 8 3.7813 74.7031 21.7168 9 7.5625 80.9688 21.9469 10 7.0313 140.203 22.4367
TABLE 7.6: SEGMENTATION ACCURACY (%) OF SEGMENTATION METHODS.
Sr. No.
Fuzzy C Means
Fuzzy C Means ACO
Optimized ACO
1 70.8313 97.6868 96.7041
2 65.9241 96.3013 96.1426
3 64.2944 96.5942 96.637
4 63.7817 97.1313 97.0154
5 56.9519 96.1609 95.5017
6 73.1506 97.8271 97.2168
7 91.4063 98.8342 98.7793
8 90.6067 98.3582 98.3643
9 66.4673 96.9421 97.3938
Fig.7.4: PSNR of segmentation methods
Fig.7.5: Processing Time of segmentation methods
Fig.7.6: Segmentation Accuracy of segmentation methods
8. Q
UALITYM
EASURESThere are various methods for calculating the performance of segmentation technique some of them are,
8.1.
P
EAKS
IGNALT
ON
OISER
ATIO(
PSNR)In order to evaluate the performance of different Segmentation methods, image quality measurement is required and known as the peak signal-to-noise ratio (PSNR). The Mean absolute Error (MAE) and the Peak Signal to Noise Ratio (PSNR) are the two error metrics frequently used to compare the quality of image. PSNR in decibels (dB) is computed by using,
PSNR = 20 log 10 (2552 / MAE) ……. (8.1) Where,
……. (8.2)
8.2.
S
EGMENTATIONA
CCURACY(
SA)
By finding the optimal correspondence between a dataset‟s annotated class labels and the clusters in a given partition, a performance measure may be derived that reflects the proportion of instances that were correctly assigned. “A high value for this measure generally indicates a high level of agreement between a clustering and the annotated natural classes”. It may be noted that this measure is only applicable when the number of clusters „C‟ is the same as the number of natural classes. Segmentation Accuracy is defined as:
Segmentation Accuracy =
……. (8.3)
8.3.
C
ONVERGENCER
ATEO
RE
XECUTIONT
IMEConvergence rate is defined as the time period required for the system to reach the stabilized condition. The lesser the execution time better is the clustering technique. Computation time (also called "running time") is the length of time required to perform a computational process. Representation a computation as a sequence of rule applications, the computation time is proportional to the number of rule applications.
9.
C
ONCLUSIONSR
EFERENCES[1] Rastgarpour M. and Shanbehzadeh J. Application of AI Techniques in Medical Image Segmentation and Novel Categorization of Available Methods and Tools, Proceedings of international Multiconference of Engineers Computer Scientists 2011 Vol I, IMECS 2011, March 16 – 18, 2011, Hongkong.
[2] Wahba Marian, An Automated Modified Region Growing Technique for Prostate Segmentation in Trans – Rectal Ultrasound Images, Master‟s Thesis, Department of Electrical and Computer Engineering, University of Waterloo, Waterloo, Ontario, Canada, 2008.
[3] L. Aurdal, “ Image Segmentation beyond Thresholding”, Norsk Regnescentral, 2006 [4] V. K. Dehariya, S.K. Shrivastava, R. C. Jain,
“Clustering of Image Data Set Using K Means and Fuzzy K Means Algorithms”, International Conference on CICN, pp. 386 – 391, 2010
[5] H. Zhang, J. E. Fritts, S. A. Goldman, “Image Segmentation Evaluation: A Survey of Unsupervised methods”, computer vision and image understanding, pp. 260 – 280, 2008. [6] Y. Chang, X. Li, “Adaptive Image Growing”,
IEEE Trans. On Image Processing, Vol. 3, No. 6, 1994.
[7] Zhang, Y.J, An Overview of Image and Video Segmentation in the last 40 years, Proceedings of the 6 th International Syposium on Signal Processing and Its Applications, pp. 144 – 151, 2001.
[8] Karmakar, G., Dooley, L., Murshed, M. Fuzzy rule for image segmentation incorporating texture features, Proceedings of international conference on image processing, Vol.1, 2002, pp. 797-800. [9] Chen Tie Qi and Lu Yi. Color image
segmentation- an innovative approach. Pattern recognition, vol. 35, 2002, pp. 395-405.
[10] Tabakov Martin. A fuzzy clustering technique for medical image segmentation. Proceedings of international symposium on evolving fuzzy systems, September 2006, pp. 118-122.
[11] Ahmed M. N., Yamany S.M et al. A modified fuzzy c-means algorithm for bias field estimation and segmentation of MRI data, IEEE transactions on medical imaging, Volume 21, Issue 3, March 2002, pp. 193 – 199.
[12] Otsu, N., "A Threshold Selection Method from Gray-Level Histograms," IEEE Transactions on Systems, Man, and Cybernetics, Vol. 9, No. 1, 1979, pp. 62-66.
[13] Gordillo, N., Montseny, E., Sobrevilla, P. ,‖A New Fuzzy Approach to Brain Tumor Segmentation‖, Fuzzy Systems (FUZZ), 2010 IEEE International Conference on , 18-23 July
2010, pp.1-8, , doi:
10.1109/FUZZY.2010.5584178.
[14] M. Karnan, T. Logheshwari, "Improved implementation of brain MRI image segmentation using ant colony system", IEEE International Conference on Computational Intelligence and Computing Research (ICCIC), pp. 1-4, 2010. [15] A. Sheikh, R.K. Krishna, "Segmentation of brain
MRI for tumor detection using ant colony optimization", Proc. of Int. Colloquiums on Computer Electronics Electrical Mechanical and Civil, 2011.
A
UTHOR’
SP
ROFILEGanesh S. Raghtate, received B.E. Degree in Electronics Engineering from Bapurao Deshmukh College of Engineering, Sevagram in 2001 and M. E. Degree in Electronics and Telecommunication Engineering from Shri Shankaracharya College of Engineering and Technology, Bhilai in 2008. He is doing research in Rastrasant Tukadoji Maharaj Nagpur University, Nagpur. His current research focuses on Image Processing, Texture Analysis and Neural Network.