13
Advances in Science and TechnologyResearch Journal
Volume 10, No. 29, March 2016, pages 13–27
DOI: 10.12913/22998624/61926 Research Article
Received: 2015.12.15 Accepted: 2016.02.01 Published: 2016.03.01
STUDY OF HIGHER MODE EFFECTS AND LATERAL LOAD PATTERNS IN
PUSHOVER ANALYSIS OF STEEL FRAMES WITH STEEL SHEAR WALL
Mohammad Ghanoonibagha1, Mohammad Reza Ashrafi Gol2, Mohammad Reza Ranjbar3
1 Department of Civil Engineering, East Tehran Branch, Islamic Azad University, Tehran, Iran, e-mail: [email protected]
2 School of Civil Engineering, Iran University of Science and Technology,Narmak, Tehran, Iran 3 Technical Faculty of Mapping, Zabol University, Zabol, Iran
ABSTRACT
When an earthquake occurs, the structure will enter into a nonlinear stage; therefore, new approaches based on nonlinear analysis are needed to flourish with the purpose of more realistic investigations on seismic behavior and destruction mechanism of struc-tures. According to the modern philosophy, “Performance-based Earthquake Engi-neering” is formed in which simple nonlinear static analyses are mostly used in order to determine the structure’s behavior in nonlinear stage. This method assumes that the structure response is only controlled by the main mode and the shape of this mode will remain the same, while it enters the nonlinear stage. Both of these assumptions are approximations, especially in high buildings, which have a long period. It seems that constant load pattern used in these methods cannot consider all of the effects properly. In this paper, an attempt was made to study the accuracy of these methods in com-parison to nonlinear dynamic analysis, by considering various load patterns existing in FEMA, also load patterns proportional to higher modes in nonlinear static method, and employing an approximative method of MPA modal analysis, study the accuracy of these methods in comparison to nonlinear dynamic analysis. For this purpose, three steel frames of 4, 8, and 12-stories with steel shear wall have been studied.
Keywords: load patterns, steel shear wall, static nonlinear, dynamic nonlinear.
INTRODUCTION
With advancements in earthquake recognition, appearing growth in seismic improvement con-cepts and performance-based design, considering an accurate and realistic form of the structure be-havior tends to gain more importance than before. It is essential to discuss various factors which de-pict the precise structure behavior, because it leads to a better prediction and prevention of damage. In fact, nowadays, only horrible and destructive disasters like earthquake in metropolises can fea-ture the valuable aspects of the above mentioned issue. Moreover, demolition of buildings which are vulnerable to earthquakes and construction of alternative buildings requires enormous waste of time and cost that in some cases providing the necessary stuff is not even possible.
Among the methods which help the
improve-ment and retrofitting of the buildings against
earthquake is the steel shear wall method. In this present study the effects of higher modes in
ret-rofitting of structures by means of shear wall was
investigated.
In commencement of steel shear walls con-struction in the United States of America and Ja-pan, vertical and horizontal stiffeners was used which restricted the buckling of sheet and im-proved the shear resistance of steel sheet. How-ever, welding, which is necessary for junction of stiffeners to wall, was costly and time-consum-ing; as a result, plenty of studies and examina-tions were conducted on shear walls without stiff-ener in US and Japan. The main idea for the usage of steel plate shear walls without stiffeners is to
-Advances in Science and Technology Research Journal Vol. 10 (29), 2016
14
ter the buckling of steel sheet. This phenomenon is post-buckling in steel sheet, which is common in beam-plates. In this case the panel resists until the yielding of the steel sheet which will cause them to endure considerable forces.
The first studies on beam-plates were in
1980’s at Alberta University, Canada by Coolak, Driver, Timler and et al. [1, 2, 3]. Following them, many other scientists, e.g. Bruneau and Bhag-wagar [4], Berman and Bruneau [5], Elghali et al. [6, 7], Astaneh Asl [8, 9], and Sabouri Ghomi [10, 11] have examined numerous tests on the subject.
MODELING OF STEEL SHEAR WALLS
Steel shear wall systems without stiffener include steel plate panel, two boundary columns and horizontal beams at the bottom. It is required that each steel shear wall resists horizontal shear of stories and overturning anchor due to lateral loads. The shear wall, along with two columns, acts as a vertical cantilever beam-plate. Columns
act as sheet beam flange, wall panels as web
sheets and bottom beams as transverse stiffen-ers of web sheets. Investigations on panel behav-iors in the case of no stiffener showed that there would be much more ductility and energy dissipa-tion comparing to the case where stiffener exists; as a result there have been recent trends towards the matter in United States and Canada.
Theoretical studies on design and analysis of steel shear walls concluded in two ultimate
be-havioral models of the context. The first model
is based on substitution of diagonal strips with doubler plate (strip model) which has been intro-duced by Thorburn (1983) in order to design steel shear walls. It is also accepted as an appendix to Canadian Steel Standard (CAN/CSA S16-01) and is shown in Figure 1 [12]. Moreover, this method is mentioned in seismic provisions for Structural Steel Buildings (AISC 2005) in chapter 17 [13]. The second model is based on the plastic yield-ing of the plate with surroundyield-ing frame (plastic yielding model) presented by Sabouri & Roberts
(1991) [10]. In this study the first model is em -ployed to design steel shear walls.
The design procedure is that firstly for pre -liminary cross sections design of beam, column and web, similar shear wall is approximated by a vertical truss with tension braces. In fact, each steel plate is represented by an equivalent brace. After the structural analysis and calculation of
cross-sectional area of braces, based on the eltic stress energy formula (equation 1) for the
as-sumed angle of the tension field, the steel plate
thickness can be achieved. Then, by using stiff-ness of beam, column, and plate thickstiff-ness, the
angle of the tension field (α) is taken place in the sheet.
and Bruneau [5], Elghali et. al [6,7], Astaneh Asl [8,9], and Sabouri Ghomi [10,11] have examined numerous tests on the subject.
2. Modeling of Steel shear walls
Steel shear wall systems without stiffener include steel plate panel, two boundary columns and horizontal beams at the bottom. It is required that each steel shear wall resist horizontal shear of stories and overturning anchor due to lateral loads. The shear wall along with two columns acts as a vertical cantilever beam-plate. Columns act as sheet beam flange, wall panels as web sheets and bottom beams as transverse stiffeners of web sheets. Investigations on panel behaviors in the case of no stiffener showed that there would be much more ductility and energy dissipation comparing to the case where stiffener exists; as a result there have been recent trends towards the matter in United States and Canada.
Theoretical studies on design and analysis of steel shear walls concluded in two ultimate behavioral models of the context. The first model is based on substitution of diagonal strips with doubler plate (strip model) which has been introduced by Thorburn (1983) in order to design steel shear walls. It is also accepted as an appendix to Canadian Steel Standard (CAN/CSA S16-01) and is shown in Figure 1 [12]. Moreover, this method is mentioned in Seismic provisions for Structural Steel Buildings (AISC 2005) in chapter 17 [13]. The second model is based on the plastic yielding of the plate with surrounding frame (plastic yielding model) presented by Sabouri & Roberts (1991) [10]. In this study the first model is employed to design steel shear walls.
Fig 1 Thorburn Strip model (Using truss elements) [1]
The design procedure is that firstly for preliminary cross sections design of beam, column and web, similar shear wall is approximated by a vertical truss with tension braces. In fact, each steel plate is represented by an equivalent brace. After the structural analysis and calculation of cross-sectional area of braces, based on the elastic stress energy formula (equation 1) for the assumed angle of the tension field, the steel plate thickness can be achieved. Then, by using stiffness of beam, column, and plate thickness, the angle of the tension field (α) is taken place in the sheet.
(1) 2 sin L sin A 2 t b s
Where
s
= system's over-strength factor which is 1.2 for shear walls.
= the angle between brace and column. L = distance between column centerlines.
= the angle of inclination of the tension field in the steel plate (angle of replaced diagonal
(1)
where: ΩS
– system’s over-strength factor,
which is 1.2 for shear walls;
θ – the angle between brace and column. L – distance between column centerlines.
α – the angle of inclination of the tension
field in the steel plate (angle of replaced
diagonal strips with vertical direction)
according to figure 1 which is obtainable
from equation (2).
As in the current study, the steel panels do not have hardening (stiffener), though they possess high width-to-thickness ratio, and when lateral forces are prescribed, they behave as deep beam
sheets. The tension field is formed in tensile diam -eter direction and considerable forces are imposed in this way, while in direction of compression di-ameter with critical plate-buckling little tensions take form. When force side changes, direction of
tension field and forces transfer is inversed. The inclination angle of the tension field depends to
the geometrical properties of building and cross sections of walls boundary members (beam and column). The Canadian Standard proposes the following equation for this angle calculation:
strips with vertical direction) according to figure 1 which is obtainable from equation (2).
As in the current study, the steel panels do not have hardening (stiffener), though they posses high width-to-thickness ratio and when lateral forces are prescribed, they behave as deep beam sheets. The tension field is formed in tensile diameter direction and considerable forces are imposed in this way, while in direction of compression diameter with critical plate-buckling little tensions take form. When force side changes, direction of tension field and forces transfer is inversed. The inclination angle of the tension field depends to the geometrical properties of building and cross sections of walls boundary members (beam and column). The Canadian Standard proposes the following equation for this angle calculation:
(2) ) L I 360 / h A / 1 ( h t 1 A 2 / L t 1 tan c 3 s b s w c w 4
Where L and hs are Length and height of throat, Ab, Ac, Ic are cross sections of beam, column and the
moment of inertia of a column respectively, while tw is the thickness of the web. After that by using
equation (3) sheet is transformed into some equivalent strips. Regarding the experimental results and recommendations of other researchers (Astaneh [8, 9]) at least 10 members in the throat was used while creating diagonal strips. The cross section area of these members is in rectangular form and is equal to the distance between two strips; the thickness of the members is the same as the calculated thickness of the design.
(3) w s s t n sin h cos L
A
where L, h are width and height of wall throat. In order to insure the quality of the side columns stiffness that will not endure any suffering from buckling while they are exposed to diametrical tension, the moment of inertia should be as follow:
(4) L h . t 00307 . 0 I 4 s c
In this method, the Canadian Standard sets this commitment that besides the initial design, columns should be controlled with B coefficient for forces from gravity loads combined with increased loads due to earthquake (equation (5)). The B Coefficient is in fact the ratio of the expected resistance of wall to the design shear in the final case. Therefore, the increased resistance of the wall sheet can be observed in the final case and the columns are designed for that.
(5) u e V V B (6)
0.5R Ft L sin2
Ve y y w cf
Where Ry is ratio of average steel yielding tension to design yield tension, Fy is steel plate's design
yield tension, and Lcf is the net distance between columns. α is the inclination angle of the diametrical
tension field in steel plate and tw is the thickness of the web plate. In this approach, axial forces in the
column due to earthquake should be obtained from overturning anchor BMu where Mu is the anchor at
column's end due to seismic loads Vu. BMu anchor must be considered at least for two first stories.
After that, anchor in other stories is calculated from multiplication of overturning anchor of that storey to coefficient B. Moreover, bending anchors of columns which are due to tension field of the web plate must increase according to B coefficient then the design continues.
For studying and calculation of structures vibration modes, they can be modeled in CSI group software environments including Etabs2000, Sap2000, and Perform 3D. In this present research, results obtained from nonlinear static analysis of three building frames under different lateral loading patterns are compared with results of nonlinear dynamic analysis.
(2)
15
Advances in Science and Technology Research Journal Vol. 10 (29), 2016where: L and hs are length and height of throat, Ab, Ac, Ic are cross sections of beam, umn and the moment of inertia of a col-umn respectively, while tw is the thickness of the web.
After that, by using equation (3) sheet is trans-formed into some equivalent strips. Regarding the experimental results and recommendations of other researchers (Astaneh [8, 9]) at least 10 members in the throat were used while creating diagonal strips. The cross section area of these members is in rectangular form and is equal to the distance between two strips; the thickness of the members is the same as the calculated thick-ness of the design.
strips with vertical direction) according to figure 1 which is obtainable from equation (2).
As in the current study, the steel panels do not have hardening (stiffener), though they posses high width-to-thickness ratio and when lateral forces are prescribed, they behave as deep beam sheets. The tension field is formed in tensile diameter direction and considerable forces are imposed in this way, while in direction of compression diameter with critical plate-buckling little tensions take form. When force side changes, direction of tension field and forces transfer is inversed. The inclination angle of the tension field depends to the geometrical properties of building and cross sections of walls boundary members (beam and column). The Canadian Standard proposes the following equation for this angle calculation:
(2) ) L I 360 / h A / 1 ( h t 1 A 2 / L t 1 tan c 3 s b s w c w 4
Where L and hs are Length and height of throat, Ab, Ac, Ic are cross sections of beam, column and the
moment of inertia of a column respectively, while tw is the thickness of the web. After that by using
equation (3) sheet is transformed into some equivalent strips. Regarding the experimental results and recommendations of other researchers (Astaneh [8, 9]) at least 10 members in the throat was used while creating diagonal strips. The cross section area of these members is in rectangular form and is equal to the distance between two strips; the thickness of the members is the same as the calculated thickness of the design.
(3) w s s t n sin h cos L
A
where L, h are width and height of wall throat. In order to insure the quality of the side columns stiffness that will not endure any suffering from buckling while they are exposed to diametrical tension, the moment of inertia should be as follow:
(4) L h . t 00307 . 0 I 4 s c
In this method, the Canadian Standard sets this commitment that besides the initial design, columns should be controlled with B coefficient for forces from gravity loads combined with increased loads due to earthquake (equation (5)). The B Coefficient is in fact the ratio of the expected resistance of wall to the design shear in the final case. Therefore, the increased resistance of the wall sheet can be observed in the final case and the columns are designed for that.
(5) u e V V B (6)
0.5R Ft L sin2
Ve y y w cf
Where Ry is ratio of average steel yielding tension to design yield tension, Fy is steel plate's design
yield tension, and Lcf is the net distance between columns. α is the inclination angle of the diametrical
tension field in steel plate and tw is the thickness of the web plate. In this approach, axial forces in the
column due to earthquake should be obtained from overturning anchor BMu where Mu is the anchor at
column's end due to seismic loads Vu. BMu anchor must be considered at least for two first stories.
After that, anchor in other stories is calculated from multiplication of overturning anchor of that storey to coefficient B. Moreover, bending anchors of columns which are due to tension field of the web plate must increase according to B coefficient then the design continues.
For studying and calculation of structures vibration modes, they can be modeled in CSI group software environments including Etabs2000, Sap2000, and Perform 3D. In this present research, results obtained from nonlinear static analysis of three building frames under different lateral loading patterns are compared with results of nonlinear dynamic analysis.
(3)
where: L, h are width and height of wall throat.
In order to insure the quality of the side col-umns stiffness that will not endure any suffering from buckling while they are exposed to diamet-rical tension, the moment of inertia should be as follows:
strips with vertical direction) according to figure 1 which is obtainable from equation (2).
As in the current study, the steel panels do not have hardening (stiffener), though they posses high width-to-thickness ratio and when lateral forces are prescribed, they behave as deep beam sheets. The tension field is formed in tensile diameter direction and considerable forces are imposed in this way, while in direction of compression diameter with critical plate-buckling little tensions take form. When force side changes, direction of tension field and forces transfer is inversed. The inclination angle of the tension field depends to the geometrical properties of building and cross sections of walls boundary members (beam and column). The Canadian Standard proposes the following equation for this angle calculation:
(2) ) L I 360 / h A / 1 ( h t 1 A 2 / L t 1 tan c 3 s b s w c w 4
Where L and hs are Length and height of throat, Ab, Ac, Ic are cross sections of beam, column and the
moment of inertia of a column respectively, while tw is the thickness of the web. After that by using
equation (3) sheet is transformed into some equivalent strips. Regarding the experimental results and recommendations of other researchers (Astaneh [8, 9]) at least 10 members in the throat was used while creating diagonal strips. The cross section area of these members is in rectangular form and is equal to the distance between two strips; the thickness of the members is the same as the calculated thickness of the design.
(3) w s s t n sin h cos L
A
where L, h are width and height of wall throat. In order to insure the quality of the side columns stiffness that will not endure any suffering from buckling while they are exposed to diametrical tension, the moment of inertia should be as follow:
(4) L h . t 00307 . 0 I 4 s c
In this method, the Canadian Standard sets this commitment that besides the initial design, columns should be controlled with B coefficient for forces from gravity loads combined with increased loads due to earthquake (equation (5)). The B Coefficient is in fact the ratio of the expected resistance of wall to the design shear in the final case. Therefore, the increased resistance of the wall sheet can be observed in the final case and the columns are designed for that.
(5) u e V V B (6)
0.5R Ft L sin2
Ve y y w cf
Where Ry is ratio of average steel yielding tension to design yield tension, Fy is steel plate's design
yield tension, and Lcf is the net distance between columns. α is the inclination angle of the diametrical
tension field in steel plate and tw is the thickness of the web plate. In this approach, axial forces in the
column due to earthquake should be obtained from overturning anchor BMu where Mu is the anchor at
column's end due to seismic loads Vu. BMu anchor must be considered at least for two first stories.
After that, anchor in other stories is calculated from multiplication of overturning anchor of that storey to coefficient B. Moreover, bending anchors of columns which are due to tension field of the web plate must increase according to B coefficient then the design continues.
For studying and calculation of structures vibration modes, they can be modeled in CSI group software environments including Etabs2000, Sap2000, and Perform 3D. In this present research, results obtained from nonlinear static analysis of three building frames under different lateral loading patterns are compared with results of nonlinear dynamic analysis.
(4)
In this method, the Canadian Standard sets this commitment that besides the initial design, columns should be controlled with B coefficient for forces from gravity loads combined with in-creased loads due to earthquake (equation (5)). The B Coefficient is in fact the ratio of the ex -pected resistance of wall to the design shear in
the final case. Therefore, the increased resistance of the wall sheet can be observed in the final case
and the columns are designed for that.
strips with vertical direction) according to figure 1 which is obtainable from equation (2).
As in the current study, the steel panels do not have hardening (stiffener), though they posses high width-to-thickness ratio and when lateral forces are prescribed, they behave as deep beam sheets. The tension field is formed in tensile diameter direction and considerable forces are imposed in this way, while in direction of compression diameter with critical plate-buckling little tensions take form. When force side changes, direction of tension field and forces transfer is inversed. The inclination angle of the tension field depends to the geometrical properties of building and cross sections of walls boundary members (beam and column). The Canadian Standard proposes the following equation for this angle calculation:
(2) ) L I 360 / h A / 1 ( h t 1 A 2 / L t 1 tan c 3 s b s w c w 4
Where L and hs are Length and height of throat, Ab, Ac, Ic are cross sections of beam, column and the
moment of inertia of a column respectively, while tw is the thickness of the web. After that by using
equation (3) sheet is transformed into some equivalent strips. Regarding the experimental results and recommendations of other researchers (Astaneh [8, 9]) at least 10 members in the throat was used while creating diagonal strips. The cross section area of these members is in rectangular form and is equal to the distance between two strips; the thickness of the members is the same as the calculated thickness of the design.
(3) w s s t n sin h cos L
A
where L, h are width and height of wall throat. In order to insure the quality of the side columns stiffness that will not endure any suffering from buckling while they are exposed to diametrical tension, the moment of inertia should be as follow:
(4) L h . t 00307 . 0 I 4 s c
In this method, the Canadian Standard sets this commitment that besides the initial design, columns should be controlled with B coefficient for forces from gravity loads combined with increased loads due to earthquake (equation (5)). The B Coefficient is in fact the ratio of the expected resistance of wall to the design shear in the final case. Therefore, the increased resistance of the wall sheet can be observed in the final case and the columns are designed for that.
(5) u e V V B (6) 0.5R Ft L sin2
Ve y y w cf
Where Ry is ratio of average steel yielding tension to design yield tension, Fy is steel plate's design
yield tension, and Lcf is the net distance between columns. α is the inclination angle of the diametrical
tension field in steel plate and tw is the thickness of the web plate. In this approach, axial forces in the
column due to earthquake should be obtained from overturning anchor BMu where Mu is the anchor at
column's end due to seismic loads Vu. BMu anchor must be considered at least for two first stories.
After that, anchor in other stories is calculated from multiplication of overturning anchor of that storey to coefficient B. Moreover, bending anchors of columns which are due to tension field of the web plate must increase according to B coefficient then the design continues.
For studying and calculation of structures vibration modes, they can be modeled in CSI group software environments including Etabs2000, Sap2000, and Perform 3D. In this present research, results obtained from nonlinear static analysis of three building frames under different lateral loading patterns are compared with results of nonlinear dynamic analysis.
(5)
strips with vertical direction) according to figure 1 which is obtainable from equation (2).
As in the current study, the steel panels do not have hardening (stiffener), though they posses high width-to-thickness ratio and when lateral forces are prescribed, they behave as deep beam sheets. The tension field is formed in tensile diameter direction and considerable forces are imposed in this way, while in direction of compression diameter with critical plate-buckling little tensions take form. When force side changes, direction of tension field and forces transfer is inversed. The inclination angle of the tension field depends to the geometrical properties of building and cross sections of walls boundary members (beam and column). The Canadian Standard proposes the following equation for this angle calculation:
(2) ) L I 360 / h A / 1 ( h t 1 A 2 / L t 1 tan c 3 s b s w c w 4
Where L and hs are Length and height of throat, Ab, Ac, Ic are cross sections of beam, column and the
moment of inertia of a column respectively, while tw is the thickness of the web. After that by using
equation (3) sheet is transformed into some equivalent strips. Regarding the experimental results and recommendations of other researchers (Astaneh [8, 9]) at least 10 members in the throat was used while creating diagonal strips. The cross section area of these members is in rectangular form and is equal to the distance between two strips; the thickness of the members is the same as the calculated thickness of the design.
(3) w s s t n sin h cos L
A
where L, h are width and height of wall throat. In order to insure the quality of the side columns stiffness that will not endure any suffering from buckling while they are exposed to diametrical tension, the moment of inertia should be as follow:
(4) L h . t 00307 . 0 I 4 s c
In this method, the Canadian Standard sets this commitment that besides the initial design, columns should be controlled with B coefficient for forces from gravity loads combined with increased loads due to earthquake (equation (5)). The B Coefficient is in fact the ratio of the expected resistance of wall to the design shear in the final case. Therefore, the increased resistance of the wall sheet can be observed in the final case and the columns are designed for that.
(5) u e V V B (6) 0.5R Ft L sin2
Ve y y w cf
Where Ry is ratio of average steel yielding tension to design yield tension, Fy is steel plate's design
yield tension, and Lcf is the net distance between columns. α is the inclination angle of the diametrical
tension field in steel plate and tw is the thickness of the web plate. In this approach, axial forces in the
column due to earthquake should be obtained from overturning anchor BMu where Mu is the anchor at
column's end due to seismic loads Vu. BMu anchor must be considered at least for two first stories.
After that, anchor in other stories is calculated from multiplication of overturning anchor of that storey to coefficient B. Moreover, bending anchors of columns which are due to tension field of the web plate must increase according to B coefficient then the design continues.
For studying and calculation of structures vibration modes, they can be modeled in CSI group software environments including Etabs2000, Sap2000, and Perform 3D. In this present research, results obtained from nonlinear static analysis of three building frames under different lateral loading patterns are compared with results of nonlinear dynamic analysis.
(6) where: Ry – is the ratio of average steel yielding
tension to design yield tension,
Fy – is steel plate’s design yield tension, Lcf – is the net distance between columns.
α – is the inclination angle of the
diamet-rical tension field in steel plate,
tw – is the thickness of the web plate.
In this approach, axial forces in the column due to earthquake should be obtained from over-turning anchor BMu where Mu is the anchor at column’s end due to seismic loads Vu. BMu
an-chor must be considered at least for two first sto -ries. After that, the anchor in other stories is
cal-culated from multiplication of overturning anchor
of that storey to coefficient B. Moreover, bending anchors of columns which are due to tension field
of the web plate must increase according to B
co-efficient then the design continues.
For studying and calculation of structures vi-bration modes, they can be modeled in CSI group software environments including Etabs2000, Sap2000, and Perform 3D. In the present re-search, the results obtained from nonlinear static analysis of three building frames under different lateral loading patterns are compared with the re-sults of nonlinear dynamic analysis.
REVIEW OF STU5DIED MODELS
In purpose of simplicity, the studied models of the present study were considered as three build-ing frames of 4, 8, and 12 symmetrical stories,
five throats with 4 meter width along with aver -age bending steel frame. The height of all stories is equal to 3.3 meters high. The structure roofs are considered to be built from joist and to be rigid. The aim of the base improvements and structures usages is educational matters. The gravity load-ing is computed accordload-ing to Iranian loadload-ing standard [14]. In addition, base shear was taken into account corresponding to standard 2800 [15], then harm amount study for buildings has been made according to criteria mentioned in Fema356 [16] and techniques presented in reference book [17]. It was revealed that the under study build-ings are not capable to respond to the prescribed loading and hence require improvements. As a result, for structural reform the steel shear wall is employed. For the purpose of designing steel shear wall, lateral loading due to earthquake must
be calculated first. Appendix R from American
standard has proposed R = 11 for bending frame
dual system behavior coefficient with steel shear
walls without stiffeners. In this case, by having R, earthquake can be calculated according to corre-sponding static method in Iranian 2800 standard.
Building plans which have been studied in this paper is presented in Figures 2a (4 storey building frame), 3a (8 storey building frame), 4a(12 storey building frame) besides the results of conducted analysis according to the following explanations.
The masonry assumptions are as follows: Steel St37, yield tension Fy=2400 kg/cm2, elastic
stiffness E = 2.1×10⁶ kg/cm2. The structural
16
and columns) and computation of change in target location are all according to criteria written in the Fema 356 and ATC 40 [18]. It worth mention-ing that, the force-web strip members’ location change curve is modeled by two line elasto-plas-tic model. The effects of hardening stress are also considered with a slope of 3% in recessive part. Modeling parameters and acceptance criteria of shear wall elements as an axial member in the traction is like an ordinary traction member (ac-cording to FEMA 356 and seismic AISC criteria) and has small compression resistance.
THE PROCEDURE AND TECHNIQUES OF
MODELS ANALYSIS
Nonlinear dynamic analyzing method and modal analysis
In order to perform nonlinear dynamic anal-ysis on the frames, also modal increased load analysis of a system with one degree of freedom seven pairs of registered acceleration mapping consist of: El centro, Kobe, Naghan, ChiChi, San Fernando, Northridge, Bam are used; all of these mappings are held on type II (according to Irani-an stIrani-andard 2800) as time history of earth drastic movement. Regarding Iranian Standard 2800, all of these acceleration mappings should be tanta-mount. In this study, the average spectrum from seven pair of acceleration mapping is coordinated with design spectrum of Standard 2800 for soil type II. After that, nonlinear dynamic analysis of principal structure is held by means of selected acceleration mappings.
Following that, by operating modal analy-sis the numerical amount of ωnand ϕn is calcu-lated for each mode. Then, Pushover analysis for each mode is done with load distribution pattern of *
n n
S = φm , and the base shear-roof
dis-placement curve (Vb–Vm) is idealized by a bi-linear procedures. After all, the fundamental curve is transferred by (Fsn/Ln) – Dn format for each mode [19, 20].
System nonlinear dynamic analysis SDOF of nth mode is operated for each of the accelera-tion mappings in order to calculate the maximum deformation (Dn) with force – displacement rela-tion ((Fsn/Ln) – Dn). For each mode the average of responses are calculated and it is followed by the calculation of the maximum roof displace-ment or target displacedisplace-ment for each mode. Until
reaching the target displacement the main struc-ture (MDOF) will be assumed as push. Response quantity in target displacement in each mode is calculated and overall response for adequate modes are combined by statistical methods such as SRSS.
In this paper, the responses resulted from MPA method (Modal Pushover Analysis) and conventional Pushover method with FEMA load distribution pattern is compared with responses from nonlinear dynamic technique. Response quantities include maximum storey displacement, relative storey displacement, and base shear. In order to conduct system nonlinear dynamic anal-ysis MDOF, SAP2000 v. 14 is employed; also for nonlinear static analysis Etabs2000 v. 9.7 soft-ware is used which are approved by Berkley uni-versity researchers.
Pushover analysis according to FEMA 273 In this study, in order to avoid errors from different approximative methods of target dis-placement determination into calculations, roof displacement resulted from MPA method is used for FEMA load distribution patterns. Thereby, for structure pushover analysis, with relative load pattern modes, uniform and SRSS is operated.
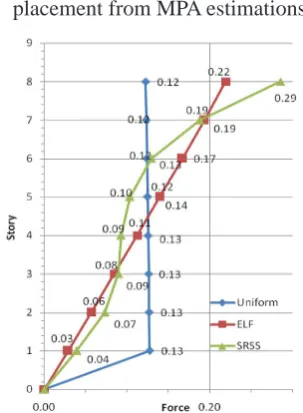
Three main FEMA load patterns which were studied in this research and the pushover analysis is held upon them can be summarized as follows:
Uniform distribution: in this pattern, the pre-scribed forces into each storey is relative to the mass and is obtained from the following equation:
SAP2000-V.14 is employed; also for nonlinear static analysis Etabs2000- V. 9.7 software is used which are approved by Berkley university researchers.
4.2 Pushover Analysis according to FEMA273
In this study, in order to prohibit errors from different approximative methods of target displacement determination into calculations, roof displacement resulted from MPA method is used for FEMA load distribution patterns. Thereby, for structure pushover analysis, with relative load pattern modes, uniform and SRSS is operated.
Three main FEMA load pattern which were studied in this research and the pushover analysis is held upon them can be summarized as follows:
1- Uniform distribution: in this pattern, the prescribed forces into each storey is relative to the mass and is obtained from the following equation:
(7) i N i j j m m S
1 *2- Equivalent Lateral Force (ELF): which is usually used when more than 75 percent of overall mass contributes in the base mode on the under study direction.
(8) k i i N i k j j j h m h m S
1 *Where i is the number of storey and i=1, 2, …, N
In the above equation k=1 for the base period T10.5, k=2 for T12.5 seconds and varies
linearly between these two amounts.
3- SRSS pattern (distribution): lateral load in this method is dependent to Inertia forces deduced from elastic spectrum analysis. In this analysis the modes contributions must be to the extent that 90 percent of the mode mass contribution to be taken into account. This analysis takes place by appropriate earthquake spectrum.
(9) i N 1 i j j f f f ~
According to FEMA guidelines, other proper load patterns which have previously been examined and controlled, can replace the above ternate patterns.
5. Examined outcome parameters from analysis results
Following the conducted analysis, by prescribing the existing FEMA patterns and load mode patterns applied in MPA method on selected modes, a comparison of these methods' accuracy and ability in facing structural responses with results from the precise method of nonlinear dynamic analysis is done.
As it was mentioned before, the response parameters which have been derived from analysis and have been compared to each other are:
1- the maximum floor displacement in percentage from building’s height
(7)
Equivalent lateral force (ELF): which is usu-ally used when more than 75 percent of overall mass contributes in the base mode on the under study direction.
SAP2000-V.14 is employed; also for nonlinear static analysis Etabs2000- V. 9.7 software is used which are approved by Berkley university researchers.
4.2 Pushover Analysis according to FEMA273
In this study, in order to prohibit errors from different approximative methods of target displacement determination into calculations, roof displacement resulted from MPA method is used for FEMA load distribution patterns. Thereby, for structure pushover analysis, with relative load pattern modes, uniform and SRSS is operated.
Three main FEMA load pattern which were studied in this research and the pushover analysis is held upon them can be summarized as follows:
1- Uniform distribution: in this pattern, the prescribed forces into each storey is relative to the mass and is obtained from the following equation:
(7) i N i j j m m S
1 *2- Equivalent Lateral Force (ELF): which is usually used when more than 75 percent of overall mass contributes in the base mode on the under study direction.
(8) k i i N i k j j j h m h m S
1 *Where i is the number of storey and i=1, 2, …, N
In the above equation k=1 for the base period T10.5, k=2 for T12.5 seconds and varies
linearly between these two amounts.
3- SRSS pattern (distribution): lateral load in this method is dependent to Inertia forces deduced from elastic spectrum analysis. In this analysis the modes contributions must be to the extent that 90 percent of the mode mass contribution to be taken into account. This analysis takes place by appropriate earthquake spectrum.
(9) i N 1 i j j f f f ~
According to FEMA guidelines, other proper load patterns which have previously been examined and controlled, can replace the above ternate patterns.
5. Examined outcome parameters from analysis results
Following the conducted analysis, by prescribing the existing FEMA patterns and load mode patterns applied in MPA method on selected modes, a comparison of these methods' accuracy and ability in facing structural responses with results from the precise method of nonlinear dynamic analysis is done.
As it was mentioned before, the response parameters which have been derived from analysis and have been compared to each other are:
1- the maximum floor displacement in percentage from building’s height
(8)
where: i is the number of storey and i = 1, 2, …, N.
In the above equation k = 1 for the base period T1 ≤ 0.5, k = 2 for T1 ≥ 2.5 seconds and varies lin -early between these two amounts.
anal-17
Advances in Science and Technology Research Journal Vol. 10 (29), 2016ysis the modes contributions must be to the extent that 90 percent of the mode mass contribution to be taken into account. This analysis takes place by appropriate earthquake spectrum.
SAP2000-V.14 is employed; also for nonlinear static analysis Etabs2000- V. 9.7 software is used which are approved by Berkley university researchers.
4.2 Pushover Analysis according to FEMA273
In this study, in order to prohibit errors from different approximative methods of target displacement determination into calculations, roof displacement resulted from MPA method is used for FEMA load distribution patterns. Thereby, for structure pushover analysis, with relative load pattern modes, uniform and SRSS is operated.
Three main FEMA load pattern which were studied in this research and the pushover analysis is held upon them can be summarized as follows:
1- Uniform distribution: in this pattern, the prescribed forces into each storey is relative to the mass and is obtained from the following equation:
(7) i N i j j m m S
1 *2- Equivalent Lateral Force (ELF): which is usually used when more than 75 percent of overall mass contributes in the base mode on the under study direction.
(8) k i i N i k j j j h m h m S
1 *Where i is the number of storey and i=1, 2, …, N
In the above equation k=1 for the base period T10.5, k=2 for T12.5 seconds and varies
linearly between these two amounts.
3- SRSS pattern (distribution): lateral load in this method is dependent to Inertia forces deduced from elastic spectrum analysis. In this analysis the modes contributions must be to the extent that 90 percent of the mode mass contribution to be taken into account. This analysis takes place by appropriate earthquake spectrum.
(9) i N 1 i j j f f f ~
According to FEMA guidelines, other proper load patterns which have previously been examined and controlled, can replace the above ternate patterns.
5. Examined outcome parameters from analysis results
Following the conducted analysis, by prescribing the existing FEMA patterns and load mode patterns applied in MPA method on selected modes, a comparison of these methods' accuracy and ability in facing structural responses with results from the precise method of nonlinear dynamic analysis is done.
As it was mentioned before, the response parameters which have been derived from analysis and have been compared to each other are:
1- the maximum floor displacement in percentage from building’s height
(9)
According to FEMA guidelines, other proper load patterns which have previously been exam-ined and controlled, can replace the above ternate patterns.
EXAMINED OUTCOME PARAMETERS
FROM ANALYSIS RESULTS
Following the conducted analysis, by pre-scribing the existing FEMA patterns and load mode patterns applied in MPA method on se-lected modes, a comparison of these methods’ ac-curacy and ability in facing structural responses with results from the precise method of nonlinear dynamic analysis is done.
As it was mentioned before, the response pa-rameters which have been derived from analysis and have been compared to each other are as follows: • the maximum floor displacement in percent
-age from building’s height,
(10) FloorDisplacement 100 HeightFrame
2- relative floor displacement in percent (Drift Ratio)
(11) FloorDrift 100 StoryHeight
3- base shear
from the above mentioned parameters, the second parameter has the most importance in estimation of building destruction.
Next in this section, significant points in conducted analysis and a summary of principal methods are presented added by the manipulated method in this study.
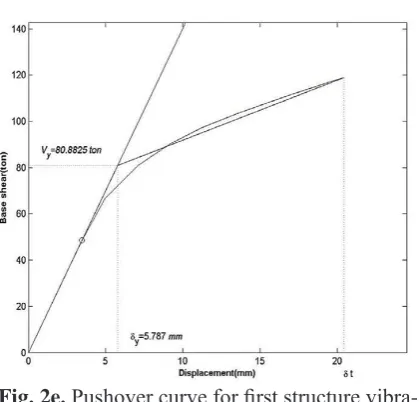
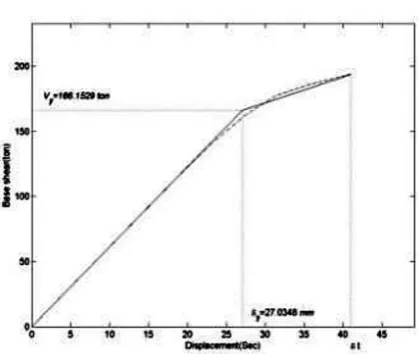
5.1 Idealization of bilinear pushover curve
Various methods can be applied for making nonlinear systems as bilinear ones. In this paper, intended to equalize the structure capacity curve, MATLAB programming environment is used in order to make the structure capacity curve bilinear according to FEMA 356. Therefore, the equivalent pushover curve of a system with one degree of freedom is idealized in a way that the area beneath the bilinear curve is equal to the area under the pushover curve. Because the maximum amount of roof drift is not given at the beginning, choosing the ultimate point of pushover curve and the surface under it can raise some doubts. Hence, in order to determine the area under the pushover curve and its bilinear idealization an iterating method is employed. On the first step, a point is assumed as the selected displacement target on the pushover curve, and then the area under the curve is calculated right from the assumed point. According to this calculated area, the pushover curve is idealized in a bilinear form. By means of the achieved bilinear curve, the nonlinear dynamic analysis is performed and the peak displacement of the ideal bilinear system can be obtained. This peak displacement is compared with the initial assumed point. If these two points are coincide the target is reached, else the peak displacement due from nonlinear dynamic analysis is substituted with the initial presumed point and the process is once again repeated until the initial assumed point and the corresponding point of peak displacement for a system with one degree of freedom would converge equally with each other.
5.2 Determination of the peak displacement for nonlinear systems with one degree of freedom
In conventional Pushover methods, for determining the peak displacement of equivalent system with one degree of freedom and estimation of target displacement in different orders, various methods can be used. These methods can be categorized in three groups:
1- FEMA356 method (displacement coefficient methods), in this method the response of a nonlinear system with one degree of freedom is estimated from the elastic response of system with one degree of freedom and by means of adjustment factors.
2- Capacity spectrum method (ATC-40), in this method the simplified elastic response spectrum (demand spectrum) is used in acceleration-displacement (ADRS) format. In fact, instead of using inelastic demand spectrum the elastic spectrum equivalent with high damping is applied. Besides, the nonlinear system with one degree of freedom is equalized with a linear system with low stiffness and high damping ratio.
3- N2 method, in this method in order to estimate the maximum displacement of the equivalent system with one degree of freedom, inelastic spectrum with different
formation ratio (µ) is directly used.
5.3 Averaging of target displacement
(10)
• relative floor displacement in percent (Drift
Ratio), (10) FloorDisplacement 100 HeightFrame
2- relative floor displacement in percent (Drift Ratio)
(11) FloorDrift 100 StoryHeight
3- base shear
from the above mentioned parameters, the second parameter has the most importance in estimation of building destruction.
Next in this section, significant points in conducted analysis and a summary of principal methods are presented added by the manipulated method in this study.
5.1 Idealization of bilinear pushover curve
Various methods can be applied for making nonlinear systems as bilinear ones. In this paper, intended to equalize the structure capacity curve, MATLAB programming environment is used in order to make the structure capacity curve bilinear according to FEMA 356. Therefore, the equivalent pushover curve of a system with one degree of freedom is idealized in a way that the area beneath the bilinear curve is equal to the area under the pushover curve. Because the maximum amount of roof drift is not given at the beginning, choosing the ultimate point of pushover curve and the surface under it can raise some doubts. Hence, in order to determine the area under the pushover curve and its bilinear idealization an iterating method is employed. On the first step, a point is assumed as the selected displacement target on the pushover curve, and then the area under the curve is calculated right from the assumed point. According to this calculated area, the pushover curve is idealized in a bilinear form. By means of the achieved bilinear curve, the nonlinear dynamic analysis is performed and the peak displacement of the ideal bilinear system can be obtained. This peak displacement is compared with the initial assumed point. If these two points are coincide the target is reached, else the peak displacement due from nonlinear dynamic analysis is substituted with the initial presumed point and the process is once again repeated until the initial assumed point and the corresponding point of peak displacement for a system with one degree of freedom would converge equally with each other.
5.2 Determination of the peak displacement for nonlinear systems with one degree of freedom
In conventional Pushover methods, for determining the peak displacement of equivalent system with one degree of freedom and estimation of target displacement in different orders, various methods can be used. These methods can be categorized in three groups:
1- FEMA356 method (displacement coefficient methods), in this method the response of a nonlinear system with one degree of freedom is estimated from the elastic response of system with one degree of freedom and by means of adjustment factors.
2- Capacity spectrum method (ATC-40), in this method the simplified elastic response spectrum (demand spectrum) is used in acceleration-displacement (ADRS) format. In fact, instead of using inelastic demand spectrum the elastic spectrum equivalent with high damping is applied. Besides, the nonlinear system with one degree of freedom is equalized with a linear system with low stiffness and high damping ratio.
3- N2 method, in this method in order to estimate the maximum displacement of the equivalent system with one degree of freedom, inelastic spectrum with different
formation ratio (µ) is directly used.
5.3 Averaging of target displacement
(11)
• base shear from the above mentioned param-eters, the second parameter has the most im-portance in estimation of building destruction.
Next in this section, significant points in con -ducted analysis and a summary of principal meth-ods are presented together with the manipulated method in this study.
Idealization of bilinear pushover curve
Various methods can be applied for making nonlinear systems as bilinear ones. In this paper, it is intended to equalize the structure capacity curve, thus, MATLAB programming environ-ment is used in order to make the structure ca-pacity curve bilinear, according to FEMA 356. Therefore, the equivalent pushover curve of a system with one degree of freedom is idealized
in a way that the area beneath the bilinear curve is equal to the area under the pushover curve. Because the maximum amount of roof drift is not given at the beginning, choosing the ultimate point of pushover curve and the surface under it can raise some doubts. Hence, in order to deter-mine the area under the pushover curve and its bilinear idealization an iterating method is
em-ployed. On the first step, a point is assumed as
the selected displacement target on the pushover curve, and then the area under the curve is calcu-lated right from the assumed point. According to this calculated area, the pushover curve is ideal-ized in a bilinear form. By means of the achieved bilinear curve, the nonlinear dynamic analysis is performed and the peak displacement of the ideal bilinear system can be obtained. This peak dis-placement is compared with the initial assumed point. If these two points coincide, the target is reached, else the peak displacement due from nonlinear dynamic analysis is substituted with the initial presumed point and the process is once again repeated until the initial assumed point and the corresponding point of peak displacement for a system with one degree of freedom would con-verge equally with each other.
Determination of the peak displacement for nonlinear systems with one degree of freedom
In conventional Pushover methods, for deter-mining the peak displacement of equivalent sys-tem with one degree of freedom and estimation of target displacement in different orders, various methods can be used. These methods can be cat-egorized in three groups:
• FEMA 356 method (displacement coefficient
methods), in this method the response of a nonlinear system with one degree of freedom is estimated from the elastic response of sys-tem with one degree of freedom and by means of adjustment factors.
• Capacity spectrum method (ATC-40), in this
18
• N2 method, in this method in order to estimate the maximum displacement of the equivalent system with one degree of freedom, inelastic spectrum with different formation ratio (µ) is directly used.
Averaging of target displacement
The accuracy of the MPA method is totally dependent to severity of earth movements. The results of this method can be trusted only if the MPA procedure is performed for some earth-quakes and from the achieved results are aver-aged. This process requires massive and time consuming calculations.
In this study and during the performed proce-dures, seven pairs of accelerating mappings are used for nonlinear dynamic analysis but the re-cords are compared according to 2800 standard criteria whose responses must be averaged based on FEMA 356. The common method in averag-ing is arithmetical method in which the sum of responses is divided by their number and the con-tribution of each response in the average amount is supposed equal. This method is valid for es-timating linear methods but because of compli-cated essence of responses in nonlinear dynamic analysis, this method does not seem to be proper. Therefore, there is another method which is ex-ponential averaging. Converting the sophisticated parameters to logarithmic coordinates will cause the changes to accede to linear state which is usu-al in seismic engineering.
In this paper, the arithmetical averaging method is employed; however, for maximum dis-placement of equivalent system with one degree of freedom under nonlinear dynamic analysis re-garding the nonlinear nature of the responses, ex-ponential averaging is used.
For utilization of exponential averaging method, average Di is obtained from the follow-ing equation:
The accuracy of the MPA method is totally dependent to severity of earth movements. The results of this method can be trusted only if the MPA procedure is performed for some earthquakes and from the achieved results are averaged. This process requires massive and time consuming calculations.
In this study and during performed procedures, seven pair of accelerating mapping is used for nonlinear dynamic analysis but records are compared according to 2800 standard criteria which the responses must be averaged based on FEMA356. The common method in averaging is arithmetical method in which sum of responses is divided by their number and the contribution of each response in the average amount is supposed equal. This method is valid for estimating of linear methods but because of complicated essence of responses in nonlinear dynamic analysis this method does not seems to be proper enough. Therefore, there is another method which is exponential averaging. Converting the sophisticated parameters to logarithmic coordinates will cause the changes to accede to linear state which is usual in seismic engineering.
In this paper, the arithmetical averaging method is employed; however, for maximum displacement of equivalent system with one degree of freedom under nonlinear dynamic analysis regarding the nonlinear nature of the responses, exponential averaging is used.
For utilization of exponential averaging method, average Di is obtained from the following equation:
n i i 1
Ln(D ) ˆ
D(n) exp
n
(12)
6. Results presentation and evaluation of performed analysis (For under study building frames):
6.1 Analyzing 4-storey frame with steel shear wall
For under study 4-sorey structure illustrated in figure a-2, different analysis of nonlinear static and dynamic, which have been explained in previous sections, were performed. The results from nonlinear dynamic analysis of 4-storey frame are achieved according to selected acceleration mapping and pursuant to the process that have been described previously. The amounts of relative displacement and maximum storey displacement in nonlinear dynamic analysis of a 4-storey building are depicted respectively in figures b-2 and C-2.
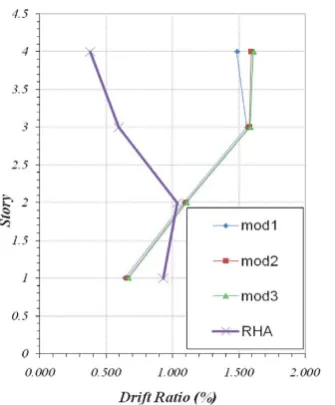
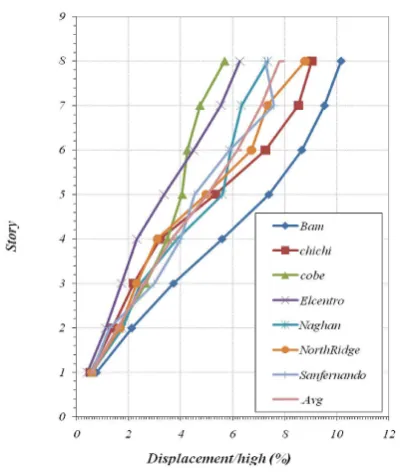
Moreover, a modal analysis is first implemented for the structure; subsequently, in accordance with each of the first three modes, the pushover analysis with load pattern proportion to each mode is performed. In figures D-2 and G-2, responses of structure modal analysis, vibration mode of structure, bilinear idealized capacity curve (base shear according to roof displacement), base building shear, and effective base shear is shown. In addition, considering the implemented analysis, respectively in figures h-2 and i-2 the results of relative displacements and maximum storey displacement for different vibration modes are demonstrated and compared with the results of nonlinear dynamic analysis.
Following the performed nonlinear analysis on 4-storey structure frame, pushover analysis study according to FEMA guideline is carried out. In figure J-2, the results from structure pushover analysis and the shape of structure lateral load pattern is shown based on the three methods mentioned in this section. For these analysis and lateral load patterns, the idealized bilinear diagram of capacity curve (base shear according to roof displacement) can be achieved which have been considered in the conclusion section. In the following, in figures K-2 and L-2 the final results of relative storey displacement and maximum displacements bye different methods are shown.
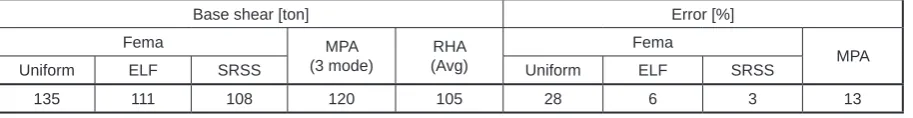
Table I, summarizes the result comparison of base shear structure of 4-storey frame under various analysis.
Table I – Amounts of building base shear in 4-storey frame by means of MPA estimations (in 3 modes), FEMA, and estimation errors
Base Shear(ton) Error (%)
Fema MPA RHA Fema MPA
(12)
RESULTS PRESENTATION AND
EVALUATION OF PERFORMED ANALYSIS
(FOR UNDER STUDY BUILDING FRAMES)
Analyzing 4-storey frame with steel shear wall For the analyzed 4-sorey structure illustrated in Figure 2a, a different analysis of nonlinear static and dynamic, which was explained in the previous sections, were performed. The results from nonlinear dynamic analysis of 4-storey frame are achieved according to selected accel-eration mapping and pursuant to the process that have been described previously. The amounts of relative displacement and maximum storey displacement in nonlinear dynamic analysis of a 4-storey building are depicted in Figures 2b and 2c respectively.
Moreover, a modal analysis is the first imple -mented for the structure; subsequently, in
accor-dance with each of the first three modes, the push -over analysis with load pattern proportion to each mode is performed. In Figures 2d and 2g, respons-es of structure modal analysis, vibration mode of structure, bilinear idealized capacity curve (base shear according to roof displacement), base build-ing shear, and effective base shear is shown. In addition, considering the implemented analysis, respectively in Figures 2h and 2i the results of rela-tive displacements and maximum storey displace-ment for different vibration modes are demon-strated and compared with the results of nonlinear dynamic analysis.
Following the performed nonlinear analysis on 4-storey structure frame, pushover analysis study according to FEMA guideline is carried out. In Figure 2j, the results from structure pushover analysis and the shape of structure lateral load pattern is shown based on the three methods men-tioned in this section. For these analysis and lat-eral load patterns, the idealized bilinear diagram of capacity curve (base shear according to roof displacement) can be achieved which have been considered in the conclusion section. In the
fol-lowing, in Figures 2k and 2l the final results of
Table 1. Amounts of building base shear in 4-storey frame by means of MPA estimations (in 3 modes), FEMA, and estimation errors
Base shear [ton] Error [%]
Fema MPA
(3 mode)
RHA (Avg)
Fema
MPA
Uniform ELF SRSS Uniform ELF SRSS
19
Advances in Science and Technology Research Journal Vol. 10 (29), 2016Fig. 2a. Frame under study of 4-storey building
frame
Fig. 2b. Relative displacement in nonlinear
dynamic analysis
Fig. 2c. Maximum storey displacement in
non-linear dynamic analysis
Fig. 2d. Structure mode shape in three first modes
Fig. 2e. Pushover curve for first structure vibra
20
Fig. 2g. Pushover curve for third mode
Fig. 2h. determination of relative storey
dis-placement from MPA estimations
Fig. 2i. Determination of maximum storey
dis-placement from MPA estimations
Fig. 2j. FEMA load distribution patterns scheme
Fig. 2k. relative storey displacement from MPA
and FEMA estimations
Fig. 2l. maximum storey displacement from
21
Advances in Science and Technology Research Journal Vol. 10 (29), 2016relative storey displacement and maximum dis-placements by different methods are shown.
Table 1 summarizes the result comparison of base shear structure of 4-storey frame under vari-ous analysis.
Results from 8-storey frame analysis with steel shear wall
For the 8-storey frame pictured in Figure 3a, various nonlinear static and dynamic analyses likewise sections 4 and 5 have been performed. The results achieved from nonlinear dynamic analysis on 8-storey frame according to selected acceleration mappings and the mentioned pro-cedure, the relative displacement and maximum storey displacement diagrams in nonlinear dy-namic analysis are depicted in Figures 3b and 3c.
In other stages of the analyses, for the first
structure the modal analysis is conducted; then
based on each three first modes, the pushover
analysis with load pattern proportionate to each mode is implemented.
Based on the results from structure mode shape
in three first modes in Figure 3d, the pushover load
curve (capacity or base shear curve in contrary to roof displacement) are drawn in Figures 3e and
3g. In these figures the bilinear idealized capac -ity curves of the structure (base shear according to roof displacement and effective base shear) can be observed. In Figures 3h and 3i, the results from relative displacement and the maximum story dis-placement of MPA estimation in comparison with nonlinear dynamic method are presented. More-over, for the performed nonlinear analysis of the 8-storey structural frame (as middle order frames), the pushover analysis is done according to FEMA guideline and load patterns. Figure 3j shows the structure lateral load pattern according to the three methods denoted before. For the accomplished pushover analysis with the recommended lateral load patterns, the bilinear idealized capacity curve (base shear according to roof displacement) is
achieved. In Figures 3k and 3l the final relative
story displacement and the maximum displace-ments can be observed based on different
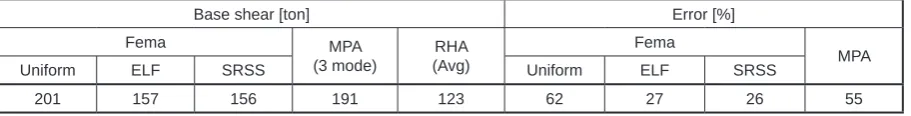
meth-ods. In Table 2, the result of comparison between the structure base shear under different analysis method for 8-storey frame is shown.
Results from 12-storey frame analysis with steel shear wall
For the 12-storey frame structure shown in Figure 4a, different static and dynamic nonlin-ear analyses have been performed. The results from nonlinear dynamic analysis for this frame according to selected acceleration mappings and the previously stated procedure are drawn in a form of relative displacement and maximum sto-rey displacement diagrams which are depicted in Figures 4b and 4c.
Following the analyses for this frame, firstly
the modal analysis is performed and then
accord-ing to each three first mode, the pushover analysis
with proportional loading pattern with each mode is done. In Figures 4d to 4g, the results of struc-ture modal analysis, vibration mode shape of the structure, the idealized bilinear capacity curve diagram (base shear according to roof displace-ment), and the amounts of building base shear, structure effective base shear, target displacement, and corresponding yielding shear displacement are presented. In addition, regarding the analyses, Figures 4h and 4i respectively show the relative displacement and maximum storey displacement for different vibration modes, in comparison with the results from nonlinear dynamic analysis. Fi-nally, the nonlinear pushover analysis according to FEMA guideline is performed on the structural 12-storey frame according to the explanations in previous sections. In Figure 4j, the structure lat-eral load based on the three methods described in this section can be observed. For these analyses and also lateral load patterns, the idealized bilin-ear capacity curve (base shbilin-ear according to roof displacement) is calculated. The results of struc-ture pushover analysis are considered in
conclu-sion section. Moreover, in figures 4k and 4l, the final results of relative storey displacement and
maximum displacements from various methods are shown. In Table 3, comparison results
be-Table 2. Amounts of building base shear in 8-storey frame by means of MPA estimations (in 3 modes), FEMA, and estimation errors
Base shear [ton] Error [%]
Fema MPA
(3 mode)
RHA (Avg)
Fema
MPA
Uniform ELF SRSS Uniform ELF SRSS
22
Fig. 3a. Frame under study of 8-storey building
frame
Fig. 3b. Relative displacement in nonlinear
dynamic analysis
Fig. 3c. Maximum storey displacement in
non-linear dynamic analysis
Fig. 3d. Structure mode shape in three first modes
Fig. 3e. Pushover curve for first structure vibra
23
Advances in Science and Technology Research Journal Vol. 10 (29), 2016Fig. 3g. Pushover curve for third mode
Fig. 3h. Determination of relative storey
dis-placement from MPA estimations
Fig. 3i. Determination of maximum storey
dis-placement from MPA estimations
Fig. 3j. FEMA load distribution patterns scheme
Fig. 3k. relative storey displacement from MPA
and FEMA estimations
Fig. 3l. Maximum storey displacement from
24
Fig. 4a. Frame under study of 12-storey building
frame
Fig. 4b. Relative displacement in nonlinear
dynamic analysis
Fig. 4c. Maximum storey displacement in
non-linear dynamic analysis
Fig. 4d. Structure mode shape in three first modes
Fig. 4e. Pushover curve for first structure vibra
25
Advances in Science and Technology Research Journal Vol. 10 (29), 2016Fig. 4g. Pushover curve for third mode
Fig. 4h. Determination of relative storey
dis-placement from MPA estimations
Fig. 4i. Determination of maximum storey
dis-placement from MPA estimations
Fig. 4j. FEMA load distribution patterns scheme
Fig. 4k. relative storey displacement from MPA
and FEMA estimations
Fig. 4l. Maximum storey displacement from