Some Malpractices in Medical Statistics
S. JAMES KILPATRICK, JR.Department of Biometry, Medical College of Virginia, Richmond
Since it is now fashionable for papers in medical journals to con-tain statistical notations, it also fol-lows that in a certain fraction of these the statistical content is wrongly applied. These malprac-tices may be classified as numerical, statistical, and methodological. To illustrate some of the most com-monly occurring errors the follow-ing examples are given.
Numerical Conventions
The number of decimals given in an observation should show the accuracy of the measurement. For example, blood pressure is meas-ured to the nearest mm Hg. How-ever, if one comes across a systolic blood pressure of 123.2, one is en-titled to expect that the person used a sensitive manometer which could read to tenths of a mm Hg. Another example, which is especially rele-vant at Medical College of Virginia, is the question of how many deci-mals should be shown in students' standard scores.
It is generally assumed that, when repeated observations are made, the person collecting the data is meas-uring to the same degree of accu-racy throughout. The same number of decimal points should therefore be given. Thus, if one were describ-ing the elevation of systolic blood pressure, where this is calculated as "after treatment minus before treat-ment," one might measure to one decimal, e.g., 0.4 mm Hg. In this case one would expect that a zero reading be given as 0.0. This would mean that no detectable difference was observed to the nearest tenth
mm Hg. An anomaly arises when measurements made to the nearest fraction are converted into decimal notations. Thus, if body weight was measured to the nearest quarter pound because the quarter pound was the smallest weight on a scale, one might want to record a weight of 170~ as 170.25 lb. This figure, however, suggests that weight was measured to the nearest hundredth of a pound, which is not the case. There is no easy solution to this anomaly except to work in the basic units, in this case quarter pounds. In this way decimals are eliminated: 170~ would then be given as 641 quarter pounds.
Another useful convention re-garding the numerical presentation of data is that comparative statis-tics should be expressed to the same base. In a recent article on cystic fibrosis of the pancreas, an author l!lsed on the same page odds, fractions, and percentages as are exemplified in the following hypo-thetical extracts:
"From an earlier paper we showed that the odds of having a further affected child were 1/13. In this study the proportion of af-fected children (excluding the pro-positus) was 8/57." The difficulty of comparing 1 in 13 with 8 in 57 can be alleviated by writing "From an earlier paper we showed that the proportion of having a further affected child was 0.1 or 1/14. In this study the proportion of affected children (excluding the propositus) was 0.14 or 8/57." It is now ap-parent that the current study re-vealed a slightly higher frequency of affected children than the older
study, but that this was unreliable because of the small number on which the first estimate was based, as is revealed by its expression to only one decimal point.
"The pH of sweat in 11 of the normal sibs was measured, and this was found to be elevated in 5 ( 45 .45 % ) . " This might better be written as "The pH of sweat in all of the normal sibs was measured and this was found to be elevated in about 0.5 (5/11) ."The well-known tendency to express everything in terms of a percentage leads to a spurious degree of sensitivity if the base is much less than a hundred. Moreover, percentages are often grossly misleading especially when no denominator is given. Consider the statement "43% of patients in the current study with regional ile-itis had blood group 0. This was lower than the 56% reported by our earlier study." On the face of it this would suggest that regional ileitis is changing its relationship to blood group 0. However, when one realizes that the 43% is based on 3 patients out of a total of 7 having blood group 0 and the 56% based on 5 out of 9, the difference is immediately seen to be unim-portant.
Wrong Denominators
used. Perhaps the most serious crit-icism of the use of the mean is that it covers up what was actually done. A mean may not reveal, for example, that three observations of a given response were made and the figure reported represents the average of the two of these which were closest together. Here the in-vestigator is essentially throwing away one-third of his information. Again, an average says nothing about the underlying distribution which is too often assumed to be normal.
Estimations of Accuracy
A convention has become estab-lished of reporting statistics plus or minus a small number. This con-vention may have been borrowed from engineering or laboratory sci-ences in which the number follow-ing the plus or minus sign is an estimation of the degree of accu-racy of the foregoing figure. How-ever, nowadays this small figure usually represents a statistical esti-mate of variability. The question immediately arises of what estimate this is. Thus, the mean hemoglobin of four aliquots of blood may be given as 10.5 ± 0.2 grams per 100 ml. This figure of 0.2 could either represent a measure of variability (the standard deviation) of the four observations around the mean, or it might refer to an estimation of the variability of this mean and others, based on four estimations around the true value of hemoglo-bin for this pool of blood (the standard error). One can only dis-criminate between these two alter-natives in the light of other infor-mation given in the report or in the context of the use of the 10.5 ± 0.2. There have been occasions in which statistic comparable to 0.2 was calculated as the standard error of the mean, that is, it represented the accuracy of the mean about the true value, but this figure was sub-sequently used as though it de-scribed the variability of the origi-nal observations about the sample
S. J. KILPATRICK, JR.
mean, giving thus, a spurious de-gree of reproducibility to the tech-nique.
Assumptions of Normality
Parametric statistical techniques are based largely on the assump-tion of an underlying normal dis-tribution. In a large sample, the assumption of normality can be tested directly. Most medical ap-plications of parametric statistical methods are made, however, to small samples in which the normal assumption cannot properly be tested. Many practitioners of statis -tics today prefer not to have to rely on an assumption as the corner-stone of their analytical methods. Hence, the increasing tendency to use non-parametric or distribution-free procedures. The results of this new approach are reflected in sta-tistical tables. For example, Docu-menta Geigy ( 1962) gives exact
confidence limits for a sample pro-portion and exact
x
2 values for 2 X 2 contingency tables for sample sizes up to 60.Inappropriate P Values
The use of P in medical journals has become so widespread that it is perhaps useful here to redefine how this is used and what it means. In
terms of a comparative. trial such as the comparison of two drugs, one may assume generally, for ex-ample,
1) that the two treatments have in reality no different effect,
2) that patients or subjects are allocated strictly at random to one or other of these treatments,
3) that the distribution of the response to therapy follows a nor-mal distribution,
4) that the variability of re-sponses is the same in the groups compared.
The statement "P
<
0.05" then means that the probability is less than 5 % of finding a difference as great or greater than that observed due to random sampling variation.Such a low probability is inter-preted as spuriously low because one of the four assumptions is not warranted. If the first assumption is wrong, then in fact there is a difference between the effects of treatment.
The statement "P
<
0.05" clearly then does not prove the reality oftreatment differences. Other inter-pretations are always possible un-less the other three assumptions are known to hold. Even then, we always have the possibility (even though this is unlikely) that the observed difference was due to ran-dom sampling variation and that no real treatment difference exists.
Probability values should not then be calculated or quoted when the four assumptions given above or some other set of assumptions previously specified are unrealistic. An example of the inappropriate use of P (unhappily this is a real example) occurred in a teaching handout to medical students in a British university. In this handout, statistics were given on the differ-ential death rates from leukemia in males and females. This was fol-lowed by the statement, "These sex differences are clearly significant (P
<
10-10 ) ." Such a statement is wrong since the equivalent assump-tions to 2), 3), and 4) in this situa-tion are not warranted. Moreover, the statement is superfluous. There is clearly a difference in these popu-lation-based sex-specific death rates from leukemia.Significance of Repeated Tests
Not only are tests of significance inappropriately applied to surveys, but often by the multifactor nature of the data and the lack of specific hypotheses, batteries of significance
used. Perhaps the most serious crit-icism of the use of the mean is that it covers up what was actually done. A mean may not reveal, for example, that three observations of a given response were made and the figure reported represents the average of the two of these which were closest together. Here the in-vestigator is essentially throwing away one-third of his information. Again, an average says nothing about the underlying distribution which is too often assumed to be normal.
Estimations of Accuracy
A convention has become estab-lished of reporting statistics plus or minus a small number. This con-vention may have been borrowed from engineering or laboratory sci-ences in which the number follow-ing the plus or minus sign is an estimation of the degree of accu-racy of the foregoing figure. How-ever, nowadays this small figure usually represents a statistical esti-mate of variability. The question immediately arises of what estimate this is. Thus, the mean hemoglobin of four aliquots of blood may be given as 10.5 ± 0.2 grams per 100 ml. This figure of 0.2 could either represent a measure of variability (the standard deviation) of the four observations around the mean, or it might refer to an estimation of the variability of this mean and others, based on four estimations around the true value of hemoglo-bin for this pool of blood (the standard error). One can only dis-criminate between these two alter-natives in the light of other infor-mation given in the report or in the context of the use of the 10.5
± 0.2. There have been occasions in which statistic comparable to 0.2 was calculated as the standard error of the mean, that is, it represented the accuracy of the mean about the true value, but this figure was sub-sequently used as though it
de-, scribed the variability of the origi-nal observations about the sample
S. J. KILPATRICK, JR.
mean, giving thus, a spurious de-gree of reproducibility to the tech-nique.
Assumptions of Normality
Parametric statistical techniques are based largely on the assump-tion of an underlying normal dis-tribution. In a large sample, the assumption of normality can be tested directly. Most medical ap-plications of parametric statistical methods are made, however, to small samples in which the normal assumption cannot properly be tested. Many practitioners of statis-tics today prefer not to have to rely on an assumption as the corner-stone of their analytical methods. Hence, the increasing tendency to use non-parametric or distribution-free procedures. The results of this new approach are reflected in sta-tistical tables. For example, Docu-menta Geigy ( 1962) gives exact confidence limits for a sample pro-portion and exact
x
2 values for 2 X2 contingency tables for sample sizes up to 60.
Inappropriate P Values
The use of P in medical journals has become so widespread that it is perhaps useful here to redefine how this is used and what it means. In terms of a comparative. trial such as the comparison of two drugs, one may assume generally, for ex-ample,
1) that the two treatments have in reality no different effect,
2) that patients or subjects are allocated strictly at random to one or other of these treatments,
3) that the distribution of the response to therapy follows a nor-mal distribution,
4) that the variability of re-sponses is the same in the groups compared.
The statement "P
<
0.05" then means that the probability is less than 5 % of finding a difference as great or greater than that observed due to random sampling variation.Such a low probability is inter-preted as spuriously low because one of the four assumptions is not warranted. If the first assumption is wrong, then in fact there is a difference between the effects of treatment.
The statement "P
<
0.05" clearly then does not prove the reality of treatment differences. Other inter-pretations are always possible un-less the other three assumptions are known to hold. Even then, we always have the possibility (even though this is unlikely) that the observed difference was due to ran-dom sampling variation and that no real treatment difference exists.Probability values should not then be calculated or quoted when the four assumptions given above or some other set of assumptions previously specified are unrealistic. An example of the inappropriate use of P (unhappily this is a real example) occurred in a teaching handout to medical students in a British university. In this handout, statistics were given on the differ-ential death rates from leukemia in males and females. This was fol-lowed by the statement, "These sex differences are clearly significant (P
<
10-10 ) ." Such a statement is wrong since the equivalent assump-tions to 2), 3), and 4) in this situa-tion are not warranted. Moreover, the statement is superfluous. There is clearly a difference in these popu-lation-based sex-specific death rates from leukemia.Significance of Repeated Tests
all, he has asked for ( 15 X 14) /2
=
105 values. If the 5 % level of sig-nificance is applied throughout, ap-proximately five of the 105 values will be sufficiently large to be judged technically significant even though the 15 items are uncorre-lated in the population.Inclusion of Pilot Data in a Subsequent Experiment
This is another malpractice some-what similar to the above. The ex-perimenter, by inclusion of pilot data, tends to prejudice the result of the experiment in terms of a favorable result. If a full-scale ex-periment is done, this is often be-cause the results in the pilot have been encouraging. By adding pilot data, the experiment is already half-way towards technical significance. The analysis of a fullscale experi-ment should not, therefore, incor-porate the pilot data except after deep consideration on the effects of such inclusion on the results.
Indices and Ratios
There are 125 indices listed in Dorland's Illustrated Medical
Dic-tionary. This shows how
fashion-able it is to construct an index to report results. Statistically, there are a number of reasons why the use of indices should be avoided where possible. Consider a situa-tion in which there are p different responses and q concomitant fac-tors. Let the responses be y,, Y2, ... yp where p ;::;.: 1, and the concomi-tant factors be x,, x,, . . . x. where q ;::;.: 0. According to the situation and the number of y's and x's, the research worker tends to use a sim-ple ratio of y/x, or a weighted sum LWY of the y's, or a combination Lwy/x or LWY/ Lwx.
Ratios of y/x of a response y to a concomitant variate x are used extremely frequently, especially in therapeutic experiments, e.g., dose per kg body weight, or in the re-sponse to treatment of a part to the
MALPRACTICES IN MEDICAL STATISTICS
whole, e.g., change in weight of an organ/change in body weight. Two statistical criticisms of the use of ratios are that the ratio of two normal variates is not necessarily normal, and that the use of a ratio assumes a linear relationship. Rather than assuming a propor-tional relationship, it is better to estimate the relationship from the raw data. The original analysis of total acid output (T.A.0.) in rats on different doses of thyroxine (Blair et al., 1965) used T.A.0. mg/lOOg body weight. This was, however, unnecessary since further analysis
showed body weights did not differ
significantly among tested groups.
If they had differed, the estimated regression of T.A.0. on body weight could have been used.
Weighted sums occur when there are a number of responses to be summarized and are of the form LWY where w represents the rela-tive weight. Examples occur in di-agnostic indices, e.g., in the clinical diagnosis of thyrotoxicosis (Crooks, Murray, and Wayne, 1959), in the diagnosis of rheumatoid arthritis (Mainland, 1964). Another exam-ple is the combination of standard scores of medical students. There is a dangerous tendency today to arbitrarily score subjective impres-sions. This leads to pseudo-quanti-fication. In adding these scores, much information is lost in the process. Moreover, an additive combination is not necessarily the best because of the non-independ-ence of different signs or symptoms. The determination of weights may also be made on an extremely ad hoc basis. Thus, it is often better to use a multiple classification or, if the responses are measured, to use multivariate techniques which, with the advent of fast digital com-puters, are becoming increasingly practicable.
Indices of the form Lw(y / x) or LWY/Lwx, i.e., a weighted sum of ratios or the ratio of two weighted sums. An example of the first occurs in a retrospective study of births (Gruenwald and Mi nth, 1961).
The authors quote a mean ratio of
placenta weight (PW) to a birth weight (BW). This might be ex-pressed as (1/n)L(PW /BW) where n is the number of births. (Un-fortunately, the authors mistakenly calculate the mean placenta weight divided by the mean body weight.) The index formed from the ratio of two weighted sums is best exemplified by the Standardized Mortality Ratio (S.M.R.). This compares the mortality in an occu-pational or other group relative to a standard population. The most com-mon misuse of this index is to form the ratio of two S.M.R.'s which has little meaning or justification since the weighting systems in two S.M.R.'s are different (Kilpatrick, 1963).
The use of indices and index numbers is not then recommended since no single figure can summa-rize all the relevant information in a comparison and since an index may be misleading because the tacit assumptions underlying its use may be wrong.
Design of the Investigation
All appearances to the contrary, most of the above malpractices are
not serious in that they can be
rem-edied by recourse to the original data if this is still available. Much more serious are those errors which affect the basic data recorded. Stat-isticians prefer to be consulted
be-!
ore the study is initiated in order to guard against this type of irre-medial error.unambigu-Table 2
Water A
None 3
Moderate water 3
Excess water 3
Table 3
Water A
None 9
Moderate water
Excess water
Table 4
Diet A
Excess water 9
Table 5
Water
None
Moderate
Excess
Diet
B
3
3
3
Diet
B
9
B
9
Diet B
9
9
9
c
3
3
3
c
9
c
9
S. J. KILPATRICK, JR.
ously answer the questions posed (Cochran, 1965).
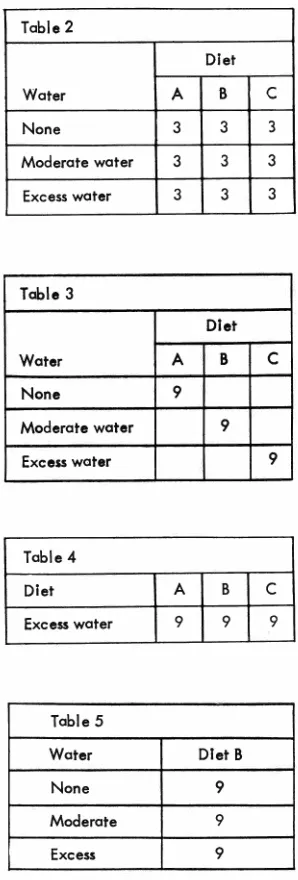
In a hypothetical experiment to
determine the effect of different
diets, A, B, C, and the amount of water drunk on weight changes in
rats, two different experimental
strategies might be as follows in
tables 2 and 3, where the numbers
indicate the number of animals
al-located to different treatment
mo-dalities of diet and water. A typical
reaction is that the research worker would not do the experiment this way. He might use the single-factor
design shown in table 4 to find which diet (say B) has the greatest effect on weight when there is no
limitation on water and then repeat
as follows in table 5. The above procedure implies that he is in-terested in the combination of diet and water which most increases body weight. If this is so, then the
"one factor at a time" approach is
inefficient, (more animals, more
time) and may even be misleading
because of interaction (Diet C with
moderate water may give best
re-sults). Many efficient experimental
designs are now available for use in
medical research.
Recently, Box (1954) and others
have developed designs for
indus-trial multifactorial experiments with the objective of estimating that combination of treatment levels
which maximises the response.
There is every reason to believe
that factorial and response surface designs could be usefully applied
in bio-medical research.
References
BLAIR, D.
w.,
M. J. WILLIAMS, A. L CARR, ANDs
.
J. KILPATRICK. Effectof L-thyroxine on gastric secretion
in the pylorus-ligated rat. Gut 6:
343-348, 1965.
Box, G. E. P. The exploration and
exploitation of response surfaces: some general considerations and ex-amples. Biometrics 10: 16-60, 1954 ..
COCHRAN, W. G. The planning of
ob-servational studies of human
popu-lation. J. Roy. Stat. Soc. Ser. A
128: 234--255, 1965.
CROOKS, J., I. P. C. MURRAY, AND·
E. J. WAYNE. Statistical methods.
applied to the clinical diagnosis of
thyrotoxicosis. Quart. J. Med. 28: 211-234, 1959.
DIEM, KONRAD (ed.). Documenta·
Geigy. Scientific Tables. New York:
Geigy Pharmaceuticals, 1962, 77S:
pp.
GRUENWALD, P., AND H. N. MINH. Evaluations of body and organ weights in the perinatal pathology .. II. Weights of body and placenta
of surviving and autopsied infants_
Am. J. Obstet. Gynecol. 82:
312-319, 1961.
KILPATRICK, S. J. Mortality compa
ri-sons in socio-economic groups ..
Appl. Stat. 12: 65-86, 1963.
MAINLAND, D. Elementary Medical