Vol.8 (2018) No. 3
ISSN: 2088-5334
Study of Convective Cloud Lifetime and Movement Using Radar
Image and ECMWF Model
Mochammad Donny Anggoro
#, Bagus Pramujo
* #Department of Meteorology, State College of Meteorology Climatology and Geophysics, South Tangerang, 15221, Indonesia E-mail: [email protected]
* Marine Meteorology Division, Indonesian Agency for Meteorology Climatology and Geophysics, Jakarta, 10610, Indonesia E-mail: [email protected]
Abstract— Clouds as actors in the atmospheric dynamics, it is important to learn especially the convective cloud. Utilization of
numerical weather models is expected to interpret weather conditions, particularly to identify lifetime and convective cloud movements with ECMWF Model. Radar data is used to show the characteristic of convective clouds that producing hail and heavy rain with digitization method and life history method. Maximum VIL value of hail case studies in Bogor is 45 kg/m2; maximum reflectivity is 65 dBz reaches a height of 9 km at 08.12 UTC. Three Body Scatter Spike (TBSS) appear as a mark will occur hail process. The growth of convective clouds that producing hail on July 5 2016, in Bogor, occurred for 140 minutes. The cumulus stage takes 33 minutes, the mature stage takes 80 minutes, and the dissipation stage takes 27 minutes. The convective clouds move from southeast-south is caused by regional factors, with speed of 12-18 knots. Relative Humidity (RH) 85-90% is present in layers 840 mbar to 810 mbar. Maximum VIL value of heavy rain case studies is 5 kg/m2, and maximum reflectivity is 58 dBz. The growth of convective clouds that producing heavy rain on February 16 2016 occurred for 220 minutes. The cumulus stage takes 30 minutes, the mature stage takes 150 minutes, and the dissipation stage takes 40 minutes. The convective clouds move from the northwest is caused by regional factors, with speed of 5-10 knots. Relative Humidity (RH) is more than 95% is present in layers 400 mbar to 200 mbar.
Keywords— hail; lifetime; movement; digitization.
I. INTRODUCTION
Information on the time and place of extreme weather events was disseminated to the community to design a weather warning system. Clouds as actors in the atmospheric dynamics, it is vital to learn especially the convective cloud. Cloud patterns visible from space fluctuate due to the formation, decay, and movement due to air acting as fluids [1]. Weather is also a global issue that needs to be addressed as it affects the global disaster potential [2].
Indonesia as a maritime continent in the tropics becomes a formidable challenge for a forecaster. Although Indonesia has only 2 seasons, the precision of weather forecasts is still difficult. Various local factors are the cause. Difficulties in forecasting weather can be minimized if weather assessments are well followed [3]. Extreme weather has an impact on human activities. Heavy rain, heavy rain with high wind, and hail are the example of extreme weather. Their characteristic is unique to be described, especially lifetime and movement. The lifetime of convective cloud in Jakarta was 120 minutes in a rainy season, and 220 minutes in transition season [4]. One attempt to design the system is to
examine the lifetime and convective cloud movement. The convective cloud lifecycle period is related to the length of the time span of the event, while convective cloud movements are related to the dissemination of early warning information to the areas to be traversed. Convection conditions of the atmosphere can form convective clouds [5]. Natural disasters can occur if the extreme weather causes damage and losses, so that weather warnings are essential in mitigation efforts [2].
the conditions as well the structure of the storm cloud [7]. Doppler radar type C-band scattered in several places in meteorological offices throughout Indonesia has a weakness in observing clouds. The wavelength emitted for detection is 4-8 cm. Small cloud particles (such as cumulus humilis) are generally about 5-10 μm in diameter. This type of cloud is too small to be detected by radar with centimeter wavelength (cm) [8].
Fig. 1 Process in taking effect for cloud lifetime
Utilization of numerical weather models is expected to interpret weather conditions, in particular, to identify lifetime and convective cloud movements. The Interim Era Europian Center for Medium Range Weather Forecasting (ECMWF) was developed to simulate the process of atmospheric dynamics. The ECMWF model is the result of the development of over 100 years of dynamic and synoptic meteorological studies and over 50 years of Numerical Weather Prediction (NWP) study progress [8]. The complex processes in the atmosphere are reviewed in the model depicted on a grid.
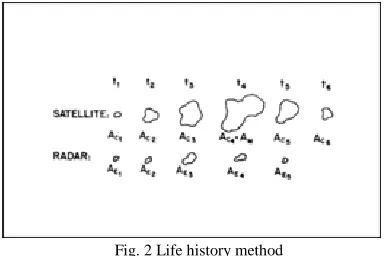
This study uses life history methods to investigate the forming phase of the convective cloud. Reference [9] describes the method of life history has been widely used for convective conditions, by displaying images with time step. This method also considers changes are occurring in the formation of convective clouds individually or in clusters [10]. Based on this background, research on the lifetime and convective cloud movement need to be developed to aid the forsakers in improving the quality and accuracy of weather forecasts.
Fig. 2 Life history method
Reference [11] revealed that the value of reflectivity in active convective phase is greater than or equal to 38 dBz. Many researchers stated characteristic of hail. Reference [12] stated that the radar hail was marked by the presence of
Three-Body Scatter Spike (TBSS) with a reflectivity value of ≤ 20 dBZ that have the same pattern with maximum
reflectivity’s cell at an altitude of 10-30 km. The value of
VIL as an indicator for the occurrence of hail is 43 kg/m2 [13]. Indicators of occurrence of hail with a maximum reflectivity value of > 45 dBz with a height of > 6.5 km [14].
II. MATERIAL AND METHOD
The research was conducted by radar data processing and ECMWF model, to describe the characteristic of hail. One of the radar products, CMAX, was digitized with map processing software to get the desired cloud boundary and the convective cloud cell's core position. The position of the cell’s core is observed in determining the movement of the cloud. The cell’s core is the object with the highest reflectivity.
The radar data used is from raw weather data radar format ".vol." Tangerang weather radar is located at coordinates 6.1669 °S and 106.6502 °E. The operational method of it at the time of the study used the Volume Coverage Pattern (VCP) 21 which has 11 elevations, from 0.50 to 19.50. Pulse Repetition Frequency (PRF) is used the value varies from 600-800 Hz and the range of data to be used is at a radius of 3-150 km.
Fig. 3 Location area
Column Maximum (CMAX) product, Rainhistograph product, and Severe Weather Warning Index based on Volume Integrated Liquid (VIL) are used from cumulus stage to dissipation stage times. Those product has configured based on each set. CMAX product gets the max reflectivity in each scanning. Rainhistograph converts the reflectivity value from CMAX product with a Marshall-Palmer algorithm. VIL product shows the column with much water vapor, so we could indicate how heavy the convective cloud is. CMAX product will be a material of digitization method, from the lower layer is set in 0.3 km and the upper layer is set in 30 km. Rainhistograph is set along 24 hours.
Parameters analyzed were streamline and relative humidity. ECMWF model extracts data once every 6 hours (00 UTC, 06 UTC, 12 UTC, and 18 UTC), so in this study used before and after the event.
Life history method works with image and time step. The mapping software begins with the georeferencing stage, which defines several points of the image (digital data) with known location coordinates. Researchers used four square-shaped points. The first point is parallel to the center of the radar and longitude parallel to the point Bekasi. The second point is the coordinates of the Tangerang radar center (106.6502 E, -6.1502 S). The third and fourth dots are done randomly but remain rectangular. The researcher delineates the boundary of the outer parts of convective clouds with each reflectivity value. After finishing, the delineation used “Dissolve” to make the picture and coloring smooth. Determining the location of the cell core using points and determining the movement of clouds using polyline.
III.RESULT AND DISCUSSION
Digitization method utilizes many pictures for telling convective cloud growth channels. However, researcher observes the different of reflectivity to separate stage of convective cloud growth. If the picture shows the reflectivity above 38 dBz, it will conclude to classify mature stage, based on [3].
A. Hail case in Bogor, July 5 2016
Fig. 4 Cross Section (VCUT) from VIL product
In Figure 4, a convective cloud cross section is performed starting from the center of the radar. The characteristic of hail in Bogor is suitable with [5] in the presence of a maximum VIL value of 45 kg / m2. The maximum reflectivity of 65 dBz reaches a height of 9 km at 08.12 UTC.
This case also qualifies from [4] in the presence of TBSS at an altitude of more than 10 km at 08.12 UTC.
Digitization method is used to interpret convective cloud growth, starts from cumulus stage, mature stage, and dissipation stage. It is shown in Figure 3, using a scale of 1: 100.000. The cumulus phase is identified from 06.59 UTC to 07.32 UTC. It shows scattered convective cells starting to be organized toward a 38 dBz reflectivity value. By [3], the value of reflectivity in active convective phase is greater than or equal to 38 dBz.
Fig. 5 Cumulus stage of convective cloud (The red circle shows the cell who produce hail)
In mature stage, digitization is performed using a scale of 1: 50,000. The mature stage is identified starting at 07.32 UTC until 08.52 UTC. This time is chosen because the cloud form is starting in stable condition and the size of the constant cloud-producing cloud system. The reflectivity value starts from 38 dB to 65 dBz at its core.
Fig. 6 Mature stage of convective cloud (The black circle shows the cell who produce hail)
Fig. 7 Dissipation stage of convective cloud (The black circle shows the cell who produce hail)
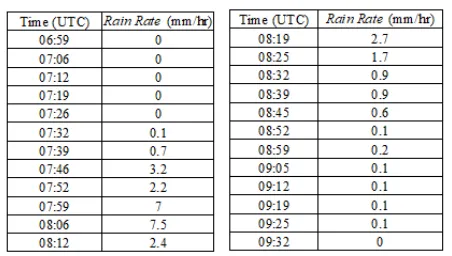
The rain occurred starting at 07.32 UTC with the peak of heavy rain occurred at 08:06 UTC. Right after heavy rains experienced a decrease in intensity, at 08.12 UTC followed by hail events. This condition indicates that starting at 07:32 UTC convective clouds begin to enter the mature stage where the rain begins to occur.
TABLEI
RAINFALL INTENSITY FROM RAINHISTOGRAPH PRODUCT
The growth of hail convective cloud on July 5, 2016, in Bogor occurred for 140 minutes. The cumulus stage takes 33 minutes, the mature stage takes 79 minutes, and the dissipation stage takes 34 minutes.
According to Table II, convective cells are dominated by a zonal westward move and move northward. The movement of the cell is illustrated in 2-dimensional form, where time is on the X-axis, the longitude on the Y-axis. It proves that Bogor occurred hail on 08.12 UTC with the mature stage of a convective cloud.
ECMWF model was observed in next step, as streamline (wind map) and relative humidity. Streamline was focus on what things the weather had the disturbance. The researcher has chosen 850 mbar as a low level because there is no friction that we could say as geostrophic wind. 500 mbar as steering level, become middle level to indicate how the disturbance maintained in a vertical side. 200 mbar was chosen as upper level, with much high-speed wind. If in 200 mbar disturbance was still detected, we could analyze that it
had high power from below to above. Relative humidity shows us how much water vapor in one column.
TABLEII
MOVEMENT COORDINATES OF CELLS
Fig. 8 Convective cell movement
Fig. 9 850 mbar wind streamline
Fig. 10 500 mbar wind streamline
Fig. 11 200 mbar wind streamline
At 12.00 UTC, a layer of 850 mbar in Bogor area, there is a divergence area that indicates the spread of wind. The contribution of the wind bends causes wind speed to decrease. The wind is blowing from the East-Southeast direction at a speed of no more than 5 knots. There is a neutral area in 500 mbar layer that covers the Bogor region so that the air mass becomes compressed. 200 mbar layer shows that wind was blowing at low speed so that Bogor have an excellent potential for convective cloud growth.
Fig. 12 850 mbar wind streamline
Fig. 13 500 mbar wind streamline
Fig. 14 200 mbar wind streamline
The wind blows from the North-Northeast at a rate not exceeding 5 knots. Layer 200 mbar there Anticyclonic pattern in the waters of the southern part of West Java which extends to cover the area of Bogor. This pattern indicates the spread of the wind (divergence). The wind blows from North-Northeast at speeds not exceeding 5 knots. It illustrated that upper level has low-speed wind.
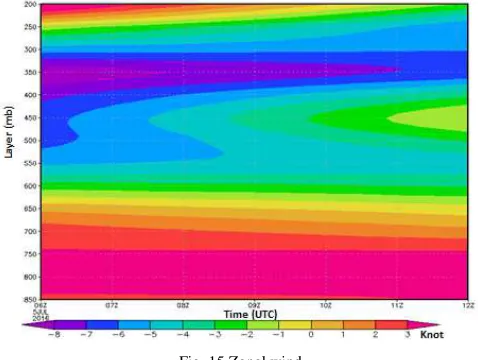
Zonal winds illustrate that the north wind dominates in each layer. 650-600 mbar layers at 06.00 UTC to 08.00 UTC had very high winds with wind speed 7 knots. The occurrence of hail is around 08.12 UTC; this condition supports for the occurrence of hail.
Fig. 16 Meridional wind
Meridional winds describe winds in layers of 850 mbar to 650 mbar dominated by winds from the north. The wind from the south dominates wind layer 650 mbar to 250 mbar.
Fig. 17 Relative Humidity
Figure 17 shows a reasonably wet bottom layer of air at approximately 08.12 UTC at the time of hailstones in Bogor. RH 85-90% is present in layers 840 mbar to 810 mbar. This condition supports cloud growth. That means ice form was active in low level when it saturated and heavy they will fall.
B. Heavy rain case in Kemayoran Meteorological Station, February 16 2016
Based on Figure 18, VIL value for heavy rain is small (5 kg/m2). At 15.20 UTC was chosen because the peak of rain occurred. Rainfall intensity at Kemayoran Meteorological Station was 54.1 mm, at Soekarno-Hatta Cengkareng Meteorological Station was 14.9 mm, and at Tanjung Priok, Meteorological Station was 15.5 mm.
Fig. 18 SWWI product at 15.20 UTC
Fig. 19 Cumulus stage of convective cloud (The black circle shows the cell who produce heavy rain)
Digitization method is used to interpret convective cloud growth, starts from cumulus stage, mature stage, and dissipation stage. It is shown in Figure 19, using a scale of 1: 100.000. The cumulus phase is identified from 13.10 UTC to 13.40 UTC. It shows scattered convective cells starting to be organized toward a 38 dBz reflectivity value. By Gamache and Houze (1981), the value of reflectivity in active convective phase is greater than or equal to 38 dBz.
In mature stage, digitization is performed using a scale of 1: 50,000. The mature stage is identified starting at 13.40 UTC until 16.10 UTC. This time is chosen because the cloud form is starting in stable condition and the size of the constant cloud-producing cloud system. At 13.40 UTC cloud’s cell have long distance in each cell. After that time, clouds move closer and merge with each other. The reflectivity value starts from 38 dBz to 65 dBz at its core.
Fig. 21 Mature stage of convective cloud in second step (The black circle shows the cell who produce heavy rain)
Fig. 22 Dissipation stage of convective cloud
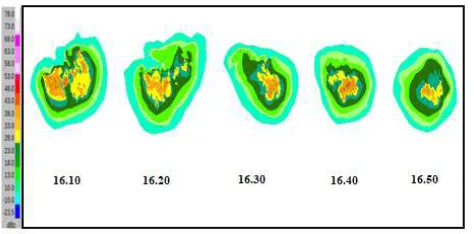
In dissipation stage, digitization is performed using a scale of 1: 50,000. The dissipation phase is illustrated when the maximum reflectivity decreases and exceeds the limit of 38 dBz, from 16.10 UTC to 16.50 UTC. The size of the cell is small and the convective system is disconnected to adjacent convective cells that are mature. Maximum reflectivity decreased from 38 dBz at 16.10 UTC to 33 dBz
at 16.50 UTC, and eventually extinct marked by loss of cell presence in radar imagery.
The rain occurred starting at 14.50 UTC with the peak of heavy rain occurred at 15.30 UTC. This condition indicates that starting at 13.40 UTC convective clouds begin to enter the mature stage where the rain begins to occur at 14.50 UTC.
TABLEIII
RAINFALL INTENSITY FROM RAINHISTOGRAPH PRODUCT
The growth of heavy rain convective clouds on February 16, 2016 occurred for 220 minutes. The cumulus stage takes 30 minutes, the mature stage takes 150 minutes, and the dissipation stage takes 40 minutes.
TABLEIV
RAINFALL INTENSITY FROM RAINHISTOGRAPH PRODUCT
According to Table IV, convective cells are dominated by a zonal eastward move and move southward. The movement of the cell is illustrated in 2-dimensional form, where time is on the X-axis, the longitude on the Y-axis. Convective cloud moves dominantly to East until Southeast. It starts from the ocean and ends to Southwest from Jakarta. Figure 23 showed the convective cloud movement when heavy rain occurred in Kemayoran Meteorological Station on Feb 16, 2016. The green triangle means cloud merger or separations.
Time (UTC) Rain Rate (mm/hr)
14:30 0 14:40 0 14:50 0.1 15:00 0.1 15:10 0.1 15:20 3.2 15:30 4.5 15:40 0.1 15:50 0.3 16:00 0.1 16:10 0.3 16:20 0.1 16:30 0 16:40 0 16:50 0
Time (UTC) Longitude (E) Latitude (S)
13:10 106.5193 -5.96969
13:20 106.53212 -5.80386
13:30 106.5097 -5.92122
13:40 106.52276 -5.94202
13:50 106.56778 -6.04681
14:00 106.59614 -6.04985
14:10 106.63134 -6.06581
14:20 106.63514 -6.08318
14:30 106.78027 -6.08964
14:40 106.76178 -6.10756
14:50 106.75017 -6.13048
15:00 106.78295 -6.1496
Time (UTC) Longitude (E) Latitude (S)
15:10 106.83281 -6.1597
15:20 106.80346 -6.18442
15:30 106.69108 -6.18845
15:40 106.7046 -6.22728
15:50 106.69889 -6.26556
16:00 106.69984 -6.28481
16:10 106.73943 -6.23954
16:20 106.74457 -6.25532
16:30 106.74597 -6.29779
16:40 106.74816 -6.30986
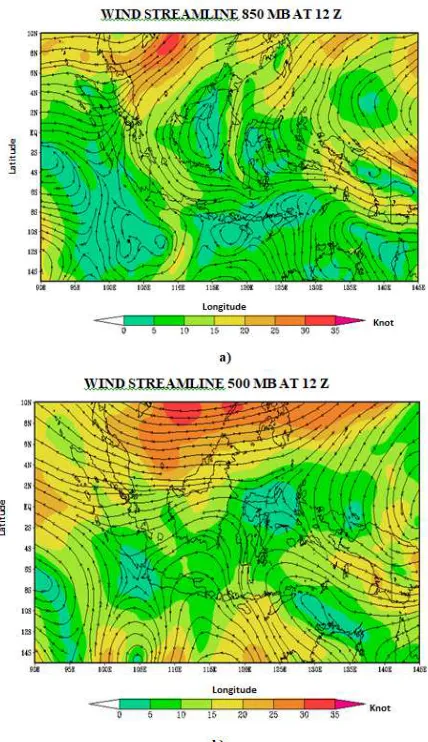
ECMWF model was observed in next step, as streamline (wind map) and relative humidity. At 12.00 UTC, winds in the 850 mbar layer blew from the Northwest at 5-10 knots.
Fig. 23 Convective cloud movement
There is no weather disturbance in this layer. The 500 mbar layer of wind blows from the North-West at a speed of fewer than 5 knots. Weather disturbances in the form of wind and convergence, because of its location adjacent to neutral areas. 200 mbar layer of wind blowing from East-East East-East at 10-15 knots. The weather disturbances that occur in the form of divergence, marked by the spread of wind direction.
Fig. 24 a) 850 mbar wind streamline; b) 500 mbar wind streamline; c) 200 mbar wind streamline
At 18.00 UTC, a layer of 850 mbar winds blowing from the Northwest at a speed of fewer than 5-10 knots. There is no weather disturbance in this layer. The 500 mbar layer of wind blows from North-Northeast at a speed of 5-10 knots. There is no weather disturbance on this layer. The 200 mbar layer of wind blows from the Northeast with a wind speed of 5-10 knots. There is no weather disturbance in this layer.
Fig. 25 850 mbar wind streamline
Fig. 27 200 mbar wind streamline
Figure 28 illustrates about humidity from 13:10 UTC to 16.50 UTC is relatively wetter in the top layer than the bottom layer. The vertical is generally wet, where the bottom layer is 75% - 90% and RH> 100% in the 300-250 mb layer.
Fig. 28 Relative humidity
Fig. 29 Zonal wind
Figure 29 shows the prevailing underlying zonal winds moving from West to East and vice versa on the top layer of layers 570 mbar to 200 mbar. Zonal winds, in this case, are dominantly influenced by local factors, characterized by dominant curved color lines.
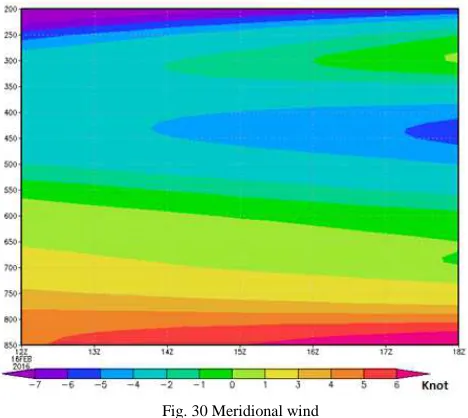
Figure 3,0 shows a meridional wind for 6 hours moving from North to South (wind spe ofed is marked negative). When vectors are made from zonal and meridional winds, the resultant wind moves from the Northwest. The case occurred in February, in which regional monsoon booms in Asia. This indicates that the dominant influence of wind is a regional factor.
Fig. 30 Meridional wind
IV.CONCLUSIONS
Hail has interesting characteristics that researcher had approved, especially hail case in Bogor July 5, 2016. It was detected with Three Body Scatter Spite (TBSS) at an altitude more than 10 km at 08.12 UTC. Maximum VIL value of hail case studies in Bogor is 45 kg/m2; maximum reflectivity is 65 dBz reaches a height of 9 km at the same time with TBSS detected. Hail is unique; maximum reflectivity went down faster while we see VCUT tools of VIL product. It fell rapidly at 08.19 UTC and 08.25 UTC.
ECMWF Model shows that event before hail occurred, there was weather disturbance detected, like convergence zone of wind in low level, Eddy circulation in the southwest from Bogor, and divergence zone. That means mass air had accumulated from a low level, an upper level the mass air condense too because of Eddy circulation. Zonal wind and meridional wind were proved that mesoscale factor (local factor) dominated, as color and line had curve pattern.
Eddy circulation in the southwest from Bogor, and divergence zone. That means mass air had accumulated from a low level, an upper level the mass air condense too. Zonal wind and meridional wind were proved that mesoscale factor (local factor) dominated, as color and line had curve pattern. The growth of heavy rain convective clouds on February 16, 2016, occurred for 220 minutes. The cumulus stage takes 30 minutes, the mature stage takes 150 minutes, and the dissipation stage takes 40 minutes. Hail and heavy rain have a unique characteristic. Heavy rain has a lifetime longer than the lifetime of hail. A convective cloud of hail usually moves to south-westward or north-westward, while a convective cloud of heavy rain moves to south-eastward. The same condition of both cases, weather disturbance, exist convergence zone at the middle level and divergence zone at the upper level.
ACKNOWLEDGMENT
We would like to thank Soekarno-Hatta Cengkareng Meteorological Station for permits to use Radar Tangerang data. Our senior provided opinion and suggestion of this draft. We also thank for all help the researchers complete it on time.
REFERENCES
[1] R. Houze, “Cloud Dynamics (Second Edition),” Academic Press, 2014.
[2] J. Leyda and D. Negra, “Extreme Weather and Global Media,” Routledge, New York, 2015.
[3] R.W. Katz and A.H. Murphy, “Economic Value of Weather and Climate Forecasts,” Cambridge University Press, New York, 2005. [4] H. Sulistami, “Identification of Convective Cloud Using Weather
Radar Data in Jakarta and Surrounding, STMKG, Jakarta, 2016. [5] B. Tjasyono, “Meteorologi Indonesia 2 (Awan & Hujan Monsun)”,
BMKG, Jakarta, 2006.
[6] R. Schowengerdt, “Remote Sensing: Models and Methods for Image Processing,” Academic Press, 2006.
[7] E. Wardoyo, “Radar Meteorologi”, BMKG, Jakarta, 2015.
[8] A. Persson and F. Grazzini, “User Guide to ECMWF Forecast Products, ECMWF, United Kingdom, 2007.
[9] C.G. Griffith, W.E. Woodley, and P.G. Grube, “Rain estimation from geosynchronous satellite imagery-Visible and Infrared Study,” Mon, Weath, p.106., 1978.
[10] R. Nagarajan, “Drought Assessment,” Springer Science & Business Media, 2010.
[11] J.F. Gamache and R.A. Houze, “Mesoscale Air Motions Associated with a Tropical Squall Line,” Department of Atmospheric Sciences, University of Washington, Seattle, 1981.
[12] J.W. Wilson, and D. Reum, “The flare echo: Reflectivity and velocity signature.” J. Atmos. Oceanic Technol., p.197-205., 1988.
[13] S.A. Amburn, and P.L. Wolf, “VIL density as a hail indicator,” Weather Forecasting, p.473-478., 1997.