Vol.6 (2016) No. 5
ISSN: 2088-5334
Intelligent Prediction of Soccer Technical Skill on Youth Soccer
Player’s Relative Performance Using Multivariate Analysis and
Artificial Neural Network Techniques
M. R. Abdullah
#1, A. B. H. M. Maliki
#2, R. M. Musa
#3, N. A. Kosni
#4, H. Juahir
* #Faculty of Applied Social Sciences, Universiti Sultan Zainal Abidin, 21300 Terengganu, Malaysia
E-mail: [email protected], [email protected], [email protected], [email protected],
*East Coast Environmental Research Institute, Universiti Sultan Zainal Abidin, 21300 Terengganu, Malaysia E-mail: [email protected]
Abstract— This study aims to predict the potential pattern of soccer technical skill on Malaysia youth soccer players relative
performance using multivariate analysis and artificial neural network techniques. 184 male youth soccer players were recruited in Malaysia soccer academy (average age = 15.2±2.0) underwent to, physical fitness test, anthropometric, maturity, motivation and the level of skill related soccer. Unsupervised pattern recognition of principal component analysis (PCA) was used to identify the most significant parameters in soccer for the current study and intelligent prediction of artificial neural network (ANN) was developed to determine its predictive ability for the soccer relative performance index (SRPI). The PCA has indicated sit up, agility, 5m speed, 10m speed, 20m speed, weight, height, sitting height, bicep, tricep, subscapular, suprailiac, calf circumference, maturity, task, ego, short pass, shooting right top corner and shooting left top corner are the most significant parameters in soccer. Meanwhile, the PCA-ANN showed better predictive ability in the determination of SRPI with fewer parameters such as R2 and root mean square error (RMSE) values of 0.922 and 0.190, respectively. The current study indicated that only a few parameters are needed to improve and enhanced the performance of novice group. Nevertheless, the prediction method techniques for the present study show very high and strong ability in prediction of the player’s performance. It has highlighted the possibility of defining the optimum number of parameters for the player's relative performance evaluation, which in turn will reduce the costs, energy and time of the measurement.
Keywords— artificial neural network; pattern recognition; principal component analysis; soccer
I. INTRODUCTION
Soccer is the most popular game in the world and is performed by male and female, children and adults at all different levels of participation. Soccer performance depends on upon a multilateral elements such as technical, tactical, physiological and psychological components. Soccer is an intermittent nature with action changes each 3-5 s and are physically demanding because of multiple brief, intense actions involving jumps, turns, tackles, high speed runs and sprints [1]. Numerous studies have been conducted to develop a model based on the most significant variables in specific sport that can enhance the effect of the training [2]-[4] or to distinguish between players of different level of participation [5]. With no exception especially for soccer, this approach is needed for the middle country to upkeep the performance to be more competitive when participating in the competition.
It is likely when these models are used to predict soccer player’s talent abilities, essential consideration is necessary such as the most significant variables that related to the soccer. Hence, confirmation in prior of the model via multivariate analysis will project the subjective categorical performance and cross validation of classification on predictors will enhance the capabilities of the model itself. These predictive models are often used to rank player at a given point of significant variables (multilaterally) to recognize the talented players [7]. To date, the usefulness of mathematical analysis in sports especially applying nonlinear relations of variable data can be simultaneously analyzed. For example, numerous studies applying multivariable regression, multivariate techniques and procedures in sports whenever deal with many predictors [7], [8].
Furthermore, the accuracy of the equation of sports performance specification primarily depends on the whole methodology of the research, which will lead the results will be of differentiating quality based on the different approaches to a solid research [8]. However, validation of the prediction model of top level athlete’s relative performance can be confirmed by applying multilateral factors with repeated observations [9]. The basic problem of previous research of the defining components of an athlete’s performance is apparent in the insufficient coherence of obtainable data (operationally) in order to unquestionably conclude what the prediction model of an athlete and/or team relative performance comprises of. Similarly, prediction model might be useful to determine individual performance by improving the individual’s training system and the selection of elite athletes [10]. Still, there is a lack of information which components are significantly contributing to the over athletic performance as the relative ability (e.g. training’s performance or relative performance in soccer) that can predict the talent of players in the future and also lack of information in the Asian nation because of different operational measurement applied. These will result the coaches could have better accuracy in determining whether an athlete needs an improvement or enhancing on the training program in order to optimize performance. Therefore, this study aimed to predict the potential pattern of soccer technical skill on soccer youth players relative performance using principal component analysis and artificial neural network techniques.
II. MATERIALS AND METHODS
A purposive sampling technique applied to the current research, which is including all the athletes across all soccer academies in Malaysia. Exclusion criteria selection to participate applied when there is an injured, participate in other local and national competition. From the inclusion and exclusion of selection of the sample, overall 184 youth soccer players (mean age = 15.2 ± 1.6 years) were enrolled to participate in this study drawn from eight Malaysian state youth soccer academy. All study protocols, procedure, material and instrument of the research were approved by the university Human Research Ethics Committee. All the players were permitted to withdraw from partaking on this research at any time without any fear of consequences. The coaches, the managers of the academies were informed
about the purpose of the research as well as the parents or the guidance of the players. Writing approval was obtained and all the players signed consent forms. This current study, potential pattern of soccer technical skill was operationally defined as a fundamental technical skill in soccer (long pass, short pass, ball control and shooting). Similarly, soccer relative performance can be defined as anthropometric components (age, weight, height, sitting height, body fat skinfold, girth and maturity), physical fitness components (sit and reach, sargent jump, sit up, agility, speed at various distances and predicted VO2max) and psychological
components (ego and task orientation).
Standard anthropometric testing was conducted which constitutes of chronological age, weight, height, sitting height, body fat %, girth and maturity. Standing height was measured with a wall-mounted wooden stadiometer to the nearest 0.5 cm. Body weight was assessed with a standardized electronic digital scale to the nearest 0.01 kg. Sitting height was tested from the vertex of the head to the seated buttocks and was noted to the nearest 0.5 cm [11].
Skinfold calipers were used to record the triceps, biceps, subscapular and suprailiac to the nearest 0.1 mm whereas the medial upper arm circumference (muac) and calf circumference (cc) were measured via non-stretched measuring tape. All the measurements were implemented by following ISAK protocol [12]. The measurements were obtained twice and the mean value was generated as the final score. Meanwhile, sexual maturity stage of pubic hair based on the criteria of tanner was used as an indicator of sexual maturity status [13], [14].
Muscular strength test was executed accordingly to the recommended method for physical fitness tests [15]. Players lay on their back with their knees bowed at around right edges, while both feet were situated level on the floor. The player’s held their hands against their chest, where they should stay throughout the test. In the test procedure, a supporter held the players’ feet put on the ground. Players sat up until they touched their knees to both elbows, then they came back to the floor. The routine was frequented as many times as possible under the period for 60 s. The aide totaled and recorded the quantity of right completed sit-ups. The test was measured just once attributed to the impact of exhaustion.
The multistage 20-m shuttle run test was implemented to acquire the player’s maximal oxygen uptake [16]. Every athlete kept running for whatever length of time they could afford until could no more keep pace with the velocity of the tape. Test results for every player were expressed as an anticipated VO2max accomplished by checking the last level
and ended shuttle number at the time when the players voluntarily resigned from the test. In spite of the fact that the motivation and drills of the players might influence their scores, it is still a legitimate test in assessing maximum oxygen uptake and can be performed with a considerable large number of players minimizing expenses and time.
the lead researcher. The players were told to retain running at maximal velocity throughout the full length of time of the sprint test. The players were told to keep up the maximal pace until passing the marker on which the mentor stood. The execution times were recorded at situated at 5, 10 and 20 m respectively. Players performed two repetitions with the fastest times utilized for statistical analysis. At least, 4 min of restoration were given between repetitions.
A Vertec testing gadget (M-F Athletic Co., Cranston, Rhode Island) was utilized to decide vertical jump height (cm), a legitimate and solid measure of leg explosive power [18]. To surface this test, a prepared tester attuned the height of the color-coded plastic vanes such that it paralleled to the athlete's standing reach height. The vane stack was then raised a standardized distance so the players would not jump higher or lower than the arrangement of the vanes. Utilizing a countermovement, the players flexed the ankles, knees, and hips and swung the arms in an upward movement tapping the highest conceivable vane with the fingers of the dominant hand. Every player performed three jumps with 40-60 seconds rest between every jump. The best of two trials was recorded and utilized for statistical analysis.
The flexibility of the lower back and hamstrings was measured by the sit and reach test [19]. The players performed two trials, and the best one was recorded for further analysis.
Agility was evaluated using the 505 agility test. The protocol was conducted as previously described [20]. Pointers are set up 5 and 15 meters from a line marked on the ground. The players run from the 15 m marker near the line (run in distance to form up speed) and via the 5 m markers, turns on the line and runs back over the 5 m markers. The time is documented using infrared speed trap (brower timing system), from when the players first run through the 5 m marker and stopped when they return through these markers. Each player performed two maximal attempts and the fastest time was recorded for further analysis. The players should be encouraged not to overstep the line by too much as this will increase their time.
Technical skills tests such as ball control, short pass and long pass were administered to the players. The basic skills were selected and implemented according to the guidelines provided by (F-MARC battery test), which are developed by previous researcher [21]. This test allows assessment of coordinated dribbling under time pressure and evaluation of speed. Short pass test allows assessment of accuracy and coordination in passing a moving ball. The long pass test allows assessment of passing accuracy and shooting power over a long distance. Shooting (dead ball) test allows assessment of accuracy and coordination in shooting from a dead ball, and shooting from a pass (foot) test allows assessment of accuracy and coordination in shooting from a ground pass.
Furthermore, the questionnaire for achievement in mastery and performance (TEOSQ) was used to ascertain the degree of the player's mastery and performance [22].
Finally, all data of 184 were measured and presented as mean ± SD values. Before main statistical analysis, the total of missing data and data error were checked and it was very small (∼3 %) compared to the overall data and the nearest neighbor method was applied in order to facilitate the data
analysis [23]. Normality of data distribution as well as outlier were also checked using Kolmogorov-Smirnov and box-plot method [23].
In this current research, it is involving three main statistical analysis which is Principal component analysis (PCA), Hierarchical Agglomerative cluster analysis (HACA) and Artificial Neural Network (ANN) to facilitate the analysis of the model. The first phase of analysis was run using PCA to determine the most significant variables that related to the nature of the soccer game. By using this analysis, it helps to trim down a massive data set which is considered as one of the most prevalent and useful statistical methods for uncovering the latent structure of a set of variables with a minimal loss of original data [24], [25]. Likewise, based on the output from the PCA, specific soccer components related to technical skill performance identified as an input for HACA [26]. HACA was employed to investigate the grouping of the technical skill based on the recommendation of prior study, which is relevant to the related of performance in soccer. HACA is a common method to classify [27] variables or cases (observations/samples) into clusters with high homogeneity level within the class and high heterogeneity level between classes with respect to a predetermined selection criterion [28]. Later on the final phase, output from the PCA treat as an input in ANN. The objective of creating an ANN is to scrutinize the ability of using an output variable parameters from PCA to build supervised classifiers to discriminate between the two different skill levels (expert and novice).
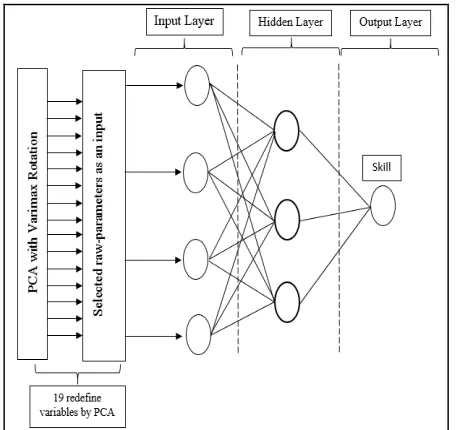
In this current research, the back propagation neural network (BPNN) model was applied based on the recommendation of previous research [29]. The network architecture of the BPNN consists of three layers namely the input layer, the hidden layer and the output layer [23]. Meanwhile, the output layer is the two different skill levels (expert and novice). The hidden layer in this current study characterizes the interconnection among the input nodes, which use a non-linear transformation function that is a sigmoid function [30]. The quantity of nodes in the hidden layer was various via a trial and error technique until the optimal number was completed in order to estimate any non-linear function with any level of precision, and it was used to examine for the best model for the performance distribution prediction. The performance of the ANN is determined by the correlation of determination (R2), the root mean square error (RMSE) and the misclassification rate (MR). The application of PCA and HACA was performed using XLSTAT 2016, meanwhile an ANN was performed using JMP10 software respectively.
III.RESULTS AND DISCUSSION
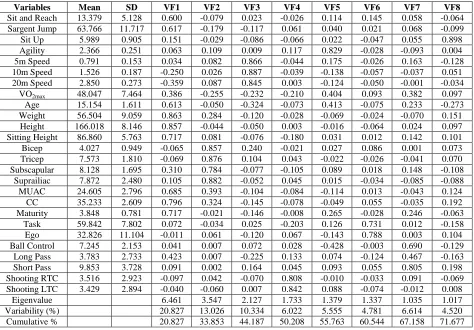
highlighted the factor loading after varimax rotation method in the PCA. Furthermore, the standardized VFs with absolute values equal or greater than 0.70 as the selection edge considered as solid and stable, specifies moderate to strong
loadings on the extracted factors in the current study. However, it can be seen from the Table I out of twenty six parameters, only nineteen parameters were identified as the most significant across all variables.
TABLEI
PARTICIPANT CHARACTERISTICS (N=184) AND FACTOR LOADING AFTER VARIMAX ROTATION
Variables Mean SD VF1 VF2 VF3 VF4 VF5 VF6 VF7 VF8
Sit and Reach 13.379 5.128 0.600 -0.079 0.023 -0.026 0.114 0.145 0.058 -0.064 Sargent Jump 63.766 11.717 0.617 -0.179 -0.117 0.061 0.040 0.021 0.068 -0.099 Sit Up 5.989 0.905 0.151 -0.029 -0.086 -0.066 0.022 -0.047 0.055 0.898 Agility 2.366 0.251 0.063 0.109 0.009 0.117 0.829 -0.028 -0.093 0.004 5m Speed 0.791 0.153 0.034 0.082 0.866 -0.044 0.175 -0.026 0.163 -0.128 10m Speed 1.526 0.187 -0.250 0.026 0.887 -0.039 -0.138 -0.057 -0.037 0.051 20m Speed 2.850 0.273 -0.359 0.087 0.845 0.003 -0.124 -0.050 -0.001 -0.034 VO2max 48.047 7.464 0.386 -0.255 -0.232 -0.210 0.404 0.093 0.382 0.097
Age 15.154 1.611 0.613 -0.050 -0.324 -0.073 0.413 -0.075 0.233 -0.273 Weight 56.504 9.059 0.863 0.284 -0.120 -0.028 -0.069 -0.024 -0.070 0.151 Height 166.018 8.146 0.857 -0.044 -0.050 0.003 -0.016 -0.064 0.024 0.097 Sitting Height 86.860 5.763 0.717 0.081 -0.076 -0.180 0.031 0.012 0.142 0.101 Bicep 4.027 0.949 -0.065 0.857 0.240 -0.021 0.027 0.086 0.001 0.073 Tricep 7.573 1.810 -0.069 0.876 0.104 0.043 -0.022 -0.026 -0.041 0.070 Subscapular 8.128 1.695 0.310 0.784 -0.077 -0.105 0.089 0.018 0.148 -0.108 Suprailiac 7.872 2.480 0.105 0.882 -0.052 0.045 0.015 -0.034 -0.085 -0.088 MUAC 24.605 2.796 0.685 0.393 -0.104 -0.084 -0.114 0.013 -0.043 0.124 CC 35.233 2.609 0.796 0.324 -0.145 -0.078 -0.049 0.055 -0.035 0.192 Maturity 3.848 0.781 0.717 -0.021 -0.146 -0.008 0.265 -0.028 0.246 -0.063 Task 59.842 7.802 0.072 -0.034 0.025 -0.203 0.126 0.731 0.012 -0.158 Ego 32.826 11.104 -0.011 0.061 -0.120 0.067 -0.143 0.788 0.003 0.104 Ball Control 7.245 2.153 0.041 0.007 0.072 0.028 -0.428 -0.003 0.690 -0.129 Long Pass 3.783 2.733 0.423 0.007 -0.225 0.133 0.074 -0.124 0.467 -0.163 Short Pass 9.853 3.728 0.091 0.002 0.164 0.045 0.093 0.055 0.805 0.198 Shooting RTC 3.516 2.923 -0.097 0.042 -0.070 0.808 -0.010 -0.033 0.091 -0.069 Shooting LTC 3.429 2.894 -0.040 -0.060 0.007 0.842 0.088 -0.074 -0.012 0.008 Eigenvalue 6.461 3.547 2.127 1.733 1.379 1.337 1.035 1.017 Variability (%) 20.827 13.026 10.334 6.022 5.555 4.781 6.614 4.520 Cumulative % 20.827 33.853 44.187 50.208 55.763 60.544 67.158 71.677
Due to the transformations of a new set data, output from this analysis were used as an input for further analysis in HACA and ANN.
Based on the technical skill related components extracted by PCA (short pass, shooting RTC and shooting LTC), selection of the categorical dependent component were used in HACA which lead to the identification of C1 (novice) and C2 (elite) groups. Fig. 1 project the classification of the players in relation to their technical skill related performance group determined by HACA, which is based on the resemblance level of the technical skill relative performance. Selection of the technical skill relative performance as categorical dependent components to facilitate this research is based on the recommendation of the previous research [26].
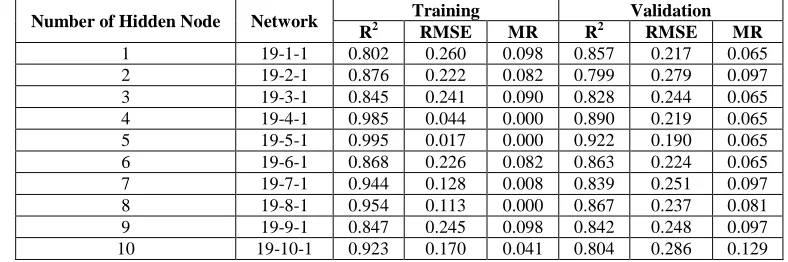
The summary of the results acquired, given by the correlation of determination (R2), root mean square error (RMSE) and misclassification rate (MR) as presented in Table II. It is shown that generally all ANN models gave satisfactory in predicting technical skill relative performance. Table II and Fig. 2 show the prediction performance of PCA-feed-forward-ANN models for forecasting soccer technical skill using combinations of PC scores (output from PCA) as an input variable. In the proposed Model of Specific Skill related Soccer Performance (SSRSP), the
optimum neuron in the hidden layers was five neurons. The R2 values of training and validation are 0.995 and 0.922 respectively. The results projected by RMSE for training and validation are 0.017and 0.190 respectively. Meanwhile, results show by MR for training and validation are 0.000 and 0.065 respectively. However, five hidden nodes network model are considered optimum as revealed by correlation of determination (0.922), root mean square error (0.190) and misclassification rate (0.065) in validation phase. The ANN model of optimum architecture for specific skill related soccer performance also illustrated in Fig. 2.
Fig. 1 Dendrogram of classification based on specific technical skill related to soccer
In this current research, we aimed to determine the key relative performance predictor variables of soccer technical skill performance by using this multivariate approach.
Based on the result of PCA (see Table I) this analysis revealed the most significant components related to the soccer. Out of twenty six parameters that has been tested, PCA revealed only nineteen parameters show value above
the threshold. This indicated that there is a similarity between the measurements taken before and not too exaggerated to say that output form a new data set is actually can be simplified [25]. On the other hand, instead of testing player’s performance with all twenty six parameters, this can be simplified only to nineteen measurement in soccer which is cost and time effective. Similarly, the finding from this current study is concordance with prior research stated that, even though a variety of test protocol has been introduced related to the soccer performance, some of it operationally tries to measure a same parameter [32], [33]. Because of it, PCA project a relevant finding which is helping figuring out the less importance parameters excluded from further analysis [34].
Likewise, dendrogram (see Fig. 1) revealed that the two groups were clustered namely, novice and expert. The distinction exists between the groups is resulting from the differences level of technical skill related to the soccer performance. Technical skill has been known to be an essential criteria components in soccer [26]. Based on expert recommendations, a categorical dependent component (novice and expert) created as an input layer for ANN. Similarly, by using multivariate analysis, the finding of the research is more robust, a holistic scope of finding and the finding is more objectivity [35]. The advantages using HACA method is to classify [27] variables or cases (observations/samples) into clusters with high homogeneity level within the class and high heterogeneity level between classes with respect to a predetermined selection criterion [28].
TABLEII
CROSS-VALIDATION RESULT OF SENSITIVITY ANALYSIS IN SPECIFIC SKILL RELATED SOCCER PERFORMANCE (SSRSP) PREDICTION MODEL
Number of Hidden Node Network Training Validation
R2 RMSE MR R2 RMSE MR
1 19-1-1 0.802 0.260 0.098 0.857 0.217 0.065 2 19-2-1 0.876 0.222 0.082 0.799 0.279 0.097 3 19-3-1 0.845 0.241 0.090 0.828 0.244 0.065 4 19-4-1 0.985 0.044 0.000 0.890 0.219 0.065 5 19-5-1 0.995 0.017 0.000 0.922 0.190 0.065 6 19-6-1 0.868 0.226 0.082 0.863 0.224 0.065 7 19-7-1 0.944 0.128 0.008 0.839 0.251 0.097 8 19-8-1 0.954 0.113 0.000 0.867 0.237 0.081 9 19-9-1 0.847 0.245 0.098 0.842 0.248 0.097 10 19-10-1 0.923 0.170 0.041 0.804 0.286 0.129
The prediction performance of PCA-feed forward-ANN models for forecasting soccer technical skill using combinations of PC scores (output from PCA) as an input variable. In the proposed model of Specific Skill related Soccer Performance (SSRSP) revealed, the optimum neuron in the hidden layers was five neurons. Based on the result (see Table II and Fig. 2) by using the sensitivity analysis method in PCA as an input in prior analysis of ANN, it revealed very high value in a correlation of determination (R2 ≈ 1.00) and very low values in root mean square and
misclassification rate (RMSE and MR ≈ 0.00). Nevertheless, the finding of this research is in concordance with the
previous study showing the very high value in a correlation of determination (R2 ≈ 1.00) and very low values in root
mean square and misclassification rate (RMSE and MR ≈
Fig. 2 ANN model of Architecture for Specific Skill related Soccer Performance (SSRSP)
IV.CONCLUSIONS
In the soccer pattern recognition model, ANN models were established to predict the two levels of skills (Novice and Elite) of Malaysian youth soccer player’s relative performance obtained by HACA. Initially, optimization of PCA and HACA conclude that only nineteen parameters in eight PC’s with 71.68% of cumulative variance. Similarly, HACA also classified there is two different performance levels of skill exist among the players. Furthermore, ANN showed better prediction performance in technical skill performance on their relative performance with correlation of determination give a high value especially in hidden nodes five. Results acquired for the ANN models show the superior generalization parameters selection of SSRSP models. The use of ANN allows a lessening of the number of relative performance parameters needed to identify the skillful players. The results showed that the model is successful in discriminating technical skill performance according to the two different levels of skill among youth soccer players. This SSRSP-ANN models are definitely very useful tools in helping decision makers achieve better management. For the summary, by combining this method, it is resulting the possibility of defining the optimum number of parameters for the specific player's relative performance evaluation, adding more value for talent identification, create more competitive environment for producing elite players which in turn will reduce the costs, energy and time of the monitoring and development of world class players.
ACKNOWLEDGMENT
The authors thank the University of Sultan Zainal Abidin (UniSZA), for providing the research grant for the research (UniSZA/1/2015/SRGS/3/RR179). The authors also express their gratefulness to the Terengganu State Sports Council for their contribution in this research. Moreover, the authors are grateful to all team managers, coaches as well as the players for their help and support throughout the data collection process.
REFERENCES
[1] L. M. Oberacker, S. E. Davis, G. G. Haff, C. A. Witmer and G. L. Moir, “The Yo-Yo IR2 test: Physiological response, reliability, and application to elite soccer,” Journal of Strength and Conditioning Research, vol. 26, pp. 2734-2740, Oct. 2012.
[2] U. Aasa, S. Jaric, M. Barnekow-Bergkvist and H. Johansson, “Muscle strength assessment from functional performance tests: Role of body size,” Journal of Strength and Conditioning Research, vol. 17, pp. 664-670, Nov. 2003.
[3] N. D. Geladas, G. P. Nassis and S. Pavlicevic, “Somatic and physical traits affecting sprint swimming performance in young swimmers,” International Journal of Sports Medicine, vol. 26, pp. 139-144, Mar. 2005.
[4] S. Girold, P. Calmels, D. Maurin, N. Milhau and J. C. Chatard, “Assisted and resisted sprint training in swimming,” Journal of Strength and Conditioning Research, vol. 20, pp. 547-554, Aug. 2006.
[5] D. Ugarkovic, D. Matavulj, M. Kukolj and S. Jaric, “Standard anthropometric, body composition, and strength variables as predictors of jumping performance in elite junior athletes,” Journal of Strength and Conditioning Research, vol. 16, pp. 227-230, May. 2002.
[6] M. R. Abdullah, R. M. Musa, Maliki, A. B. H. M. Maliki, N. A. Kosni and P. K. Suppiah, “Role of psychological factors on the performance of elite soccer players,” Journal of Physical Education and Sport, vol. 16, pp. 170-176, Mar. 2016.
[7] L. M. Massuça, I. Fragoso and J. Teles, “Attributes of top elite team-handball players,” Journal of Strength and Conditioning Research, vol. 28, pp. 178-186, Jan. 2014.
[8] S. Trninić, I. Jelaska and V. Papić, “Kinesiological, anthropological, and methodological aspects of efficacy equation in team sports games,” Acta Kinesiologica, vol. 3, pp. 7-18, Jan. 2009.
[9] J. M. Silva III, B. B. Shultz, R. W. Haslam and D. Murray, “A psychophysiological assessment of elite wrestlers,” Research Quarterly for Exercise and Sport, vol. 52, pp. 348-358, Oct. 1981. [10] M. L. Zampagni, D. Casino, P. Benelli, A. Visani, M. Marcacci and
G. De Vito, “Anthropometric and strength variables to predict freestyle performance times in elite master swimmers,” Journal of Strength and Conditioning Research, vol. 22, pp. 1298-1307, Jul. 2008.
[11] L. Mellemkjaer, J. Christensen, K. Frederiksen, J. L. Baker, A. Olsen, T. I. A. Sørensen and A. Tjønneland, “Leg length, sitting height and postmenopausal breast cancer risk,” British Journal of Cancer, vol. 107, pp. 165-168, Jun. 2012.
[12] M. J. Marfell-Jones, A. D. Stewart and J. H de Ridder, International Standards for Anthropometric Assessment, Wellington, New Zealand: International Society for the Advancement of Kinanthropometry, 2012.
[13] E. Falaschetti, A. D. Hingorani, A. Jones, M. Charakida, N. Finer, P. Whincup, D. A. Lawlor, G. D. Smith, N. Sattar and J. E. Deanfield, “Adiposity and cardiovascular risk factors in a large contemporary population of pre-pubertal children,” European Heart Journal, vol. 31, pp. 3063-3072, Dec. 2010.
[14] J. Tanner, Growth at Adolescence, 2nd ed., Oxford, United Kingdom: Balckwell Scientific Publications, 1962.
[15] T. Noguchi, S. Demura and K. Takahashi, “Relationships between sit-ups and abdominal flexion strength tests and the thickness of each abdominal muscle,” Advances in Physical Education, vol. 3, pp. 84-88, May 2013.
[16] C. Ernesto, F. M. da Silva, L. A. Pereira and G. F. de Melo, “Cross validation of different equations to predict aerobic fitness by the shuttle run 20 meters test in Brazilian students,” Journal of Exercise Physiology Online, vol. 18, pp. 46-56, Feb. 2015.
[17] M. Russell and E. Tooley, “Anthropometric and performance characteristics of young male soccer players competing in the UK,” Serbian Journal of Sports Sciences, vol. 5, pp. 155-162, Dec. 2011. [18] T. R. Baechle and R. W. Earle, Essentials of Strength Training and
Conditioning, 3rd ed., T. R. Baechle and R. W. Earle, Eds. Illinois, United States: Human Kinetics, 2008.
[19] D. Mayorga-Vega, R. Merino-Marban and J. Viciana, “Criterion-related validity of sit-and-reach tests for estimating hamstring and lumbar extensibility: A meta-analysis,” Journal of Sports Science and Medicine, vol. 13, pp. 1-14, Jan. 2014.
[21] D. Rösch, R. Hodgson, L. Peterson, T. Graf-Baumann, A. Junge, J. Chomiak and J. Dvorak, “Assessment and evaluation of football performance,” American Journal of Sports Medicine, vol. 28, pp. 29-39, Sep. 2000.
[22] J. L. Duda, “Relationship between task and ego orientation and the perceived purpose of sport among high school athletes,” Journal of Sport and Exercise Psychology, vol. 11, pp. 318-335, Sep. 1989. [23] H. Juahir, S. M. Zain, M. K. Yusoff, T. T. Hanidza, A. M. Armi, M.
E. Toriman and M. Mokhtar, “Spatial water quality assessment of Langat River Basin (Malaysia) using environmetric techniques,” Environmental Monitoring and Assessment, vol. 173, pp. 625-641, Feb. 2011.
[24] D. Dominick, H. Juahir, M. T. Latif, S. M. Zain and A. Z. Aris, “Spatial assessment of air quality patterns in Malaysia using multivariate analysis,” Atmospheric Environment, vol. 60, pp. 172-181, Dec. 2012.
[25] S. N. S. A. Mutalib, H. Juahir, A. Azid, S. M. Sharif, M. T. Latif, A. Z. Aris, S. M. Zain and D. Dominick, “Spatial and temporal air quality pattern recognition using environmetric techniques: A case study in Malaysia,” Environmental Science: Processes and Impacts, vol. 15, pp. 1717-1728, Jun. 2013.
[26] O. Rowat, J. Fenner and V. Unnithan, “Technical and physical determinants of soccer match-play performance in elite youth soccer players,” Journal of Sports Medicine and Physical Fitness, Feb. 2016. [27] M. R. Abdullah, A. B. H. M. Maliki, R. M. Musa, N. A. Kosni and H. Juahir, “Multi-hierarchical pattern recognition of athlete’s relative performance as a criterion for predicting potential athletes,” Journal of Young Pharmacists, vol. 8, pp. 463-470, Aug. 2016.
[28] J. E. McKenna, “An enhanced cluster analysis program with bootstrap significance testing for ecological community analysis,” Environmental Modelling and Software, vol. 18, pp. 205-220, Apr. 2003.
[29] A. Andasuryani, Y. A. Purwanto, I. W. Budiastra and K. Syamsu, “Determination of catechin content in gambir powder from dried gambir leaves quickly using FT NIR PLS model,” International Journal on Advanced Science, Engineering and Information Technology, vol. 4, pp. 303-307, Aug. 2014.
[30] S. C. Suh, Practical Applications of Data Mining, Massachusetts, United States: Jones and Bartlett Learning, 2012.
[31] A. J. Coutts, “In the age of technology, Occam's razor still applies,” International Journal of Sports Physiology and Performance, vol. 9, pp. 741-741, Sep. 2014.
[32] M. Bush, C. Barnes, D. T. Archer, B. Hogg and P.S. Bradley, “Evolution of match performance parameters for various playing positions in the English Premier League,” Human Movement Science, vol. 39, pp. 1-11, Feb. 2015.
[33] D. Castillo, J. Yanci, J. A. Casajús and J. Cámara, “Physical fitness and physiological characteristics of soccer referees,” Science and Sports, vol. 31, pp. 27-35, Feb. 2016.
[34] C. W. Liu, K. H. Lin and Y. M. Kuo, “Application of factor analysis in the assessment of groundwater quality in a blackfoot disease area in Taiwan,” Science of the Total Environment, vol. 313, pp. 77-89, Sep. 2003.
[35] T. T. Ismail, H. Juahir, A. Z. Aris, S. M. Zain and A. A. Samah, “Local community acceptance of the rare earth industry: The case of the Lynas Advanced Materials Plant (LAMP) in Malaysia,” Environment, Development and Sustainability, vol. 18, pp. 739-762, Jun. 2016.