PRIMARY RESEARCH
Expression profile analysis identifies key
genes as prognostic markers for metastasis
of osteosarcoma
Xiaoqing Guan
1*†, Zhiyuan Guan
2,3†and Chunli Song
2,3*Abstract
Background: OS is the most common malignant tumor of bone which was featured with osteoid or immature bone
produced by the malignant cells, and biomarkers are urgently needed to identify patients with this aggressive disease.
Methods: We downloaded gene expression profiles from GEO and TARGET datasets for OS, respectively, and
per-formed WGCNA to identify the key module. Whereafter, functional annotation and GSEA demonstrated the relation-ships between target genes and OS.
Results: In this study, we discovered four key genes—ALOX5AP, HLA-DMB, HLA-DRA and SPINT2 as new prognostic markers and confirmed their relationship with OS metastasis in the validation set.
Conclusions: In conclusion, ALOX5AP, HLA-DMB, HLA-DRA and SPINT2 were identified by bioinformatics analysis as possible prognostic markers for OS metastasis.
Keywords: Biomarker, Osteosarcoma, Metastasis, Molecular classifier, Prognosis, Gene expression
© The Author(s) 2020. This article is licensed under a Creative Commons Attribution 4.0 International License, which permits use, sharing, adaptation, distribution and reproduction in any medium or format, as long as you give appropriate credit to the original author(s) and the source, provide a link to the Creative Commons licence, and indicate if changes were made. The images or other third party material in this article are included in the article’s Creative Commons licence, unless indicated otherwise in a credit line to the material. If material is not included in the article’s Creative Commons licence and your intended use is not permitted by statutory regulation or exceeds the permitted use, you will need to obtain permission directly from the copyright holder. To view a copy of this licence, visit http://creat iveco mmons .org/licen ses/by/4.0/. The Creative Commons Public Domain Dedication waiver (http://creat iveco mmons .org/publi cdoma in/ zero/1.0/) applies to the data made available in this article, unless otherwise stated in a credit line to the data.
Background
Osteosarcoma (OS) is the most common type of cancer that arises in bones and most people diagnosed with OS are under the age of 25 [1]. The incidence of OS in the general population is 2–3/million/year and the peak at the age of 15–19 is 8–11/million/year [2]. OS is charac-terized by early metastasis, poor prognosis without treat-ment [3], and more than 90% of patients die from lung metastasis before multiple chemotherapy. OS is currently undergoing multidisciplinary treatment, with approxi-mately 15–20% of patients showing signs of metastasis at diagnosis, most in the lungs. Metastasis remains the
leading cause of death in patients with OS, compared with 70% of patients with localized disease, and only about 20% becoming long-term survivors.
Previous studies have investigated mutational altera-tions or gene factors in an attempt to identify candidate OS driver oncogenes or tumors suppressors [4–6]. So far, for patients with metastatic OS, neither prognostic factors nor optimal treatment methods have been well established. Therefore, more attention must be paid to more precise risk assessment, not only for patient consul-tation, but also for determining treatment options based on reliable stratified criteria. In order to detect pulmo-nary metastasis OS early and improve poor survivorship, it is important to further explore more effective prognos-tic biomarkers and therapeuprognos-tic targets.
Although research on biomarkers for metastasis within OS has recently expanded [7, 8], the targets after any OS diagnosis within the clinic and suitable for various sequencing platforms remain sparse. Recent develop-ment of gene chips and high-throughput sequencing
Open Access
*Correspondence: [email protected]; [email protected]
†Xiaoqing Guan and Zhiyuan Guan contributed equally to this work 1 Center for Cancer Bioinformatics, Key Laboratory of Carcinogenesis
and Translational Research (Ministry of Education), Peking University Cancer Hospital & Institute, Beijing, China
2 Department of Orthopaedics, Peking University Third Hospital, Beijing,
China
technology, have enabled the identification of key genes related to tumor progression and prognosis based on big data integration and bioinformatics. Weighted gene co-expression network analysis (WGCNA) is a systematic biological method that could identify highly synergisti-cally altered gene sets and screen out therapeutic targets or candidate biomarkers based on the inherent char-acteristics of the gene sets and the correlation between gene sets and phenotypes.
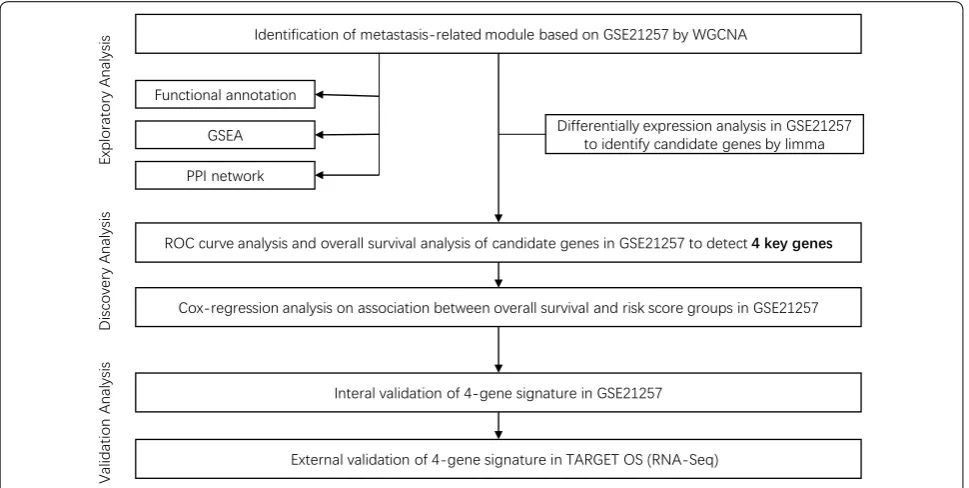
Aiming at identifying and validating key genes in OS metastasis, the present study firstly identified associated module by WGCNA according to the gene expression profiles from Gene Expression Omnibus (GEO) data-sets and determined the differentially expressed genes between metastatic OS samples and non-metastatic samples. Subsequently, Gene Ontology (GO) and Kyoto Encyclopedia of Genes and Genomes (KEGG) pathway analyses were performed to determine the most sig-nificant pathways associated with OS metastasis. Addi-tionally, we constructed Kaplan–Meier (KM) curves and receiver operating characteristic (ROC) curves and screened the key genes related to OS prognosis. Moreo-ver, univariate and multivariate Cox regression analysis were conducted to evaluate the predictive effect of the gene signature. Finally, we validated the gene signature using an external RNA sequencing (RNA-Seq) expres-sion data obtained from The Therapeutically Applicable Research to Generate Effective Treatments (TARGET).
The results may reveal the prognostic value of the gene signature for OS (Fig. 1).
Methods
Data sources and data preprocessing
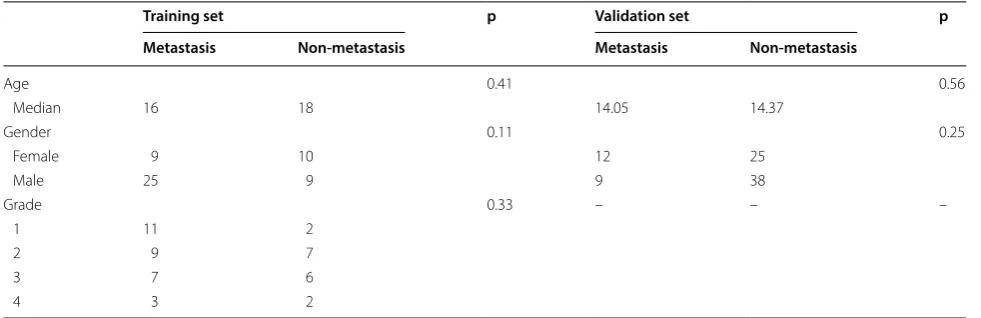
We downloaded standardized matrix profile (*series matrix.txt) of GSE21257 (a microarray dataset) and obtained patient information from GEO database (Table 1) [9]. The platform of the dataset is the GPL10295 Illumina human-6 v2.0 expression beadchip. We removed probes not mapping to the Gene symbol using platform annotation file. For different probes corresponding to the same gene, their median expression values were taken as the final gene expression value. Differentially expressed genes (DEGs) between OS samples with metastasis and those without metastasis were identified using the “limma” (linear models for microarray data) R package (False discovery rate (FDR) < 0.05 and absolute of log-2fold change (FC) > 1) [10].
The OS RNA-seq expression data and the correspond-ing clinical follow-up data were obtained from the pub-licly available website of the National Cancer Institute TARGET Data Matrix (https ://ocg.cance r.gov/progr ams/targe t/data-matri x). To meet the requirement for data analysis, we excluded the samples with incomplete information, then 84 OS expression data were remained. Genes that have average expression (Transcripts Per Million (TPM) > 1) between samples were deemed as
expressed. The expression value was processed as log2 (TPM + 1) for subsequent analysis.
Constructing dynamic weighted gene co‑expression network
We chose the 3000 most-varying genes for network con-struction and module detection. Specifically, the median absolute deviation (MAD) was used as a robust measure of variability. The network was built based on the proto-cols of R package WGCNA [11, 12]. We firstly clustered the samples to detect outliers. It appeared there was one outlier and we removed it by hand (Additional file 1: Figure S1A). Use PickSoftThreshold function to select β = 7 (scale-free R2 = 0.89) to build an adjacency matrix to make our gene distribution conform to scale-free net-works based on connectivity for training set (Additional file 1: Figure S1B, C). Next, we used a blockwiseModules function to build a gene co-expression network in one step and a dynamic tree-cutting algorithm detected the modules. The parameters used for blockwiseModules function in WGCNA included a minimum module size of 30, and the dendrogram cut height for module detec-tion set to 0.25 to define modules of co-expressed probe-sets. Meanwhile we calculated module eigengene of each module by measuring the first principal component of a specific module, which represented the overall level of gene expression within this module. Then, according to the correlation between the clinical traits and the module eigengene and the p-value to mine the modules related to the traits, we selected the module with the highest Pear-son correlation coefficient for metastasis into subsequent analysis. Finally, to find hub genes for a given module, gene significance (GS, the absolute value of the correla-tion between the gene and the trait) and module mem-bership (MM, the correlation of the module eigengene and the gene expression profile) were evaluated. Based on
criteria of MM > 0.8 and GS > 0.2, hub genes in the blue module were screened. Cytoscape version 3.7.2 was used for network visualization. The above analysis is imple-mented using the R package “WGCNA”.
Functional annotation and gene set enrichment analysis (GSEA)
R package clusterProfiler was used to conduct GO Bio-logical Process (BP) [13] and KEGG biological pathway over representation analysis for interesting module genes [14]. GO terms and KEGG pathways with adjust p < 0.05 were considered statistically significant pathways. The enrichment analysis was implemented in command line of GSEA [15, 16]. An expression dataset and phenotype labels in the GSE21257 dataset were used to conduct GSEA analysis according to metastasis status (metasta-sis vs. non-metasta(metasta-sis). The data was then interrogated against Reactome gene sets (1499 gene-sets) from The Molecular Signatures Database (MSigDB) version 6.2 [17,
18]. We set the cut-off criteria as gene set size > 15, Num-ber of enriched gene sets that are significant, as indicated by a FDR of less than 25%.
Cox‑regression based survival analysis
Univariate cox regression analysis was firstly performed to screen survival related genes. Furthermore, ROC anal-ysis was performed to evaluate the predicting efficiency of the gene risk score and the area under curve (AUC) was calculated. The genes with p-value < 0.05 as well as AUC > 0.85 were screened as candidate genes for next analysis. These candidate genes were further selected for predictive signature construction. Risk scores were calcu-lated and included in multivariate regression analysis in a Cox proportional hazard regression model for survival analysis. The Kaplan–Meier curve was used to visualize the survival probability for each group and p-value was Table 1 Clinical features of patients in the training set and validation set
Training set p Validation set p
Metastasis Non‑metastasis Metastasis Non‑metastasis
Age 0.41 0.56
Median 16 18 14.05 14.37
Gender 0.11 0.25
Female 9 10 12 25
Male 25 9 9 38
Grade 0.33 – – –
1 11 2
2 9 7
3 7 6
calculated by the log-rank test. The survival analysis was implemented with package survival and survminer. The ROC analysis was performed using pROC package.
Statistical analysis
Our study used a Wilcoxon rank sum test to compare continuous data between two groups. a Chi square test or Fisher’s exact test to test the difference between categori-cal variables. A p-value < 0.05 or a adjusted p-value < 0.05 was considered statistically significant. The Kaplan– Meier method and log-rank test was used to evaluate the correlation between gene expression and overall survival. The WGCNA method was analyzed by Pearson correla-tion analysis. All of these processes were conducted by R software (version 3.5.1 (×64)).
Results
Identification of key modules associated with OS metastasis
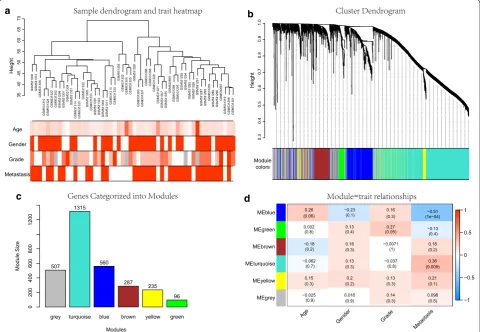
After data preprocessing and quality evaluation, an expression matrix with 3000 most varying genes and 52 OS samples with clinical information in GSE21257 was used for gene co-expression network construction (Fig. 2a). After merging similar modules, we were able to identify a total of six modules and each module was des-ignated by distinct colors to distinguish between modules (Fig. 2b). The number of genes in each module were pre-sented in Fig. 2c. Genes in grey module were removed in the further analysis. Additional file 1: Figure S1D allows us to visualize the interaction relationship of 5 modules. The representation showed a high-scale independence
a b
c d
Fig. 2 Construction and identification of modules associated with the clinical traits. a Clustering dendrogram of OS samples and the clinical traits. For age and grade, white means a low value, red a high value, and grey a missing entry; for gender and metastasis, white means female or non-metastasis, red means male or metastasis. b Hierarchical clustering based on the dynamic tree, each branch above represented a gene, and each color below represented a gene co-expression module. Grey module color is a reserved one for genes that are not part of any module. c
degree between any two modules even between genes within each gene module. Furthermore, eigengenes of all modules were calculated and clustered based on their correlation. The plot can be found in Additional file 1: Figure S1E, F. It is clear from this plot that the 5 mod-ules were mainly divided into two clusters, which were consistent with the result of eigengene network heat-map. Next, relevance of all with all traits were assessed and results were presented in Fig. 2d. The highest corre-lation observed was for the blue module with metastasis (correlation coefficient values, − 0.51; p-values, 1e−04). In addition, the turquoise module was also found to be significantly related to metastasis (correlation coefficient values, 0.36; p-values, 0.009). Overall, we focused on the 560 genes in the blue modules in subsequent analysis.
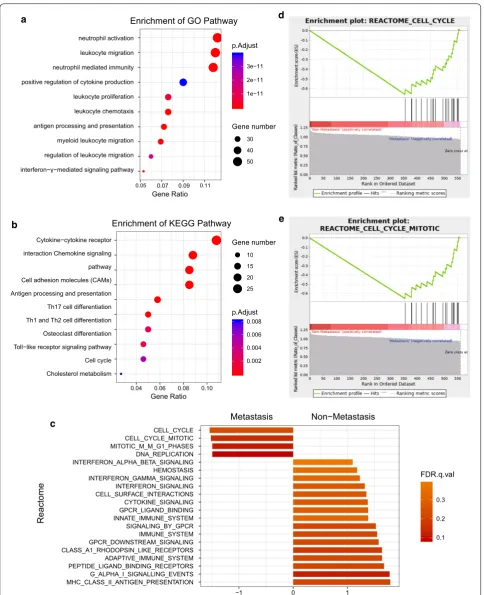
Functional annotation and GSEA
We conducted GO function and KEGG pathway analy-ses to examine the potential functional significance of the genes within blue module. BP of GO analysis showed that blue module was mainly enriched with cell migration, cell proliferation, cell cycle and immune response related pathway (Fig. 3a). Figure 3b presented the top 10 statis-tically significant observations of KEGG. The significant pathways included cytokine–cytokine receptor interac-tion, chemokine signaling pathway, toll-like receptor signaling pathway, cell differentiation, antigen process-ing and presentation and metabolism related pathway. In order to further understand the biological function of genes in blue module, GSEA was utilized to perform a pathway enrichment analysis and find enrichment of pathways defined by Reactome. Then we found 2 gene sets (cell cycle and cell cycle mitotic) were significantly upregulated in phenotype Metastasis in Reactome gene sets (Fig. 3c). The detailed results are available in Fig. 3d, e.
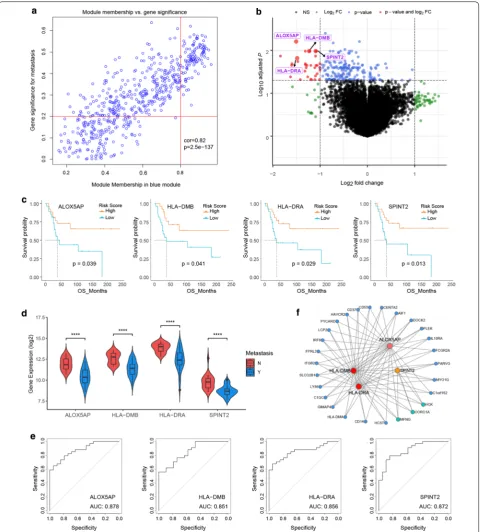
Detection of hub genes based on the training set
As described in “Methods”, we analyzed the blue mod-ule and plotted MM against GS in Fig. 4a. All the DEGs were showed in Fig. 4b. After overlapping genes found by WGCNA and DEGs, we obtained 29 genes recog-nized as candidate genes. Among them, arachidonate 5-lipoxygenase activating protein (ALOX5AP), major his-tocompatibility complex, class II, DM beta (HLA-DMB), major histocompatibility complex, class II, DR alpha (HLA-DRA) and serine peptidase inhibitor, Kunitz type
2 (SPINT2) were negatively associated with the overall
survival of OS patients (Figs. 4c). Moreover, the expres-sion levels of these 4 genes were significantly higher in OS patients with metastasis, compared with non-metas-tasis patients (Fig. 4d). In addition, the diagnostic per-formance of these 4 genes was evaluated by ROC curves.
The AUC showed that ALOX5AP, HLA-DMB, HLA-DRA
and SPINT2 indicated excellent diagnostic efficiency for
patients with metastasis and those with non-metastasis (Fig. 4e). Figure 4f showed that ALOX5AP, HLA-DMB, HLA-DRA and SPINT2 were highly connected in the net-work and demonstrated that the 4 genes play an impor-tant role in the development of OS.
Evaluation and validation of 4‑gene signature for survival prediction
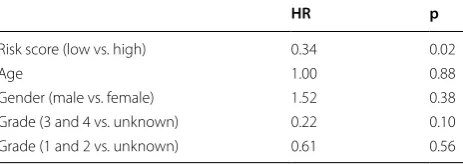
To investigate whether the 4-gene signature could pro-vide an accurate prediction of overall survival in OS patients, the 4-gene signature risk score were calcu-lated for each patient in the training set according to the expression of these 4 genes for OS prediction. Then patients were divided into high- and low-risk groups using the median risk score as the cutoff. As expected, risk model might be a diagnostic marker for OS with an AUC of 0.861 (Fig. 5a) and patients with high-risk scores had a poor prognosis than those with low-risk scores (p = 0.0088) (Fig. 5b). As such, the 4-gene signa-ture was validated using OS data from TARGET, and we achieved consistent results. KM curves revealed that the high-risk scores of 4-gene signature were signifi-cantly associated with shorter overall survival time of OS patients (p = 0.043) (Fig. 5c), which were similar to those observed in the training series. In order to further evalu-ate whether the expression levels of these four genes can provide good prognostic value, a multivariate Cox regres-sion analysis was performed. The results can be seen in Table 2. It was evident that risk scores calculated from these four gene signature remained a strong independent prognostic factor for patients with OS (p = 0.02).
Discussion
a
b
c
d
e
between patients with metastatic OS (10–20%) and non-metastatic OS (50–78%) [25, 26]. Moreover, meta-static OS are still very difficult to control and there are few effective therapeutic targets. Kinase targets, immune checkpoint inhibitors and cell surface marker GD2 have been actively investigated in multiple current clinical tri-als, but are inadequately evaluated [22, 23]. Therefore, further studies on early diagnosis or prediction of metas-tasis are warranted.
In our study, multiple bioinformatics analysis tools were used to identify 4 key genes related to metastasis and prognosis of OS patients, thus we constructed a risk score model which may benefit the treatment and prog-nosis evaluation of OS.
Using GO, KEGG and GSEA, we annotated the func-tion of genes in the key module most related with metastasis, and clarified the underlying mechanism of metastasis in OS. Our results revealed that these genes were found to be enriched in cell cycle, cell proliferation, cell migration and immune response. Some researchers had demonstrated the functional link between cell cycle disorder and cancer cell invasion and metastasis [24, 25].
Several small pilot studies have reported that expression of molecules of tumor cell immune response, particularly HLA class II, can induce anti-tumor T cell responses, which may affect tumor progression and survival time of patients [26, 27]. Hence, we suggested that genes in blue module probably involved in the development and metastasis of OS through cell cycle pathway and immune response pathway.
After screening and filtering, we obtained four genes that may predict OS metastasis and have prognostic effects, and were evaluated in a cox regression model, indicating that it is an independent prognostic factor. The 4 key genes consist of ALOX5AP, HLA-DMB, HLA -DRA and SPINT2. ALOX5AP, also called 5-LO-activating protein (FLAP), which plays an important role in synthe-sis of leukotriene and associates with prognosynthe-sis of pri-mary neuroblastoma patients and esophageal squamous cell carcinoma patients [28]. Shi et al. [29] found that
ALOX5AP showed strong associations in colorectal
car-cinoma due to microsatellite instability. And ALOX5AP has been considered as the important components of the leukotriene-synthesizing enzyme machinery, emerg-ing opportunities for pharmacological intervention, and the development of new medicines exploiting both anti-inflammatory and pro-resolving mechanisms [30]. Abe-lin et al. [31] revealed that HLA-DMB was dominated by professional antigen-presenting cells (APCs) rather than cancer cells. Aissani et al. [32] also found that anti-gen processing by HLA-DMB is a target pathway in the pathogenesis of HIV-related Kaposi’s sarcoma. Sun et al. [33] indicate that KSHV RTA facilitates evasion of the virus from the immune system through manipulation of HLA-DRA. Yokoyama et al. [34] demonstrate genetic overlap between AD and HLA-DRA and suggest that
Specificity
Sensitivit
y
1.0 0.8 0.6 0.4 0.2 0.0
0. 00 .2 0. 40 .6 0. 81 .0 AUC: 0.861 ++++ + ++ ++ +++ ++ ++ ++ ++ + + ++++ ++++ + ++++++++++++++++++++ ++ + + 0.00 0.25 0.50 0.75 1.00
0 50 100 150 200
OS_Months
Survival probilit
y
42 (100) 18 (43) 8 (19) 1 (2) 0 (0) 42 (100) 23 (55) 2 (5) 0 (0) 0 (0)
−
−
Number at risk: n (%)
++ + + ++ + + + + + + + ++ ++ +++ + + + ++ + +
p = 0.0088
0.00 0.25 0.50 0.75 1.00
0 50 100 150 200 250
OS_Months
Survival probilit
y
26 (100) 6 (23) 4 (15) 1 (4) 0 (0) 0 (0) 27 (100) 18 (67) 7 (26) 5 (19) 2 (7) 0 (0)
−
−
Number at risk: n (%)Risk Score High Low + + Risk Score High Low + +
p = 0.043
Training Set Validation Set
a b c
Fig. 5 Evaluation and validation of the 4-gene signature risk model of OS. a The ROC curves are shown for risk score model in training set. b, c
Kaplan–Meier analysis for the overall survival of OS patients in training set (b) and validation set (c)
Table 2 Multivariate analysis adjusted for age, gender, grade, and risk score based on 4 genes signature in the training set
HR p
Risk score (low vs. high) 0.34 0.02
Age 1.00 0.88
Gender (male vs. female) 1.52 0.38
Grade (3 and 4 vs. unknown) 0.22 0.10
HLA-DRA influence AD pathogenesis and progression. HLA-DMB, one of the HLA class II beta chain paral-ogues, is expressed in antigen-presenting cells. Previous studies have confirmed that mRNA and protein levels of HLA-DMB are highly expressed in tumor samples from patients with advanced serous ovarian cancer with a large number of tumor-penetrating CD8 T lymphocytes, which can significantly prolong the median survival time [35]. HLA-DRA, a component of MHC II, alpha chain paralogues, also are expressed in antigen presenting cells. Both at transcription and protein levels, reduced expres-sion of HLA-DRA has been shown to predict poor overall survival and progression-free survival in diffusive large B-cell lymphoma [36]. Moreover, enrichment analysis revealed up-regulation of immune response gene sets, including antigen presentation (HLA-DMB and HLA -DRA). What’s more, the SPINT2 gene is epigenetically silenced or downregulated in human cancers, altering the balance of Hepatocyte growth factor activation/inhibi-tion ratio, which contributes to cancer development and progression. Pereira et al. found that dysregulation of
SPINT2 is a common event in both pediatric and adult
HGG, in which SPINT2 may act as a tumor suppressor.
SPINT2 gene expression was down-regulated, altering
dysregulation of the HGF/MET signaling pathway, which contributes to cancer development and progression [37,
38]. Whether these genes play the same role in the devel-opment and metastasis of OS deserves further study.
However, there were still some limitations in our work. Firstly, there are relatively small numbers of patients in two datasets obtained from publicly available database. In order to verify the stability and accuracy of the risk pre-diction model, more expression data and corresponding clinical information need to be collected, especially inde-pendent cohorts from multiple centers to further evalu-ate the applicability of the model. Secondly, our analysis is completely based on bioinformatics analysis, we need to accumulate more comprehensive experimental evi-dence, including in vivo and in vitro experiments. Finally, our analysis was entirely based on bioinformatics analysis to clarify the effect and possible molecular mechanisms of 4 genes on OS.
Conclusions
In summary, we found 4 genes that may play a key role in OS metastasis and prognosis, and further constructed a risk score model, which may provide new clues for the prediction of OS metastasis and establish foundation to reveal prognostic markers and treatment targets for OS patients.
Supplementary information
Supplementary information accompanies this paper at https ://doi. org/10.1186/s1293 5-020-01179 -x.
Additional file 1: Figure S1. Network construction and module detec-tion. (A) Clustering dendrogram of samples based on their Euclidean distance. (B) Analysis of the scale-free fit index and mean connectivity for various soft-thresholding powers (β). Panels illustrate the scale-free fit index (y-axis) as a function of the soft-thresholding power (x-axis). Solid red horizontal lines are guides of the index at 0.9. At the power = 7, the index curve flattened out upon reaching the higher value in all groups. Effects of power values on the scale independence of genes co-expres-sion modules for OS. (C) Effects of power values on the average connectiv-ity of genes co-expression modules for OS. The panel displays the mean connectivity (degree, y-axis) as a function of the soft-thresholding power (x-axis). (D) Analysis of relationship between pairwise gene co-expression modules. Different colors of horizontal axis and vertical axis represent different modules. The brightness of yellow in the middle represents the degree of connectivity of different modules. There was no significant difference in interactions among different modules, indicating a high-scale independence degree among these modules. The modules in the horizontal and vertical axes were marked with different colors. The degree of the yellow brightness indicated the relevance. The overall relationship between the different modules was small, indicating that the modules had a high degree of independence. (E and F) The modules produced in the clustering analysis were summarized module eigengene dendrogram (E) and eigengene network heatmap (F). The eigengenes were mainly clustered into two clusters, containing 2 modules (modules green and blue) and 3 modules (modules brown, turquoise and yellow), respectively.
Abbreviations
OS: Osteosarcoma; GEO: Gene Expression Omnibus; TARGET: Therapeutically Applicable Research to Generate Effective Treatments; WGCNA: Weighted gene co-expression network analysis; GSEA: Gene Set Enrichment Analysis; ROC: Receiver operating characteristic; DEGs: Differentially expressed genes; FDR: False discovery rate; FC: Fold change; RNA-seq: RNA sequencing; MAD: Median absolute deviation; GS: Gene significance; MM: Module membership; GO: Gene Ontology; KEGG: Kyoto Encyclopedia of Genes and Genomes; AUC : Area under curve; ALOX5AP: Arachidonate 5-lipoxygenase activating protein; HLA-DMB: Major histocompatibility complex, class II, DM beta; HLA-DRA: Major histocompatibility complex, class II, DR alpha; SPINT2: Serine peptidase inhibi-tor, Kunitz type 2.
Acknowledgements
Not applicable
Authors’ contributions
XG and ZG designed and performed analysis. XG drafted the manuscript. CS offered critical revision of the manuscript. All authors read and approved the final manuscript.
Funding
This work was supported by Grants from the National Natural Science Founda-tion of China (Grant Number 81672133, 81874010).
Availability of data and materials
The study data is available at GEO (https ://www.ncbi.nlm.nih.gov/geo/query / acc.cgi?acc=GSE21 257) and TARGET (https ://ocg.cance r.gov/progr ams/targe t/ data-matri x and choose “OS”).
Ethics approval and consent to participate
Not applicable.
Consent for publication
Competing interests
The authors declare that they have no competing interests.
Author details
1 Center for Cancer Bioinformatics, Key Laboratory of Carcinogenesis
and Translational Research (Ministry of Education), Peking University Cancer Hospital & Institute, Beijing, China. 2 Department of Orthopaedics, Peking
University Third Hospital, Beijing, China. 3 Beijing Key Laboratory of Spinal
Diseases, 49 North Garden Rd Haidian District, Beijing, China.
Received: 27 December 2019 Accepted: 17 March 2020
References
1. Arndt V, et al. Up-to-date monitoring of childhood cancer long-term survival in Europe: tumours of the sympathetic nervous system, retino-blastoma, renal and bone tumours, and soft tissue sarcomas. Ann Oncol. 2007;18(10):1722–33.
2. Collins M, et al. Benefits and adverse events in younger versus older patients receiving neoadjuvant chemotherapy for osteosarcoma: findings from a meta-analysis. J Clin Oncol. 2013;31(18):2303–12.
3. Mirabello L, Troisi RJ, Savage SA. International osteosarcoma incidence patterns in children and adolescents, middle ages and elderly persons. Int J Cancer. 2009;125(1):229–34.
4. Kansara M, et al. Translational biology of osteosarcoma. Nat Rev Cancer. 2014;14(11):722–35.
5. Bousquet M, et al. Whole-exome sequencing in osteosarcoma reveals important heterogeneity of genetic alterations. Ann Oncol. 2016;27(4):738–44.
6. Subbiah V, et al. Alpha particle radium 223 dichloride in high-risk osteosarcoma: a phase I dose escalation trial. Clin Cancer Res. 2019;25(13):3802–10.
7. Cortini M, Avnet S, Baldini N. Mesenchymal stroma: role in osteosarcoma progression. Cancer Lett. 2017;405:90–9.
8. Scott MC, et al. Comparative transcriptome analysis quantifies immune cell transcript levels, metastatic progression, and survival in osteosar-coma. Cancer Res. 2018;78(2):326–37.
9. Barrett T, et al. NCBI GEO: archive for functional genomics data sets— update. Nucleic Acids Res. 2012;41(D1):D991–5.
10. Ritchie ME, et al. limma powers differential expression analyses for RNA-sequencing and microarray studies. Nucleic Acids Res. 2015;43(7):e47–e47.
11. Langfelder P, Horvath S. WGCNA: an R package for weighted correlation network analysis. BMC Bioinformatics. 2008;9(1):559.
12. Langfelder P, Horvath S. Fast R functions for robust correlations and hierarchical clustering. J Stat Softw. 2012;46(11):17.
13. Gene Ontology Consortium. The gene ontology resource: 20 years and still going strong. Nucleic Acids Res. 2019;47(D1):D330–d338.
14. Yu G, Wang LG, Han Y, He QY. clusterProfiler: an R package for comparing biological themes among gene clusters. OMICS. 2012;16(5):284–7. 15. Mootha VK, et al. PGC-1α-responsive genes involved in oxidative
phos-phorylation are coordinately downregulated in human diabetes. Nat Genet. 2003;34(3):267–73.
16. Subramanian A, et al. Gene set enrichment analysis: a knowledge-based approach for interpreting genome-wide expression profiles. 2005;102(43):15545–50.
17. Liberzon A, et al. The molecular signatures database hallmark gene set collection. Cell Syst. 2015;1(6):417–25.
18. Fabregat A, et al. The reactome pathway knowledgebase. Nucleic Acids Res. 2018;46(D1):D649–d655.
19. Whelan JS, Davis LE. Osteosarcoma, chondrosarcoma, and chordoma. J Clin Oncol. 2018;36(2):188–93.
20. Bielack S, et al. Osteosarcoma: ESMO clinical recommendations for diag-nosis, treatment and follow-up. Ann Oncol. 2009;20(Suppl 4):137–9. 21. Smeland S, et al. Survival and prognosis with osteosarcoma: outcomes
in more than 2000 patients in the EURAMOS-1 (European and American Osteosarcoma Study) cohort. Eur J Cancer. 2019;109:36–50.
22. Wunder JS, et al. Opportunities for improving the therapeutic ratio for patients with sarcoma. Lancet Oncol. 2007;8(6):513–24.
23. Piperno-Neumann S, et al. Zoledronate in combination with chemo-therapy and surgery to treat osteosarcoma (OS2006): a randomised, multicentre, open-label, phase 3 trial. Lancet Oncol. 2016;17(8):1070–80. 24. Otto T, Sicinski P. Cell cycle proteins as promising targets in cancer
therapy. Nat Rev Cancer. 2017;17(2):93–115.
25. Kohrman AQ, Matus DQ. Divide or conquer: cell cycle regulation of inva-sive behavior. Trends Cell Biol. 2017;27(1):12–25.
26. Gonzalez H, Hagerling C, Werb Z. Roles of the immune system in cancer: from tumor initiation to metastatic progression. Genes Dev. 2018;32(19–20):1267–84.
27. Janssen LME, et al. The immune system in cancer metastasis: friend or foe? J Immunother Cancer. 2017;5(1):79.
28. Wu B, et al. The arachidonic acid metabolism protein-protein interaction network and its expression pattern in esophageal diseases. Am J Transl Res. 2018;10(3):907–24.
29. Shi Q, et al. Integrative analysis identifies DNMTs against immune-infil-trating neutrophils and dendritic cells in colorectal cancer. Epigenetics. 2019;14(4):392–404.
30. Haeggstrom JZ. Leukotriene biosynthetic enzymes as therapeutic targets. J Clin Invest. 2018;128(7):2680–90.
31. Abelin JG, et al. Defining HLA-II ligand processing and binding rules with mass spectrometry enhances cancer epitope prediction. Immunity. 2019;51(4):766–779.e17.
32. Aissani B, et al. SNP screening of central MHC-identified HLA-DMB as a candidate susceptibility gene for HIV-related Kaposi’s sarcoma. Genes Immun. 2014;15(6):424–9.
33. Sun Z, et al. Major histocompatibility complex class II HLA-DRalpha is downregulated by Kaposi’s sarcoma-associated herpesvirus-encoded lytic transactivator RTA and MARCH8. J Virol. 2016;90(18):8047–58. 34. Yokoyama JS, et al. Association between genetic traits for
immune-medi-ated diseases and Alzheimer disease. JAMA Neurol. 2016;73(6):691–7. 35. Callahan MJ, et al. Increased HLA-DMB expression in the tumor
epithelium is associated with increased CTL infiltration and improved prognosis in advanced-stage serous ovarian cancer. Clin Cancer Res. 2008;14(23):7667–73.
36. Brown PJ, et al. FOXP1 suppresses immune response signatures and MHC class II expression in activated B-cell-like diffuse large B-cell lymphomas. Leukemia. 2016;30(3):605–16.
37. Kongkham PN, et al. An epigenetic genome-wide screen identifies SPINT2 as a novel tumor suppressor gene in pediatric medulloblastoma. Cancer Res. 2008;68(23):9945–53.
38. Roversi FM, Olalla Saad ST, Machado-Neto JA. Serine peptidase inhibitor Kunitz type 2 (SPINT2) in cancer development and progression. Biomed Pharmacother. 2018;101:278–86.
Publisher’s Note