Abstract: Geopolymer concrete has recently emerged as a new eco-friendly green concrete with the potential to replace Portland cement and also utilizes copiously available waste by products that are disposed. Geopolymer concrete is a long chain inorganic molecule, formed by reacting aluminate and silicate minerals with an alkaline activator solution. The geopolymer concrete mix is prepared by using activator solution which depends on molarity of sodium hydroxide concentration. In this research, 10M sodium hydroxide solution along with sodium silicate is employed. The higher demand and scarcity of river sand, due to which various acts and legislation opposing illegal dredging and trading of river sand are framed. The ultimate objective of this research is assessing the strength properties (compressive strength, split tensile strength, and flexural strength) and durability properties (acid attack, sulphate attack, and chloride attack) of geopolymer concrete, with the view on replacing cement and river sand with economic alternative materials. The cement is entirely replaced with fly ash (80%), GGBS (20%) and river sand is partially replaced with foundry sand to produce green concrete.
Index Terms: Alkaline activator solution, Fly ash, Foundry sand, Geopolymer concrete, Ground Granulated Blast Furnace Slag (GGBS).
I. INTRODUCTION
Cement production has reached tremendous development with annual global cement production of about 4.1 billion metric tons in 2017 and expected to increase in upcoming years. Almost 61% of global carbon dioxide (CO2) emissions
are due to industrial activities involving combustion of large amount of carbon intensive fossil fuels for generating power. Cement manufacturing industries produce about 5 to 10% of CO2 on usage of fossil fuel in cement production and also as a
byproduct during the reaction [1,2]. Ordinary Portland Cement (OPC) with its production, emits large amount of CO2
due to calcination of limestone and combustion of fossil fuel coupled with high energy demand. CO2 emission can be
controlled by using green concrete which promotes sustainable and innovative use of waste and unconventional alternative materials with various environmental, technical, and economic benefits [3,4]. This leads to the development of a new ecofriendly binder known as geopolymer.
Geopolymer contains network of inorganic molecules that uses locally available raw materials like fly ash, GGBS, silica fumes etc. activated by an alkaline activator solution and
Revised Manuscript Received on April 06, 2019.
S. Yuvaraj, School of Mechanical and Building sciences, Vellore
Institute of Technology, Chennai (T.N.), India.
S. Elavenil, School of Mechanical and Building sciences, Vellore
Institute of Technology, Chennai (T.N.), India.
made it an alternative versatile material [4,5]. Due to higher demand and scarcity of river sand, foundry sand is used as an alternative to conventional river sand.
Rohit Zende and A. Mamatha studied the mechanical property of geopolymer concrete, replacing fly ash with GGBS cured at ambient temperature. The concentration of sodium hydroxide is taken as 11M and 13M. The alkaline activator solution ratio and alkaline liquid to fly ash ratio is taken as 2.5 and 0.40 respectively. Increase in GGBS content reduced the setting time but increased the strength and degree of workability. The strength also increased with increase in molarity [6]. Since GGBS is finer than fly ash, porosity decreases with increase in GGBS content resulting in denser and homogeneous matrix [7]. Thiruvenkitam Manoharan et al. studied the mechanical, durability and microstructural properties of partially replaced used foundry sand concrete. The proportions considered are 0, 5, 10, 15, 20, and 25%. The strength increased up to 20% replacement and decreased with further addition. Based on microstructural analysis, the strength reduction is due to excess fine particles and insoluble residues. Concrete mix also showed higher durable up to 20% replacement [8]. Rafat Siddique et al. carried out experimental study to evaluate the mechanical properties of concrete partially replaced with 0, 10, 20, and 30% of used foundry sand. Strength increased with increase in percentage of foundry sand and also due to silica content present in foundry sand [9]. Eknath P. Salokhe and D. B. Desai done an experimental investigation to evaluate the comparative study of the properties of fresh and hardened concrete containing ferrous and non-ferrous foundry waste sand as fine aggregate replacement. Ferrous foundry sand gives more strength than non-ferrous foundry sand [10]. Sohail Md et al. made an investigation to study the effect of foundry sand as a fine aggregate replacement, on the mechanical properties. Compressive strength is higher at 50% replacement, split tensile strength increased up to 70% replacement and flexural strength increased up to 50% replacement of fine aggregate [11]. The concrete is denser and impermeable as foundry sand is finer than regular sand and results in lesser porosity content compared to conventional concrete mix. Due to reduced porosity which are filled by foundry sand, results in decreased weight loss. It also showed better durability properties [12-14].
Strength And Durability Properties of
Geopolymer Concrete Using Foundry Sand As a
Partial Replacement
II. MATERIALSANDMETHODOLOGY A.Materials
1. Binders
Binders used are fly ash and ground granulated blast furnace slag (GGBS). In this research, low calcium class F fly ash is used. Both fly ash and GGBS are obtained from local suppliers.
2. Alkaline solution
Sodium hydroxide (NaOH) and sodium silicate (Na2SiO3)
[image:2.595.48.291.303.434.2]provides required alkaline condition for the polymerization chain reaction to occur. Sodium hydroxide generally available in solid pellets, are dissolved in the water 24hrs before specimen preparation. The concentration of sodium hydroxide is determined in terms of Molarity (M), dissolving the required quantity of pellets in one litre of water. Sodium silicate is available in liquid form. The final mixture of sodium hydroxide and sodium silicate was prepared 1hr prior to sample preparation.
Table 1 Physical properties of various materials Description Fly ash GGBS NaOH Na2SiO3
Form Fine
powder
Fine powder
Solid pellets
Viscous liquid Specific
gravity
2.11 2.85 1.46 1.53
Fineness (m2/kg)
301.5 374.0 - -
Bulk density (kg/m3)
1650 1260 3454 5670
3. Fine aggregate
In this research, Fine aggregate used are both river sand and foundry sand. Foundry sand obtained locally is used as partial replacement of regular sand (river sand). The properties of sand are tested in accordance with IS 2386:1963 and IS 383:2016.
4. Coarse aggregate
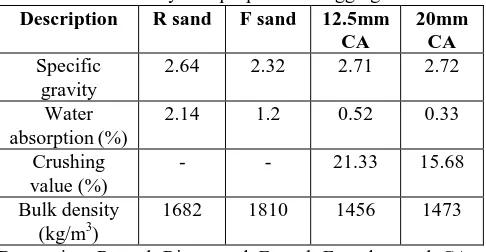
[image:2.595.48.291.565.691.2]Crushed stone of 12.5 and 20mm size are used as coarse aggregate. The aggregate properties are tested in accordance with IS 2386:1963 and IS 383:2016.
Table 2 Physical properties of aggregate Description R sand F sand 12.5mm
CA
20mm CA Specific
gravity
2.64 2.32 2.71 2.72
Water absorption (%)
2.14 1.2 0.52 0.33
Crushing value (%)
- - 21.33 15.68
Bulk density (kg/m3)
1682 1810 1456 1473
Denotation: R sand- River sand, F sand- Foundry sand, CA- Coarse aggregate.
B.Mix design
10M concentration of NaOH was taken for this study. Sodium silicate to sodium hydroxide ratio and alkaline solution to binder ratio is taken as 2.5 and 0.45 respectively.
C.Mix proportions
Generally, four concrete mix proportion are made by replacing river sand with foundry sand by weight in percentages. Reference mix 1 was without foundry sand and in mix 2, mix 3, mix 4, river sand was replaced with 15, 30, and 45% respectively by weight of foundry sand. Cement was fully replaced with 80% fly ash and 20% GGBS.
Table 3 Design mix proportions Materials Mix 1
(kg/m3)
Mix 2 (kg/m3)
Mix 3 (kg/m3)
Mix 4 (kg/m3)
Fly ash 331.03 331.03 331.03 331.03
GGBS 82.76 82.76 82.76 82.76
R sand 630 535.5 441 346.5
F sand - 94.5 189 283.5
12.5mm CA 585 585 585 585
20mm CA 585 585 585 585
NaOH 53.20 53.20 53.20 53.20
Na2SiO3 133.01 133.01 133.01 133.01
D.Specimen preparation
All the specimens are cast and tested as recommended in IS 516:1959. Cubes size of 150mmx150mmx150mm were used for compressive strength test and durability test. Cylindrical specimens of size 100mm diameter and 200mm length were prepared to evaluate the split tensile strength. Beams of size 150mmx150mmx700mm were prepared for determination of flexural strength of concrete. The specimens are cast and kept for ambient curing.
III. RESULTSANDDISCUSION A. Mechanical properties
1. Compressive strength
The cube specimens were tested by placing centrally over the loading plate in Compression Testing Machines (CTM) of capacity 2000KN at loading rate 1.0mm/min. Compressive strength comparison of different mixes at 7 day, 28 day and 56 day is shown in Table 4. Reference mix 1 has higher compressive strength than other mixes. Compressive strength of the specimens increased with ages. At 7 days, all mixes with foundry sand showed the strength lower than reference mix but as the age increases to 56 days the strength is marginally lower than the reference mix. The difference in the strength gain of reference mix is lesser than the other mixes with foundry sand with ages. The reference mix showed increase in strength gain from 7 to 28 days of 21.52%, from 28 to 56 days of 4.31%. The other mixes with foundry sand showed strength gain of 16 – 29% from 7 to 28 days and 27 – 32% from 28 to 56 days. It was observed that the strength gain between 28 and 56 day was more for mix with foundry sand than the mix with no foundry sand. The increase in strength depends on the fact that foundry sand is finer than the river sand, which resulted in denser concrete and also due to silica content present in foundry sand. It was also observed that the strength increased up to certain proportion of foundry sand. In this research, mix with 45%
foundry sand showed
Table 4 Compressive strength comparison of different mixes
Mix 7 day
(N/mm2)
28 day (N/mm2)
56 day (N/mm2)
1 43.96 53.42 55.72
2 30.23 35.35 46.37
3 26.95 33.65 43.98
4 30.30 38.85 49.36
2. Split tensile strength
[image:3.595.299.554.89.776.2]The cylindrical specimens were tested in Compression Testing Machine (CTM) of capacity 2000KN for attaining splitting tensile strength. The specimen was placed between the base plates and uniform load is applied across the longitudinal section of the specimens. Split tensile strength comparison of different mixes at 7 day, 28 day and 56 day is shown in Table 5. The strength gain rate for mix 1, mix 2, mix 3, and mix 4 from 28 day to 56 day was 9.69, 29.71, 26.8, and 24.55% respectively. Similar to compressive strength, the strength gain for mixes with foundry sand is higher than the reference mix with no foundry sand. The mix with 45% foundry sand shows comparatively similar strength to mix with no foundry sand.
Table 5 Split tensile strength comparison of different mixes
Mix 7 day
(N/mm2)
28 day (N/mm2)
56 day (N/mm2)
1 2.28 3.92 4.30
2 2.02 3.13 4.06
3 1.77 2.91 3.69
4 1.85 3.38 4.21
3. Flexural strength
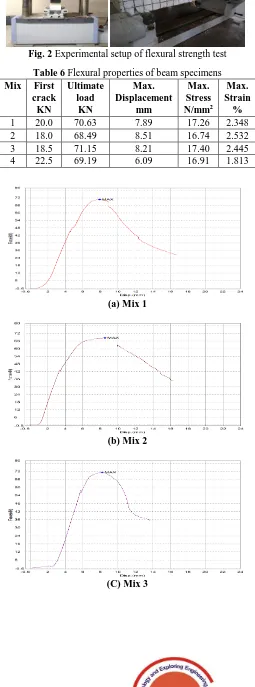
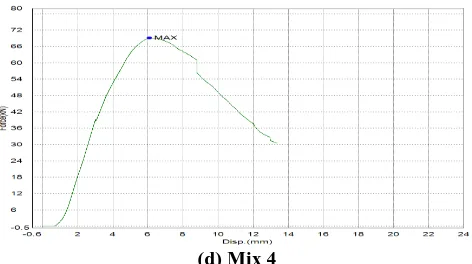
[image:3.595.49.287.343.447.2]The beam specimens were 150mm wide and 150mm deep in cross section with 700mm length. Three-point bend method was adopted to determine the flexural strength of geopolymer concrete mixes. HYSD steel bars of 10mm diameter were used as longitudinal reinforcement. Two legged stirrups of 8mm diameter at 90mm centre to centre spacing were used as shear reinforcement as shown in Fig 1. Flexural properties of beam specimens are shown in Table 6. Force displacement curve of different mixes are shown in Fig 3. Ultimate load for mix 1, mix 2, mix 3 and mix 4 are 70.63, 68.49, 71.15, and 69.19KN respectively. Mix 3 has higher ultimate load capacity, when compared to other mixes. Mix 4 with displacement 6.09mm is lower, when compared to other mix and it also showed lower strain of 1.813%. From this research, mix 4 with 45% foundry sand showed better result than other mixes in flexure.
Fig. 1 Geometry of the specimen (All dimensions are in mm)
Fig. 2 Experimental setup of flexural strength test Table 6 Flexural properties of beam specimens Mix First
crack KN
Ultimate load
KN
Max. Displacement
mm
Max. Stress N/mm2
Max. Strain
%
1 20.0 70.63 7.89 17.26 2.348
2 18.0 68.49 8.51 16.74 2.532
3 18.5 71.15 8.21 17.40 2.445
4 22.5 69.19 6.09 16.91 1.813
(a) Mix 1
(b) Mix 2
[image:3.595.50.289.652.711.2](d) Mix 4
Fig. 3 Force - displacement curve of different mixes B.Durability properties
1. Acid attack test
[image:4.595.305.551.54.186.2]The cube specimen after curing is immersed in water containing 5% of concentrated sulphuric acid by weight. Before immersing in acid, the weight of cube specimens is noted. The pH is maintained throughout the immersion period. After 28, 56, and 90days immersion, the specimens were taken out and dried. Again, the weight of the sample is noted and tested for compressive strength. The resistance to acid attack was found by loss in compressive strength and the weight of the specimen in acid. Acid attack test values of different mixes are shown in Table 7. The strength loss for reference mix 1 at 90 days is 22.78%, but for other mixes strength loss is between 15 – 22% lesser than reference mix. Mix 4 showed lesser weight loss than reference mix with no foundry sand. Mix 4 with 45% foundry sand showed better resistance to acid attack.
Table 7 Acid attack test
Mix
Compressive strength after exposure, N/mm2
Loss in weight %
28 days
56 days
90 days
28 days
56 days
90 days
1 48.33 44.56 41.25 3.37 4.23 6.88
2 31.17 30.23 29.36 2.89 3.14 5.25
3 29.08 27.81 26.23 2.86 3.05 4.83
4 34.89 33.44 32.69 2.73 2.93 4.27
2. Sulphate attack test
Sulphate attack on concrete leads to formation of ettringite that cause crack and scale. Initially the weight of the specimen is noted and immersed in water containing 5% of sodium sulphate by weight of water. The dried weight of the specimens was noted after immersion period and tested. Loss in compressive strength and the loss in weight of the specimen determined the concrete resistance to sulphate attack. Sulphate attack test values of different mixes are shown in Table 8. The reference mix showed strength loss of 11.58% at 90 days but for other mixes strength loss is between 8 – 9.5%. loss in weight decreased with increase in foundry sand. It is observed that mix with 45% foundry sand showed better resistance to sulphate attack.
Table 8 Sulphate attack test
Mix
Compressive strength after exposure, N/mm2
Loss in weight %
28 days
56 days
90 days
28 days
56 days
90 days
1 52.33 49.54 47.23 0.579 1.39 2.95
2 34.22 33.86 32.15 1.152 1.33 2.63
3 32.26 31.95 30.67 1.20 1.28 2.27
4 36.94 36.63 35.24 0.763 0.92 1.82
3. Chloride attack test
[image:4.595.304.551.353.490.2]Chloride attack leads to concrete disintegration and corrosion of reinforcement. After measuring the weight, the cube specimens were immersed in 5% of sodium chloride solution by weight of water. The dried weight of the specimens was noted after immersion period and tested. The resistance against chloride depends on compressive strength and specimen weight loss. Chloride attack test values of different mixes are shown in Table 9. The mix without foundry sand showed 15.16% of strength loss, which is higher than other mixes with foundry sand. Due to denser concrete, mix 4 with 45% foundry sand showed better resistance to chloride.
Table 9 Chloride attack test
Mix
Compressive strength after exposure, N/mm2
Loss in weight %
28 days
56 days
90 days
28 days
56 days
90 days
1 51.23 48.86 45.32 0.83 1.54 3.15
2 34.68 32.52 30.73 0.69 0.93 1.83
3 32.83 30.95 29.38 1.01 1.22 2.48
4 37.97 36.63 34.15 0.81 1.14 2.12
IV. CONCLUSION
This research was conducted to study the influence of used foundry sand as a partial replacement of conventional fine aggregate in geopolymer concrete. Based on results, the following conclusion are drawn.
1. The increase in compressive strength, splitting tensile strength and flexural strength of geopolymer concrete was achieved by replacing 45% of the regular sand with foundry sand.
2. Geopolymer concrete beam with 30% foundry sand showed higher ultimate load capacity, when compared to other mixes.
3. The maximum displacement of geopolymer concrete beam with 45% foundry sand is 6.09mm, lower when compared to other mixes and it also showed lower maximum strain of 1.813%. It was observed that the maximum displacement and maximum strain decreased with increase in foundry sand content.
[image:4.595.45.294.429.562.2]5. Results shows that the foundry sand can be effectively utilized for replacing conventional river sand in geopolymer concrete without affecting the concrete properties.
REFERENCES
1. M. Schneider, M. Romer, M. Tschudin and H. Bolio, ―Sustainable cement production—present and future‖, Cement and Concrete Research 41 (2011) 642–650.
2. Emad Benhelal, Gholamreza Zahedi, Ezzatollah Shamsaei and Alireza Bahadori, ―Global strategies and potentials to curb CO2 emissions in cement industry‖, Journal of Cleaner Production 51 (2013) 142-161. 3. K.M. Liew, A.O. Sojobi and L.W. Zhang, ―Green concrete: Prospects
and challenges‖, Construction and Building Materials 156 (2017) 1063–1095.
4. F.N. Okoye, ―Geopolymer binder: A veritable alternative to Portland cement‖,Materials Today: Proceedings 4 (2017) 5599–5604.
5. Watile. R.K and Mhaisane. R.J, ―Development and application of Geopolymer concrete: A Sustaniable approach‖, International Journal of pure and applied research in Engineering and technology (2015) Volume 3(8): 535- 545.
6. Rohit Zende and Mamatha. A, ―Study on Fly Ash and GGBS Based Geopolymer Concrete under Ambient Curing‖, Journal of Emerging Technologies and Innovative Research (2015), Volume 2, Issue 7, PP: 3082-3087.
7. Mohammad Ali Yazdi, Marco Liebscher, Simone Hempel, Jian Yang and Viktor Mechtcherine, ―Correlation of microstructural and mechanical properties of geopolymers produced from fly ash and slag at room temperature‖, Construction and Building Materials 191 (2018) 330–341.
8. Thiruvenkitam Manoharan, Dhamothiran Laksmanan, Kaliyannan Mylsamy, Pandian Sivakumar and Anirbid Sircar, ―Engineering properties of concrete with partial utilization of used foundry sand‖, Waste Management 71 (2018) 454–460.
9. Rafat Siddique, Geert de Schutter and Albert Noumowe, ―Effect of used-foundry sand on the mechanical properties of concrete‖, Construction and Building Materials 23 (2009) 976–980.
10. Eknath P. Salokhe and D.B. Desai, ―Application of Foundry Waste Sand in Manufacture of Concrete‖, IOSR Journal of Mechanical and Civil Engineering (IOSR-JMCE), PP: 43-48.
11. Sohail Md, Abdul Wahab and Arfath Khan Md, ―A Study on the Mechanical Properties of Concrete by Replacing Sand with Waste Foundry Sand‖, International Journal of Emerging Technology and Advanced Engineering, Volume 3, Issue 11, PP: 83-88.
12. Maria Auxiliadora de Barros Martins, Regina Mambeli Barros, Gilbert Silva and Ivan Felipe Silva dos Santos, ―Study on waste foundry exhaust sand, WFES, as a partial substitute of fine aggregates in conventional concrete‖, Sustainable Cities and Society 45 (2019) 187–196. 13. N. Gurumoorthy and K. Arunachalam, ―Durability Studies on Concrete
Containing Treated Used Foundry Sand‖, Construction and Building Materials 201 (2019) 651–661.
14. Yogesh Aggarwal and Rafat Siddique, ―Microstructure and properties of concrete using bottom ash and waste foundry sand as partial replacement of fine aggregates‖, Construction and Building Materials 54 (2014) 210–223.
AUTHORSPROFILE
S. Yuvaraj, M.Tech Structural Engineering in
Vellore Institute of Technology, Chennai, India. He did his B.E degree in Civil Engineering in 2016 from Sri Sairam Engineering college, Chennai, India.
Dr. S. Elavenil is working as a professor in School of Mechanical and Building Sciences, Vellore Institute of Technology, Chennai, India. She obtained Ph.D. degree in Dynamic response of plates under impact loading in 2006 from Anna University and M.E degree in Structural Engineering in 1994 from NIT Trichy, India. She did B.E degree in Civil Engineering from PSNA college of Engineering, Dindigul, India. She