Open Access
Methodology
Effect of spatial resolution on cluster detection: a simulation study
Al Ozonoff
1,2, Caroline Jeffery
2, Justin Manjourides
2, Laura Forsberg White
1,2and Marcello Pagano*
2Address: 1Department of Biostatistics, Boston University School of Public Health, 715 Albany Street, Boston, MA 02118, USA and 2Department of
Biostatistics, Harvard School of Public Health, 655 Huntington Avenue, Boston, MA 02115, USA
Email: Al Ozonoff - [email protected]; Caroline Jeffery - [email protected]; Justin Manjourides - [email protected]; Laura Forsberg White - [email protected]; Marcello Pagano* - [email protected]
* Corresponding author
Abstract
Background: Aggregation of spatial data is intended to protect privacy, but some effects of aggregation on spatial methods have not yet been quantified.
Methods: We generated 3,000 spatial data sets and evaluated power of detection at 12 different levels of aggregation using the spatial scan statistic implemented in SaTScan v6.0.
Results: Power to detect clusters decreased from nearly 100% when using exact locations to roughly 40% at the coarsest level of spatial resolution.
Conclusion: Aggregation has the potential for obfuscation.
1 Introduction
The Centers for Disease Control and Prevention (CDC) define surveillance to be the ongoing, systematic collec-tion, analysis, interpretacollec-tion, and dissemination of data about a health-related event for use in public health action to reduce morbidity and mortality and to improve health [1]. To control and prevent disease, it is surely important to be vigilant for infectious disease outbreaks or geographic areas of notably high chronic disease inci-dence. Indeed this is a primary aim of public health sur-veillance, and explains in part why surveillance plays an integral role in public health practice [2].
When caring for a single patient, the clinician understand-ably desires as much diagnostic information as possible,
and at the highest possible level of precision. Analo-gously, a public health professional is concerned with diagnosing a public ailment, and should similarly desire all available information with the greatest possible level of precision. Thus it is noteworthy, in the context of public health surveillance, that for reasons of privacy, informa-tion is sometimes destroyed or inteninforma-tionally degraded before being proffered to the analyst.
The argument to protect patient data for reasons of privacy could also be used to shield these data from clinicians. In a clinical setting, we choose not to protect the privacy of the patient by hiding relevant information from the clini-cian, because it is patently silly to do so. However, we often suffer from a similarly framed argument to obscure Published: 27 November 2007
International Journal of Health Geographics 2007, 6:52 doi:10.1186/1476-072X-6-52
Received: 7 August 2007 Accepted: 27 November 2007
This article is available from: http://www.ij-healthgeographics.com/content/6/1/52
© 2007 Ozonoff et al; licensee BioMed Central Ltd.
We argue that one important reason to retain important, specific information such as precise location is that the "requisite" aggregation for privacy necessarily reduces the power available for outbreak detection. To balance the cost of this and other troubles for spatial analysis [3], aggregation does indeed make it more difficult to identify individual patients. This is crucial if the data are made publicly available or if there are other reasons to safeguard privacy, but it also makes an already challenging surveil-lance task even more difficult.
A growing body of literature addresses statistical protec-tion of privacy and its effects on analysis of surveillance data. Cox has written a useful survey of the general prob-lem of confidentiality within small geographic areas, and the impacts of privacy concerns on public health policy and practice [4].
Armstrong et al. thoroughly discuss the design and imple-mentation of several different approaches to protect pri-vacy in the context of spatial analyses [5]. Importantly, methods were evaluated both on the impact on analysis as well as the effectiveness of preserving confidentiality. Yet the restriction of the quantitative assessment to the Cuz-ick-Edwards test statistic [6], which is no longer com-monly used for spatial surveillance [7,8], limits the application of this knowledge to a surveillance setting. Further, data with exact locations were not considered for this evaluation.
Waller and colleagues have written extensively on factors that may influence power of cluster detection methods. For example, they have studied the effects of geographic scale on focused tests of clustering [9,10], and the impor-tance of cluster location amidst a heterogeneous underly-ing population [11]. Notably, this group has investigated more than one statistical method, using several different measures for evaluation. However these studies generally use focused tests of clustering, where a putative exposure source has been identified a priori, whereas surveillance purposes typically require a general test of clustering [12].
Just as we trust clinicians and hospital personnel with sen-sitive and confidential information, so too, one can argue, we should find trustworthy individuals to handle surveil-lance data responsibly.
Informatics-based approaches offer a potential compro-mise to the trade-off between privacy and surveillance utility. For example, development of automated surveil-lance algorithms might allow sensitive data to be analyzed without human intervention [13]. But in order to evaluate
We reported briefly [14] that there is an undesirable loss of power to detect disease outbreaks when the spatial information provided is degraded from a continuous scale of measurement to a coarser, aggregate level. For example, often only a patient's ZIP code is available to a surveil-lance system, instead of the patient's listed residential address. Similar results have appeared in contemporane-ous work [15], and a recent paper by the same group fur-ther confirms this basic premise [16]. However, those studies focused solely on exact locations compared to a single level of aggregation.
In our present work, we add to these previous results by considering multiple levels of aggregation. Using syn-thetic data, we systematically quantify the loss of cluster detection performance as a function of spatial resolution, while limiting confounding influences from a variety of complex factors that affect spatial analyses. We may inter-pret these results relative to geographic scales we might encounter while surveilling a large metropolitan city. In this way, we attempt to clarify the price one pays for aggre-gation, and in turn to better inform future policy decision-makers.
2 Methods
2.1 Data
We designed a simulation study to determine the effect of spatial aggregation on power to detect spatial clusters. Random samples of size 90 were drawn from an underly-ing uniform distribution on the unit disk (i.e. the Eucli-dean circle of radius one). Atop this background sample, we then superimpose a simulated cluster consisting of 10 points uniformly distributed in a small square at a loca-tion randomly determined for each simulated data set (Figure 1). Thus each simulated data set consists of a total sample of 100 points. Although the clusters are not defined by circles, for ease of discussion we speak of a cluster "radius" to mean the radius of the circle inscribed within the square cluster boundary. In the occasional instance where the cluster center falls within one radius of the unit disk boundary, we require that all 10 cluster points lay within the intersection of the cluster boundary and the unit disk.
gener-ate 1, 000 data sets under these conditions, or a total of 3, 000 data sets for the entire simulation study.
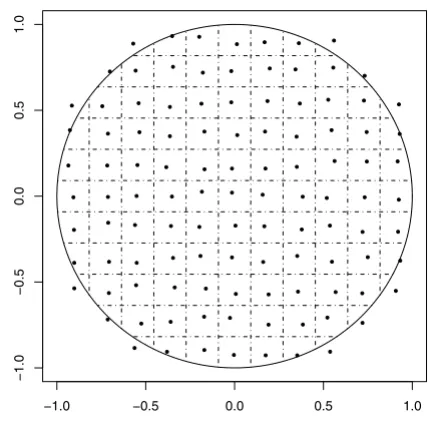
To simulate spatial aggregation at different geographic scales, we use a sequence of 12 uniform grids of varying spacing, superimposed on the unit disk. The levels of aggregation are chosen according to their corresponding grid spacing, ranging from 15 grid squares per side (length of grid square 0.067) to four grid squares per side (length of grid square 0.25). Throughout, we use the average dis-tance between grid points (equivalently, the average diameter of an aggregation region) as an index of the level of spatial aggregation (Figure 2).
By assigning all simulated data points to the nearest grid point, these grids thereby define spatial regions of aggre-gation. Prior to analysis, we modified each grid by adding small amounts of bivariate jitter to each grid point (i.e. region center). Our purpose was to mitigate the high degree of spatial regularity across a uniform grid of assign-ment points, and in part to reflect the non-uniform nature of administrative regions as they appear in real systems. We note however that the use of a uniform population distribution implies constant population densities across
administrative region, something unlikely to be seen in a real system.
2.2 Statistical analysis
We use SaTScan version 6.0 (2005) with a purely spatial Bernoulli model, with cluster size constrained to be no greater than 25% of the population. Statistical signifi-cance of spatial clusters is determined using a nominal Type I error rate of 0.05.
Our primary outcome is the proportion of simulated data sets, under each level of aggregation, for which SaTScan accurately detects the simulated cluster. We denote this proportion as the power to detect clusters. In order to ensure that the cluster detected by SaTScan is sufficiently close in space to the true cluster location, we record a detection as successful if and only if the identified cluster center is within one cluster radius of the true cluster center. We also record the proportion of false detections, defined as any cluster identification with center more than one cluster radius from the true cluster center, or failure of any identified cluster to achieve significance level (i.e. p-value) below 0.05.
Illustration of spatial aggregation
Figure 2
Illustration of spatial aggregation. One of 12 levels of spatial aggregation used in this study. Grid lines define spatial regions of aggregation, and representative points are chosen randomly within each region. All simulated points are reas-signed to the representative point of the appropriate region.
−1.0 −0.5 0.0 0.5 1.0
−1.0
−0.5
0.0
0.5
1.0
Illustration of a simulated cluster
Figure 1
Illustration of a simulated cluster. 90 points were dis-tributed uniformly on the unit circle, and 10 additional "out-break" points form the square "cluster" left of center.
−1.0 −0.5 0.0 0.5 1.0
−1.0
−0.5
0.0
0.5
Within each simulated data set, there were 10 points of 100 that comprised the simulated cluster. For these "clus-ter points", we calculate the proportion correctly included in a SaTScan-identified cluster with p-value below 0.05. Similarly for the remaining 90 "non-cluster points", we calculate the proportion incorrectly included in a statisti-cally significant SaTScan-identified cluster. These propor-tions are analogous to traditional definipropor-tions of sensitivity and 1 minus specificity, respectively, where we compare the classification via SaTScan of points involved in a clus-ter to the "gold standard" of clusclus-ter status as declus-termined by simulation design.
3 Results
Figures 3 through 6 illustrates our results. For all three sets of simulations, power decreases as the size of aggregation regions increases. These simulated clusters are sufficiently large so that the power to detect for all three cluster radii is nearly 100% when exact locations are used; this decreases to roughly 40% at the coarsest level of
aggrega-Using exact locations, the false detection rate is approxi-mately 2%. In the presence of any level of aggregation, the false detection rate increases to nearly 20% or higher in all of our simulations (Figure 4). This rate appears to increase slowly for greater levels of aggregation.
We further evaluate the effect of aggregation on the sensi-tivity and specificity of SaTScan (Figures 5 and 6). While performance is nearly ideal when using exact locations, the proportion of false negatives rises to almost 50% at the coarsest level of aggregation. In concordance with our earlier results, sensitivity tends to decrease as spatial aggre-gation increases, while the false positive fraction (1 minus specificity) follows an inverse and nearly monotonic asso-ciation.
4 Discussion
Our results are noteworthy for a number of reasons. First, we have used more than two levels of aggregation in an effort to estimate the incremental effect of this aggregation on the power of cluster detection. Second, we have further
Effect of aggregation on power
Figure 3
Effect of aggregation on false detection rate
Figure 4
Effect of aggregation on false detection rate. Vertical axis denotes proportion of simulations where spurious clusters are detected.
Effect of aggregation on sensitivity
Figure 5
investigated the effect of aggregation on the rate of false detection. Finally, when viewed in the context of similar studies, our results add to a body of evidence that the underlying relationships reported appear robust to differ-ing geographies and population distributions.
Our calculation of power and false detection differs from the same measures as otherwise used in an important way. We expect a certain proportion of spurious "clusters" to arise by chance alone. Thus we have placed an additional requirement on what we denote a successful identification of a cluster, namely that the identified cluster be proximal to the true cluster as determined by the simulation design. Because our simulations involve only one cluster per data set, an identification far from the true cluster is genuinely spurious and must be considered a false detection in this context. Indeed, for practical purposes such an identifica-tion might divert resources for investigaidentifica-tion to a geo-graphic area not related to the true outbreak or cluster present in the data.
To place our results in context, consider the metropolitan Boston area. The city and adjacent suburbs can be enclosed in a circle of radius roughly 7, 500 meters. Although the size of city ZIP codes and census tracts
var-ies, an approximate median radius for Boston ZIP codes is roughly 1, 500 meters, or 20% of the region radius. Bos-ton census tracts have an approximate median radius of 500 meters, or 6.7% of the region radius. Thus census tract and ZIP code aggregation of Boston data corresponds roughly to our first and penultimate levels of aggregation respectively. Likewise, the simulated clusters of radii 0.025, 0.05, and 0.10 correspond to disease outbreaks smaller than one census tract, about one census tract, or several census tracts (perhaps a small ZIP code) respec-tively.
The number of false detections rose well above the nomi-nal alpha level when spatial data were aggregated. Inter-estingly, the level of aggregation does not appear to be a major contributor to false alarms; rather, there is an immediate increase upon aggregation above the nominal false alarm rate, with little additional increase for further aggregation. To our knowledge, this has not been reported previously. Since false alarms form a major limitation to the actionable consequences of cluster detection, this issue should be considered carefully. Even in situations where loss of power is not severe, the increase in false detection rates may impose further limits of the utility of spatial methods when using aggregated data.
Effect of aggregation on specificity
Figure 6
Publish with BioMed Central and every scientist can read your work free of charge "BioMed Central will be the most significant development for disseminating the results of biomedical researc h in our lifetime."
Sir Paul Nurse, Cancer Research UK
Your research papers will be:
available free of charge to the entire biomedical community
peer reviewed and published immediately upon acceptance
cited in PubMed and archived on PubMed Central
yours — you keep the copyright
Submit your manuscript here:
http://www.biomedcentral.com/info/publishing_adv.asp
BioMedcentral
Our study is limited in several ways. We have only included an evaluation of SaTScan as a test of clustering, although we have seen similar results using other meth-ods [14]. The use of synthetic data is both helpful and harmful to generalizability of results. There are few popu-lations that even approximate a homogeneous and uni-form distribution, and thus the simulated data sets do not reflect a realistic surveillance scenario. However, using a homogeneous distribution removes some of the poten-tially confounding interactions between cluster location, geography, population distribution, and spatial methods. Thus despite its limitations, our study contributes to an understanding of the complex association between spatial resolution and power of detection.
We chose not to investigate spatio-temporal methods (implemented for example with a space-time scan, also available using SaTScan). Space-time interactions imply greater complexity when considering effects of spatial aggregation (or indeed, temporal aggregation), and the potential parameter space of simulation studies increases greatly as well. For this and other reasons, the effect of spa-tial aggregation (or indeed, temporal aggregation) in a cluster detection context remains an area for further inves-tigation.
Competing interests
The author(s) declare that they have no competing inter-ests.
Authors' contributions
AO and MP conceived of the study, participated in the design, and drafted the manuscript. AO, CJ, and JM were responsible for statistical programming and data analysis. All authors read and approved the final manuscripts.
Acknowledgements
Research partially supported by NIH grants AI51164 and R01-EB006195.
References
1. Teutsch SM, Churchill RE: Principles and Practice of Public Health Surveil-lance Oxford Univ Press; 2000.
2. Brookmeyer R, Stroup D, Eds: Monitoring the Health of Populations: Sta-tistical principles and methods for public health surveillance Oxford Univ Press; 2004.
3. Grubesic TH, Matisziw TC: On the use of ZIP codes and ZIP code tabulation areas (ZCTAs) for the spatial analysis of epi-demiological data. Int J Health Geogr 2006, 5(58):.
4. Cox L: Protecting confidentiality in small population health and environmental statistics. Statistics in Medicine 1996,
15:1895-1905.
5. Armstrong M, Rushton G, Zimmerman D: Geographically mask-ing health data to preserve confidentiality. Statistics in Medicine
1999, 18:497-525.
6. Cuzick J, Edwards R: Spatial clustering for inhomogeneous pop-ulations. J Royal Statist Soc B 1990, 52:73-104.
7. Waller L, Gotway C: Applied Spatial Statistics for Public Health Data
Wiley; 2004.
8. Lawson A: Statistical Methods in Spatial Epidemiology 2nd edition. Wiley; 2006.
9. Waller L, Lawson A: The power of focused tests to detect dis-ease clustering. Statistics in Medicine 1995, 14:2291-2308. 10. Waller L: Statistical power and design of focused clustering
studies. Statistics in Medicine 1996, 15:765-782.
11. Waller L, Hill E, Rudd R: The geography of power: Statistical performance of tests of clusters and clustering in heteroge-neous populations. Statistics in Medicine 2006, 25:853-865. 12. Lawson A, Kleinman K, Eds: Spatial and Syndromic Surveillance for Public
Health Wiley; 2005.
13. Boulos M, Cai Q, Padget J, Rushton G: Using software agents to preserve individual health data confidentiality in micro-scale geographic analyses. Journal of Biomedical Informatics 2006,
39:160-170.
14. Jeffery C, Ozonoff A, Forsberg L, Nuno M, Pagano M: The cost of obfuscation when reporting locations of cases in syndromic surveillance systems. Advances in Disease Surveillance 2006, 1:36. 15. Cassa C, Grannis S, Overhage J, Mandl K: A novel,
context-sensi-tive approach to anonymizing spatial surveillance data: impact on outbreak detection. Advances in Disease Surveillance
2006, 1:10.
16. Olson K, Grannis S, Mandl K: Privacy protection versus cluster detection in spatial epidemiology. Am J Public Health 2006,