R E S E A R C H A R T I C L E
Open Access
Accuracy of iohexol plasma clearance for
GFR-determination: a comparison between
single and dual sampling
Yong Zhang
1, Zhun Sui
1, Ze Yu
2, Tai Feng Li
2, Wan Yu Feng
2and Li Zuo
1*Abstract
Background:Current guidelines regarding plasma-sampling techniques for glomerular filtration rate (GFR) determination are inconsistent. Single-sample methods are commonly believed not to be precise enough to meet clinical demands. The present study compared the agreement between single- and dual- plasma sampling methods with a three-point plasma clearance of iohexol.
Methods:A total of 46 healthy volunteers and 124 chronic kidney disease (CKD) patients with varying degrees of renal dysfunction received 5 ml iohexol (300 mgI/ml) i.v. and plasma samples were drawn at 2-, 3- and 4-h post-injection. Plasma-iodine concentrations were detected by high-performance liquid chromatography (HPLC).
Results: Bias was similar among single-plasma sampling methods (SPSM) and dual-plasma sampling methods
(DPSM). The best correlation was obtained from the 2- and 4-h DPSM (concordance correlation coefficient [CCC]: 0.9988) with none of the estimates differed by more than 30% from the reference GFR and only one (0.06%) estimate differed by more than 10% (P30, 100%; P10, 99.4%). SPSM using samples around 3- or 4-h demonstrated acceptable accuracy at a GFR level of ≥60 ml/min/1.73m2 (P30= 100% and P10> 75% for both measurements).
Conclusion: 4-h SPSM is advantageous in clinical practice in subjects with GFR≥60 ml/min/1.73m2. For patients with an expected GFR < 60 ml/min/1.73m2, a prolonged sampling time is more reliable.
Keywords:Glomerular filtration rate, Plasma clearance, Iohexol, Single sample, Slope-intercept
Background
Calculated plasma clearance of iohexol after a single bolus injection correlates well with the“gold standard of renal function”inulin clearance and is recommended as a robust standard for evaluating renal function [1–3]. The mathematical model for the drug elimination curve is an open two-compartment system. The exogenous tracer for glomerular filtration rate (GFR) measurement is injected in the first compartment, equilibrates with the second compartment, and is excreted from the first compartment by glomerular filtration [4]. However, mul-tiple blood samples beyond 6 h post-injection are needed to calculate the area under the time-concentration curve
(AUC), if maximal precision and accuracy of the mea-surements are sought [5, 6], which would be rather time-consuming and therefore compromise recruitment and subject compliance. A growing need for simplifica-tion has led to the applicasimplifica-tion of single-compartment models that need only two to three blood samples, which calculate AUC from the intercept and slope of the final slow disappearance curve. By the two-compartment correction introduced by Brochner-Mortensen [7], the slope-intercept method provides greater simplicity and sufficient accuracy to meet clinical demands.
Further simplified techniques requiring only one blood sample have also been developed [8–14]. Single-plasma sampling methods (SPSM) demonstrate acceptable ac-curacy, given that the single sample is drawn at a proper time point and there is knowledge about the distribution volume of the injected tracer. However, this method * Correspondence:[email protected]
1Department of Nephrology, Peking University People’s Hospital, No. 11
Xizhimen South Street, Xi Cheng District, Beijing 100044, China Full list of author information is available at the end of the article
lacks the opportunity for quality control and has been reported inferior to dual-plasma sampling methods (DPSM) [9,15–18].
In the present study, we compared the clearance values based on DPSM and SPSM with a three-point plasma clearance of iohexol (3 pt. iGFR), to specify whether 3 pt. iGFR measurement can be substituted by DPSM or SPSM, or which estimate is more adequate to be recommended in routine practice.
Methods
A total of 170 participants (89 females, 52.4%) includ-ing 46 healthy volunteers and 124 CKD patients with varying degrees of renal dysfunction were recruited in this study. Mean age was 43 years (range 21–87 years). The mean body-mass index and body-surface area were 24.2 ± 4.0 kg/m2 and 1.74 ± 0.2 m2 respectively. Mean serum-creatinine was 111.3 μmol/l (range 37.1– 797.4 μmol/l). A large proportion of the studied patients were diagnosed with diabetes (14.1%) or hypertension (35.9%).
The participants were examined in a non-fasting state. Baseline blood sample was obtained at test day. A single bolus injection of 5 ml iohexol (Omnipaque, 300 mgI/ ml, GE healthcare, Shanghai, China) was given at one side of the upper limb peripheral vein and then blood sample was drawn from the contralateral arm at 2 h, 3 h and 4 h after injection. Plasma-iodine concentrations were detected by high-performance liquid chromatog-raphy (Waters Alliance HPLC, Milford, USA).
The protocol was approved by the local ethics com-mittee. All volunteers were informed and signed the consent form.
Dual- and multi-sample methods (Clslope)
Based on the one-compartment model, plasma clearance of iohexol was calculated using the slope and the inter-cept of the regression equation in the final slow clearance.
Clslope¼Q0=C1=b
whereQ0is the total injected amount of tracer (mg),C1 and b are the intercept and the slope of the linear re-gression equation between plasma concentration and time (t), respectively.
The area under the curve (C1/b) calculated by this algorithm was underestimated; therefore, the calcu-lated clearance value was corrected by the Brochner-Mor-tensen’s formula and standardized for a body-surface area (BSA) of 1.73 m2(the Haycock’s formula) to derive the final GFR [7,19].
Single-sample method (Clss)
The formula described by Jacobsson [8] was based on corrections for non-immediate mixing and non-uniform distribution of the tracer. The distribution volume was calculated as a function of the body weight.
Clss¼ 1
t=Vþ0:0016 ln Q0
VCt
whereQ0is the total injected amount of tracer (mg),tis the time interval between injection and sampling (min),
Ct is the iodine concentration in the plasma sample taken at the time (t), andVis the calculated distribution volume (ml) of the participant. The clearance values were adjusted to 1.73 m2body surface.
The reference values of GFR were measured as the 2-, 3- and 4-h three-point plasma clearance of iohexol stan-dardized to 1.73 m2 BSA (3 pt. iGFR), as described
above, also denoted as mGFR (measured GFR).
DPSM-GFR and SPSM-GFR were expressed as GFRixor GFRi,iandximpliy the sampling time (hr) of the blood used to calculate the corresponding plasma clearance of iohexol. For example, DPSM-GFR determined by the 2-and 3-h samples was denoted as GFR23, 2-and SPSM-GFR determined by the single 2-h sample was denoted as GFR2, and so on.
Statistical analysis
Baseline characteristics are presented as the mean ± SD for continuous variables and as n (%) for categorical variables.
Taking 3 pt. iGFR as the reference standard (mGFR), bias was assessed as the median difference and precision was assessed as the interquartile range (IQR) for the difference. Accuracy was assessed as the percentage of estimates that differed within 30 and 10% of the mGFR (i.e. P30and P10). Agreement between GFRixand mGFR was reported according to Lin’s concordance correlation coefficient (CCC) [20]. Moreover, the agreement be-tween different methods was evaluated graphically by plotting the ratios of GFRix/mGFR against mGFR ac-cording to Bland and Altman [21].
Results
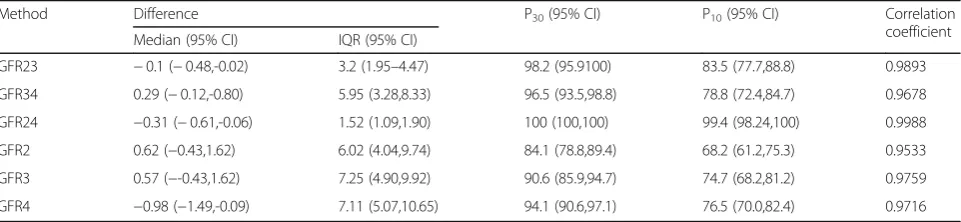
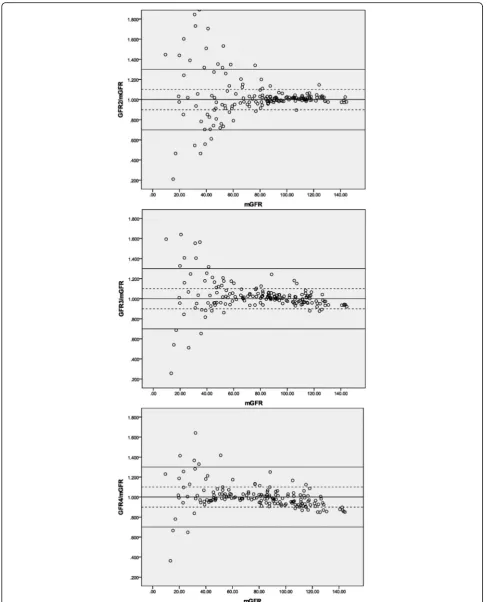
The detailed results of each different sampling method with individual correlations against mGFR are shown in Table 1. Overall, the best correlation from the analyses carried out was obtained from GFR24, the 2- and 4-h blood sampling, with a CCC of 0.9988, which indicates almost perfect agreement with the 3 pt. iGFR. Moreover, GFR24 showed the best accuracy: none of the estimates differed by more than 30% from the mGFR and only one (0.06%) estimate differed by more than 10% (P30, 100%; P10, 99.4%). Bias was very low and similar among DPSM-GFRs and SPSM-GFRs, while the precision of GFR24 was significantly better with an IQR of the differ-ence of 1.52 ml/min/1.73m2.
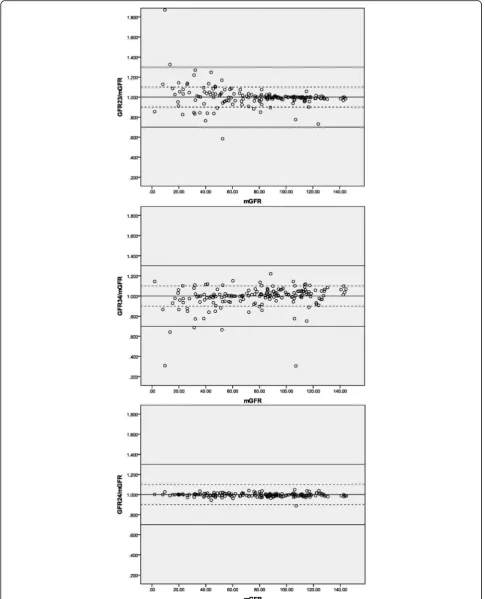
The agreement of each sampling method predicting mGFR is graphically illustrated in Figs.1and2, with the solid lines and the dashed lines delineating the boundar-ies defined by P30 and P10, respectively. The percentage difference of GFR24 from the mGFR was fairly stable throughout the whole range of measured GFR. With respect to the other methods, the dots become in-creasingly scattered as GFR decreases, especially the SPSM-GFRs at a GFR level of < 60 ml/min/1.73m2.
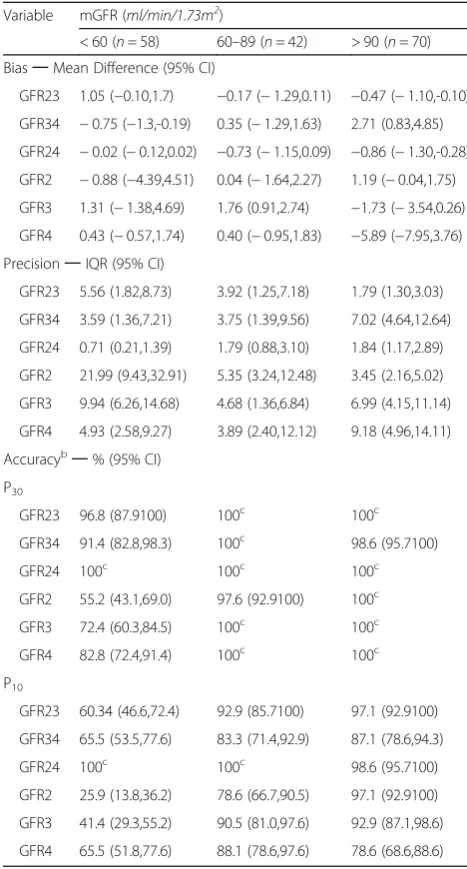
Table 2 shows the performance of the DPSM-GFRs and SPSM-GFRs at different measured GFR levels. Gen-erally, the correlation metrics were not significantly dif-ferent between DPSM and SPSM when GFR was above 60 ml/min/1.73m2. However, SPSM showed noticeably imprecise and poor accuracy compared to DPSM in the GFR < 60 ml/min/1.73m2subgroup.
Discussion
In this paper, we have presented a comparison of 2 com-monly used plasma sampling methods for GFR measure-ments: single- and dual-plasma sampling method. The data demonstrated well that DPSM using blood samples drawn at 2- and 4-h post-injection obtained the best cor-relation in terms of both precision and accuracy.
These results were highly consistent with the early study done by Waller DG [15], who compared alternative
methods including SPSM, DPSM and external detector clearance rate using 2–5 h samples. The 2- and 4-h blood sampling correlates excellently with multiple-point plasma clearance (r= 0.996) with a standard error of 2.8 ml/min/1.73m2. Similar results were found by Russell et al. [22], who compared the DPSM tech-nique with a two-compartment GFR assessment.
In fact, the BNMS guidelines [23] recommend a slope-intercept method requiring between two and four samples in the conclusion that“the majority of literature suggests that the single-sample method is less precise than the slope-intercept technique.” On the other hand, the plasma clearance measurement recommended by the current international guidelines [24] is the single-sample technique for clinical measurement of GFR in patients with GFR≥30 ml/min/1.73m2 based on the Groth 4-h methodology [10]. However, both of the guidelines were written decades ago.
It should be noted from Table 1 that all the studied methods had a low bias and yielded optimal agreement with the 3 pt. iGFR, while the performance in precision and accuracy varied substantially regarding a certain method or GFR level (Table2). This is partially because positive errors and negative errors cancel each other out, and thus blunt the real deviation. This phenomenon can be even more obviously observed at a lower GFR level and SPSM using a too-early sample (2-h SPSM, see Fig. 2). The explanation for this is well documented in the literature [4, 25, 26]: a terminal monoexponential clearance is not reached even at 4 h and therefore some AUC is missing from the calculation, causing the GFR to be overestimated [27]. However, DPSM suffers from the same deficiency rooted in the mono-compartment model, which results in a tendency towards overesti-mation when GFR was low and the opposite when GFR was high [28].
Prolongation of the sampling time is the main strategy for avoiding this error, which is crucial in SPSM. Indeed, in our study, by using a later blood sampling (4 h), the precision of SPSM was greatly improved as the IQR of
Table 1Summary of results of correlations between different sampling methods and three-point plasma clearance of iohexol
Method Difference P30(95% CI) P10(95% CI) Correlation
coefficient
Median (95% CI) IQR (95% CI)
GFR23 −0.1 (−0.48,-0.02) 3.2 (1.95–4.47) 98.2 (95.9100) 83.5 (77.7,88.8) 0.9893
GFR34 0.29 (−0.12,-0.80) 5.95 (3.28,8.33) 96.5 (93.5,98.8) 78.8 (72.4,84.7) 0.9678
GFR24 −0.31 (−0.61,-0.06) 1.52 (1.09,1.90) 100 (100,100) 99.4 (98.24,100) 0.9988
GFR2 0.62 (−0.43,1.62) 6.02 (4.04,9.74) 84.1 (78.8,89.4) 68.2 (61.2,75.3) 0.9533
GFR3 0.57 (−-0.43,1.62) 7.25 (4.90,9.92) 90.6 (85.9,94.7) 74.7 (68.2,81.2) 0.9759
GFR4 −0.98 (−1.49,-0.09) 7.11 (5.07,10.65) 94.1 (90.6,97.1) 76.5 (70.0,82.4) 0.9716
The difference is calculated as GFRix-mGFR,iandximplies the sampling time (hr) of the blood used to calculate the corresponding plasma clearance, mGFR is defined as the three-point (2-, 3- and 4-h) plasma clearance of iohexol standardized to body-surface area (3 pt. iGFR). P30and P10indicates the percentage of
Fig. 1Agreement between DPSM and three-point plasma clearance.Notes: The solid lines and the dashed lines delineate the boundaries defined by P30and P10, respectively. GFRix: the corresponding DPSM-GFR determined by two samples drawn at the time i and x (hr) after injection. mGFR: the
Fig. 2Agreement between SPSM and three-point plasma clearance.Notes: The solid lines and the dashed lines delineate the boundaries defined by P30and P10, respectively. GFRi: the corresponding SPSM-GFR determined by single sample drawn at the time i (hr) after injection. mGFR: the
the difference decreased from 21.99 to 4.93 ml/min/ 1.73m2, while the accuracy within P30 increased from 55.2 to 82.8%. Conventional practice to choose proper sampling time is based on the expected GFR before test-ing. Jacobsson calculated the optimal sampling time for clearance values around 100 ml/min to be 3 h and for clearance values around 30 ml/min to be 10 h [8]. For severe renal dysfunction (expected GFR < 15 ml/min/ 1.73m2), a blood sample drawing at 24 h is suggested [24]. Recently, a systematic review [27] compared SPSM
results with a gold standard nine-point AUC measure-ment of GFR as well as slope-intercept methods (includ-ing the 2-, 3- and 4-h three-point plasma clearance and the 2- and 3-h DPSM) for 412 published GFR studies and concluded that the method described by Fleming [14] is the best SPSM and provides equivalent accuracy and precision to the slope-intercept-GFR.
The limitation of this study is that we lack data beyond 4 h, which will result in slightly overestimation of the GFR, as discussed above. Schwartz et al. [4] examined the plasma disappearance curve of iohexol in 27 children to determine the degree of overestimation in GFR due to shortening sampling time from 6 to 5 and 4 h. Accord-ing to the multi-point AUC measurement, the authors found a significant 3% overestimation if sampling time was truncated at 4 h post-injection. However, the differ-ences did not become much larger when only lower GFR values were examined and a 3% overestimation is probably clinically irrelevant as discussed by the authors. Moreover, it was demonstrated in their work that the area under the slow curve of the 4 h study was not significantly different from 6 h, which is to say, the AUC used to calculate DPSM-GFR was not significantly differ-ent between 4- and 6-h.
Conclusions
In conclusion, clearance values based upon three-point plasma samples can be substituted by 2- and 4-h DPSM. When GFR was ≥60 ml/min/1.73m2, 4-h SPSM demon-strated approximate accuracy and thus can be recom-mended for clinical measurement of GFR. For patients with expected GFR < 60 ml/min/1.73m2, a prolonged sampling time is more reliable.
Abbreviations
3 pt iGFR:The 2-, 3- and 4-h 3-point plasma clearance of iohexol; AUC: Area under the curve; BNMS: British Nuclear Medicine Society; BSA: Body-surface area; CCC: Concordance correlation coefficient; CI: Confidence interval; CKD: Chronic kidney disease; DPSM: Dual-plasma sampling methods; GFR: Glomerular filtration rate; HPLC: High-performance liquid chromatography; IQR: Interquartile range; mGFR: Measured glomerular filtration rate; SPSM: Single-plasma sampling methods
Availability of data and materials
The datasets generated and/or analyzed during the current study are available upon request from the corresponding author.
Authors’contributions
Research idea and study design: ZS and LZ; blood sampling and HPLC essay: YZ, ZY, TFL and WYF; data acquisition/statistical analysis: YZ and ZS; supervision or mentorship: WYF and LZ. YZ is a major contributor in writing the manuscript, and ZS critically revised the manuscript and added some important intellectual content, the two authors contributed equally to this work. All authors read and approved the final manuscript.
Ethics approval and consent to participate
This is a cross-sectional study conducted at the Peking University People’s Hospital (PUPH) from Oct 2015 to Feb 2017 and approved by the PUPH ethics committee (2014PHB098–01). All volunteers were informed and signed the consent form.
Table 2Performance of dual- and single- sampling methods at different GFR levelsa
Variable mGFR (ml/min/1.73m2)
< 60 (n= 58) 60–89 (n= 42) > 90 (n= 70) Bias─Mean Difference (95% CI)
GFR23 1.05 (−0.10,1.7) −0.17 (−1.29,0.11) −0.47 (−1.10,-0.10)
GFR34 −0.75 (−1.3,-0.19) 0.35 (−1.29,1.63) 2.71 (0.83,4.85)
GFR24 −0.02 (−0.12,0.02) −0.73 (−1.15,0.09) −0.86 (−1.30,-0.28)
GFR2 −0.88 (−4.39,4.51) 0.04 (−1.64,2.27) 1.19 (−0.04,1.75)
GFR3 1.31 (−1.38,4.69) 1.76 (0.91,2.74) −1.73 (−3.54,0.26)
GFR4 0.43 (−0.57,1.74) 0.40 (−0.95,1.83) −5.89 (−7.95,3.76)
Precision─IQR (95% CI)
GFR23 5.56 (1.82,8.73) 3.92 (1.25,7.18) 1.79 (1.30,3.03)
GFR34 3.59 (1.36,7.21) 3.75 (1.39,9.56) 7.02 (4.64,12.64)
GFR24 0.71 (0.21,1.39) 1.79 (0.88,3.10) 1.84 (1.17,2.89)
GFR2 21.99 (9.43,32.91) 5.35 (3.24,12.48) 3.45 (2.16,5.02)
GFR3 9.94 (6.26,14.68) 4.68 (1.36,6.84) 6.99 (4.15,11.14)
GFR4 4.93 (2.58,9.27) 3.89 (2.40,12.12) 9.18 (4.96,14.11)
Accuracyb─% (95% CI)
P30
GFR23 96.8 (87.9100) 100c 100c
GFR34 91.4 (82.8,98.3) 100c 98.6 (95.7100)
GFR24 100c 100c 100c
GFR2 55.2 (43.1,69.0) 97.6 (92.9100) 100c
GFR3 72.4 (60.3,84.5) 100c 100c
GFR4 82.8 (72.4,91.4) 100c 100c
P10
GFR23 60.34 (46.6,72.4) 92.9 (85.7100) 97.1 (92.9100)
GFR34 65.5 (53.5,77.6) 83.3 (71.4,92.9) 87.1 (78.6,94.3)
GFR24 100c 100c 98.6 (95.7100)
GFR2 25.9 (13.8,36.2) 78.6 (66.7,90.5) 97.1 (92.9100)
GFR3 41.4 (29.3,55.2) 90.5 (81.0,97.6) 92.9 (87.1,98.6)
GFR4 65.5 (51.8,77.6) 88.1 (78.6,97.6) 78.6 (68.6,88.6) a
GFRixor GFRi:iandximplies the sampling time (hr) of the blood used to calculate the corresponding plasma clearance of iohexol. Units are inml/min/1.73m2 b
Accuracy was calculated as the percentage of estimate within 30% of the measured GFR (P30) and the percentage of estimate within 10% of the measured
GFR (P10) c
Consent for publication Not applicable
Competing interests
The authors declare that they have no competing interests.
Publisher’s Note
Springer Nature remains neutral with regard to jurisdictional claims in published maps and institutional affiliations.
Author details
1Department of Nephrology, Peking University People’s Hospital, No. 11
Xizhimen South Street, Xi Cheng District, Beijing 100044, China.2Department
of Pharmacy, Peking University People’s Hospital, No. 11 Xizhimen South Street, Xi Cheng District, Beijing, China.
Received: 19 February 2018 Accepted: 26 June 2018
References
1. Brown SC, O'Reilly PH. Iohexol clearance for the determination of glomerular filtration rate in clinical practice: evidence for a new gold standard. J Urol. 1991;146(3):675–9.
2. Stevens LA, Levey AS. Measured GFR as a confirmatory test for estimated GFR. J Am Soc Nephrol. 2009;20(11):2305–13.
3. Soveri I, Berg UB, Björk J, et al. Measuring GFR: a systematic review. Am J Kidney Dis. 2014;64(3):411–24.
4. Schwartz GJ, Abraham AG, Furth SL, Warady BA, Muñoz A. Optimizing iohexol plasma disappearance curves to measure the glomerular filtration rate in children with chronic kidney disease. Kidney Int. 2010;77(1):65–71. 5. Frennby B, Sterner G, Almén T, Hagstam KE, Hultberg B, Jacobsson L. The use of iohexol clearance to determine GFR in patients with severe chronic renal failure–a comparison between different clearance techniques. Clin Nephrol. 1995;43(1):35–46.
6. Sterner G, Frennby B, Hultberg B, Almen T. Iohexol clearance for GFR-determination in renal failure–single or multiple plasma sampling. Nephrol Dial Transplant. 1996;11(3):521–5.
7. Bröchner-Mortensen J. A simple method for the determination of glomerular filtration rate. Scand J Clin Lab Invest. 1972;30(3):271–4.
8. Jacobsson L. A method for the calculation of renal clearance based on a single plasma sample. Clin Physiol. 1983;3(4):297–305.
9. Russell CD, Bischoff PG, Kontzen FN, et al. Measurement of glomerular filtration rate: single injection plasma clearance method without urine collection. J Nucl Med. 1985;26(11):1243–7.
10. Christensen AB, Groth S. Determination of 99mTc-DTPA clearance by a single plasma sample method. Clin Physiol. 1986;6(6):579–88.
11. Watson WS. A simple method of estimating glomerular filtration rate. Eur J Nucl Med. 1992;19(9):827.
12. Itoh K, Tsushima S, Tsukamoto E, Tamaki N. Reappraisal of single-sample and gamma camera methods for determination of the glomerular filtration rate with 99mTc-DTPA. Ann Nucl Med. 2000;14(3):143–50.
13. Hackstein N, Langheinrich AC, Rau WS. Lopromide one-sample clearance as a measure of glomerular filtration rate. Clin Physiol Funct Imaging. 2002; 22(2):99–107.
14. Fleming JS, Persaud L, Zivanovic MA. A general equation for estimating glomerular filtration rate from a single plasma sample. Nucl Med Commun. 2005;26(8):743–8.
15. Waller DG, Keast CM, Fleming JS, Ackery DM. Measurement of glomerular filtration rate with technetium-99m DTPA: comparison of plasma clearance techniques. J Nucl Med. 1987;28(3):372–7.
16. Hansen HP, Rossing P, Mathiesen ER, Hommel E, Smidt UM, Parving HH. Assessment of glomerular filtration rate in diabetic nephropathy using the plasma clearance of 51Cr-EDTA. Scand J Clin Lab Invest. 1998;58(5):405–13. 17. Peters AM, Henderson BL, Lui D, Blunkett M, Cosgriff PS, Myers MJ.
Appropriate corrections to glomerular filtration rate and volume of distribution based on the bolus injection and single-compartment technique. Physiol Meas. 1999;20(3):313–27.
18. Piepsz A, Ham R, De Sadeleer C. Guidelines for the measurement of glomerular filtration rate using plasma sampling. Nucl Med Commun. 2005;26(2):175–6. author reply 176-8
19. Haycock GB, Schwartz GJ, Wisotsky DH. Geometric method for measuring body surface area: a height-weight formula validated in infants, children, and adults. J Pediatr. 1978;93(1):62–6.
20. Lin LI. A concordance correlation coefficient to evaluate reproducibility. Biometrics. 1989;45:255–68.
21. Bland JM, Altman DG. Statistical methods for assessing agreement between two methods of clinical measurement. Lancet. 1986;1:307–10.
22. Russell CD. Optimum sample times for single-injection, multisample renal clearance methods. J Nucl Med. 1993;34(10):1761–5.
23. Fleming JS, Zivanovic MA, Blake GM, Burniston M, Cosgriff PS. Guidelines for the measurement of glomerular filtration rate using plasma sampling. Nucl Med Commun. 2004;25(8):759–69.
24. Blaufox MD, Aurell M, Bubeck B, et al. Report of the radionuclides in Nephrourology committee on renal clearance. J Nucl Med. 1996;37(11): 1883–90.
25. Bröchner-Mortensen J, Rödbro P. Optimum time of blood sampling for determination of glomerular filtration rate by single-injection [51Cr]EDTA plasma clearance. Scand J Clin Lab Invest. 1976;36(8):795–800.
26. Moore AE, Park-Holohan SJ, Blake GM, Fogelman I. Conventional measurements of GFR using 51Cr-EDTA overestimate true renal clearance by 10 percent. Eur J Nucl Med Mol Imaging. 2003;30(1):4–8.
27. McMeekin H, Wickham F, Barnfield M, Burniston M. A systematic review of single-sample glomerular filtration rate measurement techniques and demonstration of equal accuracy to slope-intercept methods. Nucl Med Commun. 2016;37(7):743–55.