Published online August 10, 2014 (http://www.sciencepublishinggroup.com/j/sjph) doi: 10.11648/j.sjph.20140205.13
ISSN: 2328-7942 (Print); ISSN: 2328-7950 (Online)
Assessment of knowledge, attitude and practice of health
care workers on infection prevention in health institution
Bahir Dar city administration
Kelemua Gulilat
1, Gebeyaw Tiruneh
21
Nursing Department Head, Bahir Dar health Science College, Bahir Dar city, Ethiopia
2
GAMBY College of Medical Sciences, Bahir Dar, Ethiopia
Email address:
[email protected] (K. Gulilat), [email protected] (G. Tiruneh)
To cite this article:
Kelemua Gulilat, Gebeyaw Tiruneh. Assessment of Knowledge, Attitude And Practice of Health Care Workers on Infection Prevention in Health Institution Bahir Dar City Administration.Science Journal of Public Health. Vol. 2, No. 5, 2014, pp. 384-393.
doi: 10.11648/j.sjph.20140205.13
Abstract:
Infection in healthcare facilities is a major public health problem in most developing countries like Ethiopia. Currently the overall incidence of health care associated infection has been increased and burden of these infections is staggering. Thus, it is important to identify the level of health care workers knowledge, attitude and practice in study area and identifying gaps for better intervention. Objectives: The objective of this study was to assess the level of knowledge, attitude and practice of health care workers on infection prevention and associated factors in the health institution. Methods: Institution based cross sectional study was conducted in April, 2012 in health facilities found in Bahirdar city administration. Data were collected using pre tested questionnaire on 354 health care workers selected by simple random sampling technique. The study was supplemented by observation. Collected data were checked, coded and entered into EPI –Info version 3.5.2 and transferred to SPSS version 16 for analysis. Both bivariate and multiple logistic regression analysis was done. Variables had P-value less than 0.2 in bivariate analysis entered in to multiple logistic regressions to control confounders. Frequency, Mean and other statistics were calculated. P-value less than 0.05 were set as statistically significant. Result: Overall knowledge score of respondents were 84.5% and about 55.6% had positive attitude and 54.2% of respondents’ had safe infection prevention practice. Result of multiple logistic regression analysis showed that working in hospital (AOR= 2.54; 95%CI (1.12, 5.75)), working experience greater than10years (AOR= 3.79 (95% CI=2.33, 6.17)) and availability PPE (AOR= 6.79 (95% CI=2.83, 17.27)) had positive association with infection prevention. Conclusion: Though participants had better knowledge and positive attitude their practice of infection prevention was not optimum as per the national guide line. Therefore improving institutional supplies like hand hygiene material, PPE, water supply and TST may improve safe infection prevention practice.Keywords:
Knowledge, Attitude and Practice, Health Care Worker, Bahir Dar City Administration1. Introduction
1.1. Background
Infection Control can be defined as measures practiced by healthcare personnel in healthcare facilities to decrease transmission and acquisition of infectious agents. Infection control measures are based on how an infectious agent is transmitted and include standard, contact, droplet, and airborne precautions (1)
Infection in hospitals and other healthcare settings is a problem for health services around the world and major
public health problem which is receiving considerable attention and the problems related to this is very serious which causes major health risks that leads to morbidity, mortality and cost (2).
Infection prevention and control measures aim to ensure the protection of those who might be vulnerable to acquiring an infection both in the general community while receiving care due to health problems in the range of settings. (3).
respiratory syndrome and emerging of other infectious diseases have highlighted the need for efficient infection control programs in all health care setting and capacity building for HCW to prevent the transmission of pathogens with in health care setting (4).
World health organization suggests that in 2000 reuse of injection devices in developing countries accounts for 22 million new infections with hepatitis (HBV), 2 million infections of HCV and 260,000 HIV. Additionally injection safety base line studies revealed that practices was un safe exposing patient, HCW and the community to transmission of HIV and other blood born infections.( 5)
1.2. Statement of the Problem
In the past 20 years, the overall incidence of HCAI has increased by 36 percent. The substantial human suffering and financial burden of these infections is staggering. HAI occurs worldwide and affect both developed and developing countries, about 5% -10% patients acquire one or more infections and 15%-40% of patient admitted to critical care thought to be affected. (.6)
It is also estimated that more than 1.4 million people worldwide are suffering from infections acquired in hospitals. More over annually in the United States, approximately 2 million patients develop HAI, and nearly 90,000 of these patients are estimated to die; this ranks HAI as the fifth leading cause of death in acute care hospitals (7)
According to the Centers for Disease Control and Prevention (CDC) in US nearly 1.7 million HAIs occur yearly, leading to approximately 99,000 deaths every year. Such infections were long accepted by clinicians as an inevitable hazard of hospitalization. However, recent efforts have demonstrated that relatively simple measures can prevent the majority of common HAIs, as a result, hospitals and providers are under intense pressure to reduce the burden of these infections .Four specific infections together account for more than 80% of all HAIs.(8)
At least 40 different pathogens were transmitted by sharp instruments and needle sticks injuries. The risk associated with transmission after percutaneous exposure to infected blood varies according to the specific blood borne pathogen. An estimated one-third of the global population has been infected with HBV; approximately 350 million people are lifelong carriers. For HCV, the World Health Organization estimates that 170 million individuals worldwide are infected. According to UNAIDS, worldwide around 39 million people are living with HIV as of December, 2006. According to data from EPI Net system, hospital workers -incur approximately 30 needle stick injuries per 100 beds per year an alarming figure by no exaggeration.(5)
In Sub-Saharan countries the problems associated with patient safety is often hampered by inadequate data. However, prevalence studies on hospital-wide healthcare-associated infection from some African countries reported high infection rates (Mali 18.9%, Tanzania 14.8%, Algeria 9.8%) with patients undergoing surgery being the most frequently affected). In addition to
HCAIs, developing countries are hit hard by HIV/AIDS pandemic hepatitis B virus and hepatitis C virus infections .In resource-poor settings, rates of infection can exceed 20%. (5)
Hospital wide health care associated infection prevalence varied between 2.5% and 14.5% in Algeria, Burkinafaso, Senegal and Tanzania. Over all HCAI cumulative incidence in surgical ward ranges from 5.7% to 45.8 % in studies conducted in Ethiopia and Nigeria (9)
The same is true in Ethiopia that the HCAI is a major problem that needs attention and action to improve the health institution infection prevention knowledge, attitude and practice. Hence, in Ethiopia in general and in Bahir Dar in particular, the problem of health care associated infection is attributed to be common in health institutions even though there was no detail study done in this area.
2. Method
2.1. Study Design, Area and Period
Institutional based cross-sectional quantitative survey was conducted from1/30 to April 2012 in health facilities found
Bahir dar city administration and supplemented by
observation. Bahir Dar is the capital city of Amhara National Regional State (ANRS), is located about 565 km North West of Addis Ababa. Administratively the town is divided in to 9 urban and 12 -rural Kebeles based on 2011 census the estimated total population of 251,309.The city has one referral hospital, ten health centers, ten health posts, two private hospitals, higher clinics. The study is conducted in one government referral hospital, eight health centers, four higher private clinics and two private hospitals.
2.2. Sample Size Determination
Nine government and six private health facilities were included in the study and randomly selected 362 health care workers included in the study. The sample size was determined using a single population proportion formula compliance of infection prevention, from survey done in black lion hospital in 2010 to 2011 reference number (17) assuming p ( 69 %) Considering 5% margin of error (d) and confidence level of 95% (
2
1−
α
z
Z ) = critical value =1.96
Based on the above information a sample size was 329 and 10% non response rate, the final sample size was 362. 2.3. Data Collection Methods and Analysis
initially among 10 %( 36) HCW working in Debre Tabor hospital, which is not included in the study then checked for its clarity, understandability and completeness then some questions that need revision has been revised before used for the final survey. Four data collectors (two BSC nurse, two health officers) and two supervisors whose background is B.S.C nurse were recruited and training were given for them. Supervisors and principal investigator were closely followed on data collection process. After data collection, the data were coded, entered, cleaned and stored using EPINFO version 3:5:2 and exported to SPSS Version 16 computer software program by the principal investigator. Statistical analyses like frequency, cross tab were used to describe most of the findings and graphs were also being plotted for some accordingly. To asses association for categorical variables, bivariaet analysis and multiple logistic regression analysis was done. For all statistical tests, the decision was significant if the p-value is < 0.05.
2.4. Ethical Considerations and Confidentiality
Ethical clearance was obtained from ethical review committee of Bahir Dar University and Letter of permission were obtained from ANRS Health Bureau and Bahir Dar city administration health office before data collection Verbal consent was also obtained from each health institutions and study participants. Similarly, the respondents were informed about purpose of the study. All information gained during data collection is confidential; there is no any personal identification which is left on the questionnaire.
Table 1. Socio Demographic characteristics of respondents in Bahir Dar City Administration 2012 (N=354)
Characteristics Frequency percent Level of health institution
government hospital 176 49.7
private hospital 41 11.6
health centers 102 28.8
private higher clinic 35 9.9
Age of the respondent
20-25 years 72 20.3
26-30 years 139 39.3
31-40 years 99 28.0
41+ years 44 12.4
Sex
Male 141 39.8
Female 213 60.2
Level of profession
Physician 28 7.9
Health officer 26 7.3
Nurse and Mid wives 241 68.1
laboratory 40 11.3
Sanitarian 5 1.4
others 14 4
Service year
< 5 years 116 32.8
6-10 years 80 22.6
10 +years 158 44.6
3. Result
3.1. Socio Demographic Characteristics of Respondents
A total of 354 healthcare workers were interviewed yielding the response rate of 97.8%. From the total respondents proportions of females were 213(60.5%). Regarding their working health facility 278(78.5%) respondents were from government health institutions. Nurses and midwives constitute 241 (68.1%) of study participants. The age of respondents ranged from 20- 50 years with mean of 30.6(±6.4). Participants were in the age group of 26-30 years accounts139 (39.3%). Regarding their service year 158(44.6%) had served for more than 10 years in their respective professions.(Table 1)
3.2. Knowledge of Respondents about Mode of Transmission of HCAIs in Bahirdar City Administration
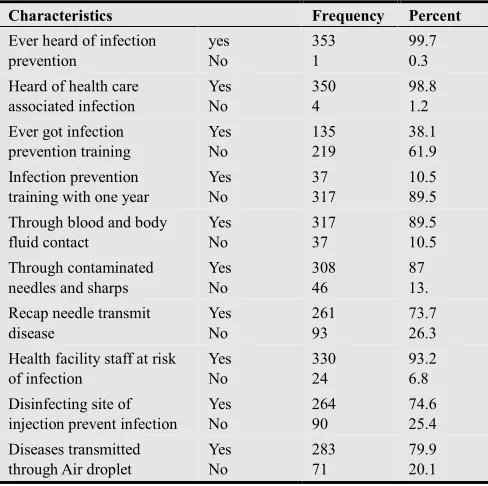
According to operational definition setted, the individual response was counted and the mean was calculated to classify respondents as knowledgeable and not knowledgeable based on the knowledge score. Majority of the respondents 299 (84.2 %) were knowledgeable and 55 (15.8%) were not knowledgeable in all health care facilities (Table 2).
Table 2. Knowledge of respondents about mode of transmission of HCAIs in Bahirdar city administration
Characteristics Frequency Percent Ever heard of infection
prevention yes No 353 1 99.7 0.3
Heard of health care associated infection Yes No 350 4 98.8 1.2
Ever got infection prevention training Yes No 135 219 38.1 61.9 Infection prevention training with one year
Yes No 37 317 10.5 89.5
Through blood and body fluid contact Yes No 317 37 89.5 10.5 Through contaminated needles and sharps
Yes No 308 46 87 13.
Recap needle transmit disease Yes No 261 93 73.7 26.3
Health facility staff at risk of infection Yes No 330 24 93.2 6.8
Disinfecting site of injection prevent infection
Yes No 264 90 74.6 25.4 Diseases transmitted through Air droplet
Yes No 283 71 79.9 20.1
3.3. Knowledge of Respondents Regarding Preventive Methods of Health Care Associated Infection (HCAI)
3.4. Knowledge of Health Care Workers about Diseases Transmitted by Sharp Injury and Body Fluid
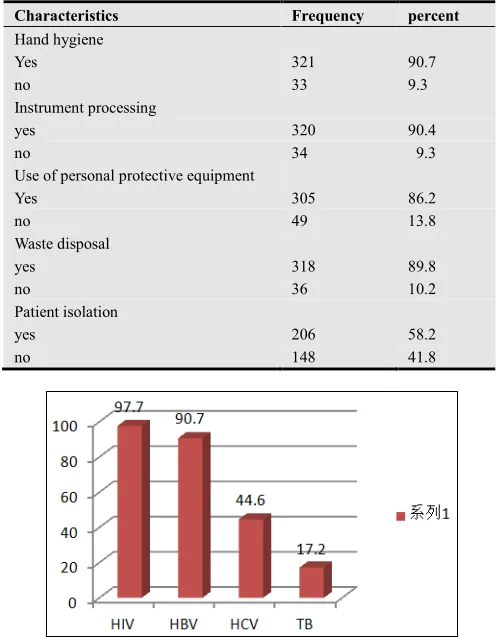
Majority of the respondent knew diseases transmitted by sharp injury and body fluid: 321(90.7) hepatitis B, 346 (97.7%) HIV, 196(44.6%) hepatitis C, and least percent 61(17.2%) Tuberculosis. This indicates that the health care workers had better knowledge about hepatitis B and HIV than other blood borne disease.
Table 3. Knowledge of respondents regarding to prevention methods of health care associated infections in Bahirdar city administration 2012
Characteristics Frequency percent
Hand hygiene
Yes 321 90.7
no 33 9.3
Instrument processing
yes 320 90.4
no 34 9.3
Use of personal protective equipment
Yes 305 86.2
no 49 13.8
Waste disposal
yes 318 89.8
no 36 10.2
Patient isolation
yes 206 58.2
no 148 41.8
Figure 1. Knowledge of health workers about diseases transmitted through sharp injuries and body fluids at health care facilities in Bahir Dar City Administration 2012
3.5. Attitude of Respondents Towards
Infection prevention
Based on our cut of point set in the opera tional definition among questions prepared to assess attitude of respondents 197(55.6%) of the study participants had positive attitude and the rest 157(44.4 %) had negative attitude towards infection prevention
3.6. Practices of the Respondents Regarding Infection Prevention
Respondents practices were assessed for the main element of infection prevention practice like hand hygiene, use of personal protective equipment and injection safety. Based on this the overall practice score was calculated by counting the
individual response rate and mean was calculated to classify their practice as safe and unsafe practice, based on this 192 ( 54.2%) of respondents had safe practice and 162 ( 45.8 % ) of them had unsafe practice.
3.7. Hand Hygiene Practice of the Respondent
According to health care workers estimation of their own hand hygiene practice, majority of health care workers 292 (82.5 %) had hand hygiene practice after completing the procedure they perform and about 180(50.8 %) wash their hand before the procedure. The overall hand hygiene practice score was 244(69.0%).Regarding to hand hygiene material almost all of the respondents 317(98%) use soap and water, where as only 31(8.8%) used disinfectant solution for hand washing practice.
The reason given by the respondent those who didn’t practice hand hygiene based on recommendations of hand hygiene practice were unavailability of hand washing facilities219 (38.1%), it takes time 111 (31.4%),if glove used not necessary 39 (11. %), and the least response not necessary 5 (1.4 %).(Table 5)
3.8. Practice of Personal Protective Equipment
Majority the respondents of 310(87.6) had ever wore at least one type of personal protective equipment (PPE) while providing patient care or caring equipments. Among the participants who used PPE almost all 352(99.4%), of the healthcare providers used working gown regularly but only 56(15.8%) used caps, 260(73.4%) of the respondents used gloves for all procedures that necessitate donning glove. On the other hand, 111 (31.1%) of the health workers were using gloves when caring all patients that require patient care regardless of their disease condition. The overall practice of PPE was 35.6%.
3.9. Practice of Injection Safety Among Respondents
Regarding the respondents injection practice 190 ( 53.7 % ) use safety box for needle collection after injection , 259 ( 73.2 %) avoid recap needle after injection and the rest 156 ( 44.1 % ) avoiding using swab before intramuscular and subcutaneous injection. Based on this response, their safe injection practice was 202 (57 %) and unsafe practice was 157 (43 %).7.4.4. Sharp injury history among respondents and actions taken
Among the respondent 166(46.9 %) reported that they ever had needle stick injury or sharp injury and
69(19.5 %) of health care worker had sharp or needle stick injury within the previous one year.
The result shown in the figure 2 below vividly shows
washing with water and soap was the most frequently taken measure by healthcare workers(HCW) after sharp injury constituting 290 (81.9 %). Also, 245(69.2%) of HCW were seeking post exposure prophylaxis after sharp injury.
3.10. Bivariate and Multivariate Analysis of Factors Affecting Knowledge of Respondents on Infection Prevention
Table 4. Bivariate and multivariate analysis of factors affecting knowledge regarding infection prevention
Characteristics Level of knowledge COR PV AOR
Knowledgeable n= 299 (%) Not Knowledgeable n=55 ( % ) ( 95%CI ) (95%CI ) Age
<30 years 178 (84.4) 33(15.6) 1
>30 years 121 ( 84.6) 22(15.2) 0.98(0.54,1.76)
Sex
Male 124 (87.9) 17 (12.) 1 1
Female 175 (82.2) 38 (17.8) 1.58(0.85,2.93) 0.20 1.49(0.80,2.)
Service year
<10 years 206 (86.2) 33(13.8) 1 1
>10 years 93 (80.9) 22(19.1) 1.47(0.81,2.67) 0.18 1.49(0.82,2.)
Level of profession
Physicians 21(75.0) 7 (25.0) 0.78(0.27,2.20)
Nurses and HO 239 (85.1) 42 (14.9) 0.83(0.36,1.90)
Laboratory and sanitarian 39 (86.7) 6 (13.3) 1
Types of institution
Hospitals 191(88.0) 26 12.0) 1.97(1.10,3.5) 0.02 1.96(1.09,3.)
Health centers and clinics 108(78.8) 29 (21.2) 1 1
IP training
yes 32 (86.5) 5 (13.5) 0.83(0.31,2.2)
No 267(84.2) 50 (15.8) 1
To identify knowledge predictors both bivariate and multivariate analysis was done on different selected variables. After adjustment made those HCW working in hospitals were two times knowledgeable than HCW
working in health centers and private clinic AOR (1.95(1.09, 3.51). Other variables had no association to knowledge of respondents. (Table 4)
3.10.1. Bivariate and Multivariate Analysis of Factors Affecting Attitude of Respondents on Infection Prevention
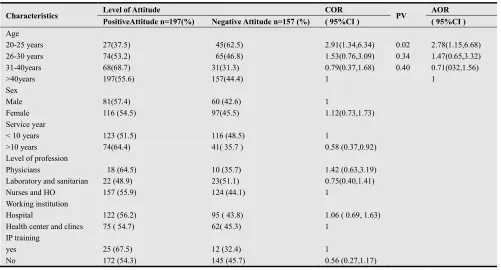
Table 5. Bivariate and multivariate analysis of respondents’ attitude regarding infection prevention
Characteristics Level of Attitude COR PV AOR
PositiveAttitude n=197(%) Negative Attitude n=157 (%) ( 95%CI ) ( 95%CI ) Age
20-25 years 27(37.5) 45(62.5) 2.91(1.34,6.34) 0.02 2.78(1.15,6.68)
26-30 years 74(53.2) 65(46.8) 1.53(0.76,3.09) 0.34 1.47(0.65,3.32)
31-40years 68(68.7) 31(31.3) 0.79(0.37,1.68) 0.40 0.71(032,1.56)
>40years 197(55.6) 157(44.4) 1 1
Sex
Male 81(57.4) 60 (42.6) 1
Female 116 (54.5) 97(45.5) 1.12(0.73,1.73)
Service year
< 10 years 123 (51.5) 116 (48.5) 1
>10 years 74(64.4) 41( 35.7 ) 0.58 (0.37,0.92)
Level of profession
Physicians 18 (64.5) 10 (35.7) 1.42 (0.63,3.19)
Laboratory and sanitarian 22 (48.9) 23(51.1) 0.75(0.40,1.41)
Nurses and HO 157 (55.9) 124 (44.1) 1
Working institution
Hospital 122 (56.2) 95 ( 43.8) 1.06 ( 0.69, 1.63)
Health center and clincs 75 ( 54.7) 62( 45.3) 1
IP training
yes 25 (67.5) 12 (32.4) 1
Concerning attitude predictors both bivariate and multivariate analysis was done on different selected variables. After adjustment made age of HCW had association to attitude of respondents. Those HCW age
20-25 were almost three times more likely to have positive attitude than HCW age more than forty years. [AOR=2.78(1.15, 6.68)]. Other variables had no association to attitude of respondents (Table5)
3.10.2. Multiple Logistic Regression Analysis on IP Practice
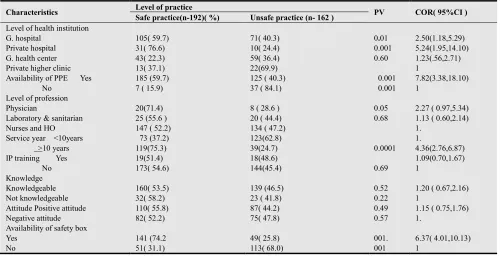
Table 6. Bivariaet analysis of factors affecting infection prevention practice among health care worker in Bahirdar city administration 2012 (N=354)
Characteristics Level of practice PV COR( 95%CI )
Safe practice(n-192)( %) Unsafe practice (n- 162 ) Level of health institution
G. hospital Private hospital G. health center Private higher clinic
105( 59.7) 31( 76.6) 43( 22.3) 13( 37.1) 71( 40.3) 10( 24.4) 59( 36.4) 22(69.9) 0.01 0.001 0.60 2.50(1.18,5.29) 5.24(1.95,14.10) 1.23(.56,2.71) 1
Availability of PPE Yes No
185 (59.7) 7 ( 15.9)
125 ( 40.3) 37 ( 84.1)
0.001 0.001
7.82(3.38,18.10) 1
Level of profession Physician
Laboratory & sanitarian Nurses and HO
20(71.4) 25 (55.6 ) 147 ( 52.2)
8 ( 28.6 ) 20 ( 44.4) 134 ( 47.2)
0.05 0.68
2.27 ( 0.97,5.34) 1.13 ( 0.60,2.14) 1.
Service year <10years >10 years
73 (37.2) 119(75.3)
123(62.8)
39(24.7) 0.0001
1.
4.36(2.76,6.87) IP training Yes
No
19(51.4) 173( 54.6)
18(48.6)
144(45.4) 0.69
1.09(0.70,1.67) 1 Knowledge Knowledgeable Not knowledgeable 160( 53.5) 32( 58.2) 139 (46.5) 23 ( 41.8)
0.52 0.22
1.20 ( 0.67,2.16) 1
Attitude Positive attitude Negative attitude 110( 55.8) 82( 52.2) 87( 44.2) 75( 47.8) 0.49 0.57
1.15 ( 0.75,1.76) 1.
Availability of safety box Yes No 141 (74.2 51( 31.1) 49( 25.8) 113( 68.0) 001. 001 6.37( 4.01,10.13) 1
According to this study different health institution has association with infection prevention practice. Health care workers working in Government G/hospital were two times more likely to practice IP compared to private hospital. [AOR=2.54(1.12, 5.75)]. Those healthcare working in private hospital were six times more likely to practice IP compared with those working in private higher clinics [AOR= 5.87(2.00, 17.25)].
Regarding to working experience, those, HCW who have
working experience ten years and above were four times more likely to practice infection prevention than those, who have less than ten year experience [AOR =3.79(2.33, 6.17)]. According to this study, availability of PPE has association with infection prevention practice. Health care workers working in health institution having continuous supply of PPE were seven times more likely to practice infection prevention compared with those who did not have continuous supply of PPE.[AOR=6.99(2.83,17.27)] (Table 6)
3.10.3. Binary Logistic Regression Analysis on Practice of IP
Table 7. Multivariate analysis of factors affecting infection prevention practice among health care worker in Bahirdar city administration 2012
Characteristics Level of practice
Safe practice(n-192 Unsafe practice ( n=162) COR ( 95%CI) PV AOR (95%CI) Level of health institution
G. hospital Private hospital G. health center Private higher clinic
105( 59.7) 31( 76.6) 43( 22.3) 13( 37.1) 71( 40.3) 10( 24.4) 59( 36.4) 22(69.9) 2.50(1.18,5.29) 5.24(1.95,14.10) 1.23( .56,2.71) 0.025 0.001 0.39 2.54(1.12,5.75) 5.87(2.00,17.25) 1.45(.62,3.39) 1
Availability of PPE Yes
No
185 (59.7) 7 ( 15.9)
125 ( 40.3) 37 ( 84.1)
7.82(3.38,18.10) 0.0001 6.99(2.83,17.27) 1
Level of profession Physician
Laboratory & sanitarian Nurses and HO
20(71.4) 25 (55.6 ) 147 ( 52.2)
8 ( 28.6 ) 20 ( 44.4) 134 ( 47.2)
2.27 ( 0.97,5.34) 1.13 ( 0.60,2.14
0.05 0.84 2.55(0.98,6.60) (1.07(0.50,2.29) 1 Service year <10years >10 years 73(37.2) 119(75.3) 123(62.8) 39(24.7)
Health professionals worked in Government hospital were nearly three times more likely to practice IP compared with those working in private higher clinics [2.50(1.18-5.29)].
Availability of personal protective equipment and safety box had been association with IP practice. Health professionals in health institutions having continuous supply of PPE had almost seven times better practice of IP compared with those working in health institutions have no PPE supply [AOR=6.99(2.83,17.27)]. According to this study, Health professionals having experience of less than ten year were nearly four times more likely to practice IP than those who have experience of more than ten years [4.36 ( 2.76,6.87)]( Table 7)
3.11. Result of Observation
All selected health care facilities and their activities related to infection prevention practices by health workers were observed prior to introducing the questionnaires of quantitative part. Medical, surgical, operation room, pediatrics, maternity wards, injection and dressing rooms; EPI, F.P and laboratory units were areas included for observations. Infection prevention practices such as performance of hand hygiene, injection practice, Instrument processing, use of personal protective equipment, methods of waste collection and disposal, linen handling, wound dressing practice and availability of water in the health care facilities and working area were activities focused for observational assessment.
3.12. Injection Related Practice of Health Workers (n=115)
The result of our observation showed that 44 (38.2%) were provided after explaining the procedure to client and 50(43.4 %) of the participants were practicing recapping of needles after injecting to their clients and after phlebotomy. Among those who used to recap the needle after injection while 30(60.0 %) of them were doing with one hand the rest, 20(40.0%) of them used two hand recap techniques. Our assessment also revealed that used needles and syringes were left on patient bed side in pediatrics, medical and surgical wards. Also, needles left with vials of anesthetic bottles were observed in minor operation rooms, especially in private health institutions. Regardless of the deficits observed, however, injections were universally provided with sterile packed disposable syringes and needles in all healthcare facilities
3.13. Observational Hand Hygiene Practice
Based on our assessment of hand hygiene practice of healthcare workers (HCW), the highest rate of practice was observed after completing their procedures and glove removal. On the other hand least practices were observed before procedures. In majority of the observed departments while alcohol was available it had not been utilized for hand hygiene rather for other activities mainly as swab
during intravenous infusion. In addition, in most of working rooms and patient care sites water hand washing logistics like soap and towel were not available, particularly in the government institution.
Instrument processing practice
Instrument processing was carried out including decontamination and sterilization processes. 16 areas of decontamination were observed 4 of them were labeled with date but not recent old labeling the solution were not changed with daily base some of decontaminant solutions prepared with inappropriate container and not covered, decontaminate solution were cloudy but were not changed. The concentration of the chlorine solution was correct for the moment.
Regarding sterilization method autoclave 10, oven 9 and boiler 1 from observed autoclave which is tested with TST for correct sterilization was practiced in one health facility the rest were not using TST indicator for their correct sterilization.
3.14. Linen Handling Practice
Among 24 areas observed for linen handling practice, used soiled linen were kept in linen hamper, plastic pail and in few area were put on the floor, among observed 27aeras of clean linen storage, 10areas were kept on the shelf without key and 16 areas kept with cupboard under key. Linen handling practices were poor, not handled as the standard and on the line of infection prevention practice.
Based on our observational assessment 179(99.4 %) health care worker ever wear working gown and majority of 126(70 %) health care worker use glove, additionally among observed health care worker practicing use of different PPE like apron 18(10%), mask 22(12 %), protective shoes 18(10.6%), eye Google 17(9.4%) and 18(10.6%) head cover were used respectively. Most of personal protective equipments were practiced in operation and maternity room.
3.15. Observed Waste Collection Methods
Among observed health institution 13 of them uses Standard biohazard labeled and water proof safety box. On the other hand, two health facilities were not using appropriate safety box for collection of needles and other sharp materials.
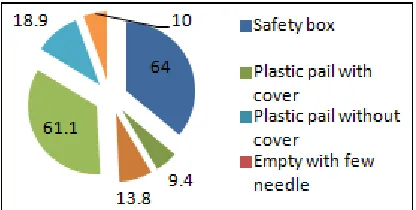
From 158 observed working rooms there were different kinds of materials to collect sharps and used needle and other wastes. Safety box, plastic pail with cover, plastic pail without cover were the common waste collection materials used by the health care facility 116(64.4%), 17(9.4%), and 25 (13.8%) respectively. Among the health care facilities assessed two private health institutions (one hospital and higher clinic) were not using standard safety box, rather collecting sharp wastes in their own manually made safety box.
use placenta pit for placenta and pathological waste disposal. In few health facilities placenta were disposed in to general waste disposal site. During observational assessment waste disposal Problems observed: the location of waste disposal nearest to working site, the waste were not burnt properly, some safety box observed at disposal site, cannula needles, syringe and needle were observed out of safety box .In most of health care facilities their waste handling and disposal methods were poor.
Figure 3. Observed on-site waste collection method in health care facility in Bahirdar city administration 2012
4. Discussion
This study assessed important information regarding knowledge, attitude and practice of health care workers about infection prevention in different health care facilities in Bahir dar city administration.
Majority of the respondents, 84.2%, had knowledge regarding infection prevention. This finding is better than the study finding in North wollo (44.4%) (26).This difference might be due to time gap; infection prevention training has been given for HCW now than the previous time. Similarly this finding was also better than the study finding in Zambia, Lusaka (62.9) (13). Possible justification could be due to time gap, socio economic difference, and high turnover of staffs and subsequent lose of experienced health care workers in Zambia.
Positive attitude about infection prevention is the pillar to prevent cross infection. More than half of the respondents (55.6%) had positive attitude about infection prevention. In spite of this fact significant number of HCWs in this study had negative attitude about infection prevention. This finding was lower than the study finding in Maldives Indian tertiary ADK hospital in which the reported level of attitude was 97 % (11).This difference might be attributed by the difference in academic back ground of the study respondents; while our study included various health care professionals, the study in India included only physicians and professional nurses.
More than half of HCW 54.2% had infection prevention practice. In spite of infection prevention training were given for health care workers safe infection prevention practice was low in this study. This finding was much lower than study finding in Black lion hospital (89%) (17).This difference might be due to implementation of quality improvement project in Black lion hospital. The other
possible explanation might be experienced health care workers transferred from other regions to take the advantage of living in the capital city of the country.
In this study (19.5%) of HCWs had history of sharp and needle stick injuries within the last twelve months. This finding was lower than study report in Hawasa (30.5%)(19), the study done in SNNRP (32.4%)(23) and the finding from Uganda Kampala (57%) (22). The possible explanation for this discrepancy might be related to time gap and reduction of injectable medication as different literatures showed that recap of needle and unsafe disposal of needle were among the main risk factors for sharp injury
Regarding the availability of in site collection materials for wastes , nearly two third, 64.4% of units in each health care facilities use safety box, 13.8% use of plastic pail without cover, 9.4% use plastic pail with cover and 4.4% use non standard, locally prepared sharp container. This finding was better than the study done in North Wollo 2006 where 84.1% (26) used open plastic bucket to collect sharps and needle. This result was indicative for better supply of plastic pail and increased trend of safety box to collect sharp materials in different health facilities.
To classify the injection as safe injection practice explaining the procedure, using single disposable injection materials, none recapping of needles, not leaving needles on stopper of vials and avoiding unsafe disposal of needles after use are the main requirements. However, 43 % of the injections given in the study were unsafe. This finding was better than unsafe injection practice reported from the study done in North wollo 2006, 87.3 %( 26) and Southern Ethiopia 74 %( 24).
Hand washing practice is the single most important means of preventing spread of infection (16). The result of interview with health care workers revealed that the overall hand hygiene practice by the respondents was 69.0 % among whom majority were after a certain procedure than before commencing it (82.5% vs. 50.9%). But this was not consistent with observation done among health care workers who were interviewed. These result was better than hand hygiene practices report in North wollo , 28.3% in 2006 but lower finding in Nigeria 79%(16)
5. Strength and Weakness of the Study
5.1. Strength of the Study
The data was collected using questionnaires and observational check list
Adequate sample size was applied according to single population proportion formula
Data collators were health professional and infection prevention trained
5.2. Weakness of the Study
All respondents were interviewed but some of them observed during the study period
Some of the respondents were volunteer during data collection
6. Conclusion
Even though HCW had a better knowledge and attitude, the practice scored on IP in the study area were not satisfactory and safe enough to the expected standard of the national guide line. In addition,Better supply of safety box was observed in government health facilities than private health care facilities. There were better injection practice in both health institutions but still unsafe practice was observed
In this study shortage of hand hygiene logistics, TSTkit and PPE were observed and their waste collection and disposal method were not safe enough according to the national IP guide line.
Recommendations
The studied Health institutions should Integration of infection prevention standard with routine works and improving sustainable supplies like PPE, TST kit, water supply and hand washing facilities at patient care site to correct the unsafe practice, and encouraging the HCW to use personal protective equipment
Bahirdar city administration office Supervision and monitoring of the healthcare worker practice toward IP as one of health service activities. ANRH Berua also Improving the pre service training with adequate time and durations for immediate engagement of the new employee to infection prevention practice.
References
[1] World health organization. Definition of infection prevention available at
http://www.google.com.tr/search.hl=tr&lr
[2] Petal L. Infection prevention guide line. Infection prevention with limited resources: Chicago; 1997.
[3] World Health organization. Infection control available at http/ www. Who.int/tropical / infection control/ en (21, 1- 2012)
[4] World Health Organization. Western pacific region available at http//www.wpro.int-tropics/ infection control /general info .hti.
[5] Federal Ministry of Health. Infection prevention and patient safety reference manual for health providers and managers in health care facilities 2010 p (92- 93)
[6] World Health Organization. collaborating center for patient safety solution 2007, volume 1(9).
[7] Nelson’s, Patrica W. Patient safety climate : variation in perceptions by infection preventionist and quality directors 2011 volume 2011
[8] Sax H. MD Improving hand hygiene to prevent health care associated infections patient safety solutions. World health organization hand hygiene observation method /may .2007, volume 1(9)2-7
[9] Salem T, Khalid U. Knowledge, attitude and practice of medical students regarding needle stick injuries. Health and medical students. 2010, 60(2)151-159..
[10] European Commission. Health and Consumer protection directorate, public consultation on strategies for improving patient safety by prevention and control of health care associated infection patient safety
[11] Najeeb N. Knowledge, attitude and practice of standard and transmission based precaution in tertiary and secondary health care setting of Maldives 2007 ( 41- 46)
[12] An investigation of nurse’s knowledge, attitude and practice regarding disinfection available at http://
www.biomedcentral.com/1471-2334/11/148
[13] . Katowa p, Mukwato, c.m.Ngoma. Compliance with infection prevention guidelines by health care workers. Medical journals of Zamibia.2007, 35(3)7-12
[14] Pittet D. Improving adherence to hand hygiene practices. Emerging infectious diseases Geneva Switzerland 2001, 7(2)2-18
[15] . Yuan L M, Dembry, B Higa. Perceptions of hand hygiene in china journal of Hospital infection 2009 volume 71 (2) 157-162.
[16] Infection Control and Hospital Epidemiology 2008, volume 29 (1)
[17] Azazh A, Diprete L, et al. Improvement of infection prevention compliance at Tikur ambesa hospital 2010 http://www.nichq.org/patient-safety-infection.htm/
[18] Alikhawaja, Dr.R. Knowledge, attitude and practice towards routine skin preparation before an injection. World family medicine journal. 2010, 8(2)8-17
[19] Wicker S, Jung J. Prevalence and prevention of needle stick injures among health care worker. German, 2007
[20] .Nsebuga FM, Akola MS. Needle stick injuries among nurses.trop medinthealth.2005, 10(8)773-781
[21] Naveen A, Na sheen N, Riffant m. Knowledge, attitude and practice of HCW regarding needle stick injury AGAKHAN University, journal of Pakistan medical association
[22] Needle stick injury among nurses in sub-Saharan Africa journal of tropical medicine international health 2005, volume 10 (8), 773-82
[23] Tadesse M, Tadesse T. Epidemiology of needle sticks injuries. Directory of continuing medical education courses.2007, 40(2)111-113
[25] An investigation of nurse’s knowledge, attitude and practice regarding disinfection procedure in Italian hospital.
[26] Damte M. Assessment of knowledge, attitude and practice of HCW on universal precaution in 2006
[27] Surveys of Injection Safety and Safety of Phlebotomies, Lancet Procedures, Intravenous Injections and Infusions in Government Health Facilities in the Philippines. Available at http /wwwwpro.who.int/health topics in injection safety
[28] Abash s, Ohimain E. Healthcare waste management in Nigeria: A case study. Journal of Public Health and Epidemiology March 2011, Vol. 3(3), pp. 99-110