http://www.sciencepublishinggroup.com/j/fm doi: 10.11648/j.fm.20170303.12
Optimization of Double Pipe Heat Exchanger with
Response Surface Methodology Using Nanofluid and
Twisted Tape
Farhad Fadakar Kourkah
1, Dariush Khosravi Mahd
1, Mojtaba Mirzaee
2, *1
Department of Mechanical Engineering, Sciences Faculty, Saveh Branch, Islamic Azad University, Saveh, Iran
2
Young Researchers and Elite Club, Omidiyeh Branch, Islamic Azad University, Omidiyeh, Iran
Email address:
[email protected] (M. Mirzaee)
*
Corresponding author
To cite this article:
Farhad Fadakar Kourkah, Dariush Khosravi Mahd, Mojtaba Mirzaee. Optimization of Double Pipe Heat Exchanger with Response Surface Methodology Using Nanofluid and Twisted Tape. Fluid Mechanics. Vol. 3, No. 3, 2017, pp. 20-28. doi: 10.11648/j.fm.20170303.12 Received: April 30, 2017; Accepted: May 25, 2017; Published: June 30, 2017
Abstract:
The performance of a double pipe heat exchanger is analyzed using Response Surface Methodology (RSM) with various input parameters namely Reynolds number, twisted ratio(y/w) and concentration of SiO2 nanofluid of the outputresponse the overall heat transfer coefficients of the double pipe heat exchanger. The experimental design is developed based on Box - Behnken design method. The influence of vital input parameters and interaction among them are investigated using analysis of variance (ANOVA). optimum value of the overall heat transfer coefficients is 2732.59(w/m2.k) when the Reynolds number ut is 19999.42, concentration(0.5%w) and twisted ratio(y/w) 5.87. In the desirability function approach, the value of desirability was 0.937 for the RSM model very close to The predicted RSM model is found to be capable of predictive overall heat transfer coefficients of double pipe heat exchanger.
Keywords:
Double Pipe Heat Exchanger, SiO2 Nanofluid, Central Composite Design1. Introduction
The convective heat transfer can be enhanced passively by changing the flow geometry, boundary conditions, or by enhancing the thermal conductivity of the fluid. Researchers tried to increase the heat transfer rate by increasing the thermal conductivity of the fluid. As a new research and technology frontier, Nano fluids are used to enhance heat transfer. Nano fluids are engineered colloids which are made of a base fluid and nanoparticles (1-100) nm. The advantages of Nano fluids are: (1) higher thermal conductivity than that predicted by currently available macroscopic models, (2) excellent stability, and (3) little penalty due to an enhancement in pressure drop and pipe wall erosion experienced by suspensions of micrometer or millimeter particles [1]. Such advantages of Nano fluid offer important benefits for numerous applications in many fields such as petrochemical, refining, electronic, transportation, medicine, heating, and air- conditioning. Another alternative method to enhance heat transfer is to insert twisted tape into a core tube. This approach induces secondary
recirculation to the axial flow, leading to an increase in tangential and radial turbulent fluctuation and thus reducing a thickness of the boundary layer.
Albadr [2] et al. experimental study on the forced convective heat transfer and flow characteristics of a Nano fluid consisting of water and different volume concentrations of Al2O3 Nano fluid (0.3–2)% flowing in a horizontal shell
and tube heat exchanger counter flow under turbulent flow conditions are investigated. The Al2O3 nanoparticles of about
30 nm diameter are used in the present study.
Madhesh et al [3], experimental investigate carried heat transfer potential and rheological characteristics of copper and titanium hybrid Nano fluids using a tube in the counter flow heat exchanger. The Nano fluids were prepared by dispersing the surface functionalized and crystalline copper and titanium hybrid Nano composite in the base fluid.
Influences of some important parameters such as nanoparticle concentration and Reynolds number on the enhancement of nano fluid heat transfer have been investigated.
Ahmed [5] et al. laminar forced convection flow of Al2O3–
water Nano fluid in sinusoidal-wavy channel is numerically studied. The two-dimensional governing equations of continuity, momentum and energy equations in body-fitted coordinates are solved using finite volume method.
Azmi [6] et al. Nano fluids systems only used for increase the heat transfer. The enhancement in heat transfer coefficients in combination with structural modifications of flow systems namely, the addition of tape inserts. Experiments are undertaken to determine heat transfer coefficients and friction factor of TiO2/water Nano fluid up to 0.3% volume
concentration at an average temperature of 30 C.
Celen et al [7] investigation numerical model having two-dimensional equations was obtained by a CFD program and experimental data were evaluated for the verification procedure of the numerical data outputs. Hydrodynamics and thermal behaviors of the water–TiO2 flow were calculated by
constant heat flux and temperature-dependent settings. Sekhara Reddy et al [8] investigated heat transfer, friction factor and thermal performance of three Nano fluids different blends were prepared with ethylene glycol and water and TiO2 nanoparticles and characterized for thermal
conductivity as a function of temperature and volume concentration of nanoparticles. Based on the experimental results, it is observed that the thermal conductivity of TiO2
nano fluids.
Using nano fluid together with twisted taped for heat transfer enhancement was reported in numerous research
works such as twisted tape inserts with Al2O3/water nanofluid
[9] and [10], helical twist tape inserts with Al2O3/water nano
fluid [11], twisted tape with alternate axis inserts with CuO/water nano fluid [12], twisted tape inserts with CuO/water nano fluid in corrugated tube [13], dual twisted tape inserts with CuO/water nanofluid in micro-fin tube [14], helical screw tape inserts with Al2O3/water nano fluids [15],
helical screw tape inserts using CuO/water nanofluids [16], and propeller inserts with TiO2/water nano fluid [17].
Moreover, Nagarajan et al. [18] reported that the geometries of left-right twisted tapes played an important role in governing heat transfer, friction factor and thermal performance.
In the present study will apply the quadratic model of RSM associated the Box–Behnken design (BBD) with four factors and three levels in order to establish an effective optimal procedure for optimizing the design parameters of double pipe heat exchanger with inner twisted tape tube. The corresponding mathematical models were developed by regressive analysis and then tested by analysis of variance (ANOVA) to examine the accuracy.
2. Experimental
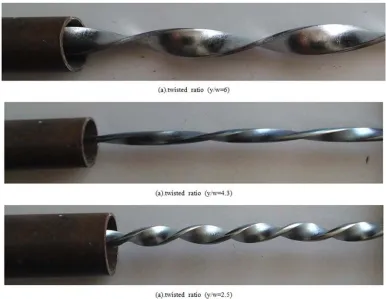
2.1. Twisted Tapes
In the test run, tapes are used with three different twist ratios y = 6, 4.3 and 2.5 Twisted tapes are made from steeliness steel strips of thickness 0.9 mm and width 8 mm as shown in figure 2. To produce the modified twisted tape, the typical twists changed by changing twist ratio and geometrical progression ratio along the twist.
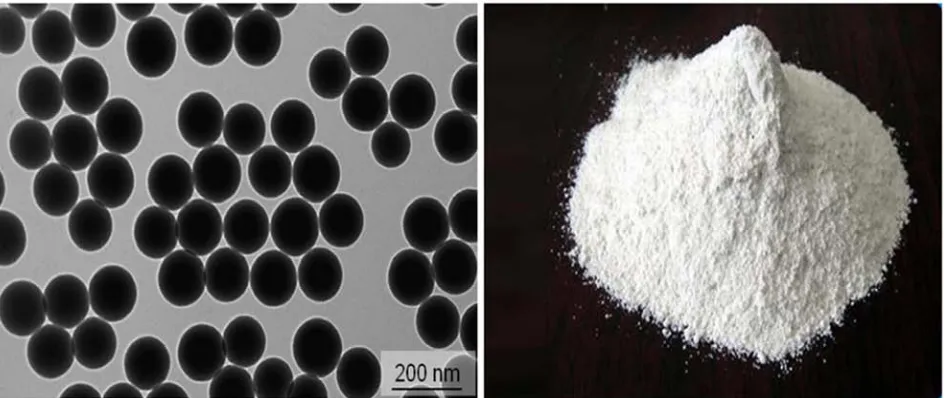
Figure 2. SEM image of SiO2 nanoparticles.
2.2. Preparation of Materials Nanofluid
The nanoparticles of SiO2 nanoparticles of size 15-20 nm
purchased in zigma rich, Bangalore, india. The nano particles are used at the ratio of 0.1-0.5% with distilled water. A ChromTech sonicator (Taiwan) with 40 kHz and 1200W with variable intensities was used to ensure that the nanoparticles were well dispersed in the water. The nanoparticles are weighed to the required ratio and then mixed with base fluid and then allowed for sonication to get the entire particles for soluble in the distilled water. The sonication is done for 2-3 hours continuously. The properties of SiO2 nanoparticles is
shown in table 1.
Table 1. SiO2 nanoparticles properties.
Property SiO2 nanoparticles
Appearance White powder
Diameter 15-20 nm
Surface area 640m2/gr
Density 2.4gr/cm3
Purity 99.50%
%Mass concentration = (1)
where
=amount of nanoparticles in gram = amount of base fluid(water) in gram
Figure 2 shows SEM images of the SiO2 and it was found
that SiO2 nanoparticles shows nearly spherical morphology.
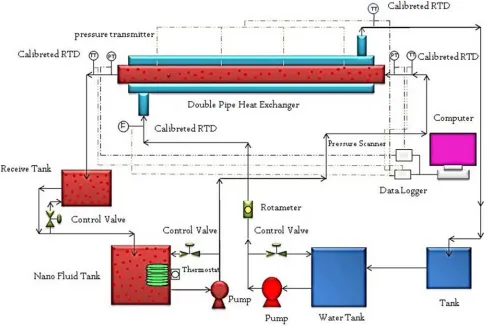
The experimental investigation of heat transfer characteristic of Nano fluid was carried out using the experimental apparatus as shown in figure 3. It mainly consists of a test section, receiving tanks in which working fluids are stored, heating and cooling system, thermometer, flow meter, Rota-meter, pressure measurement system and data acquisition system. The working fluids were circulated through the loop by using variable speed pumps of suitable capacity. The test section is of 1.2 m length with counter
Figure 3. Schematic of experimental setup.
The uncertainties calculated with the maximum possible error for the parameters and various instruments is given in Table 2.
Table 2. Uncertainty of experimental parameters in heat transfer with double pipe heat exchanger.
parameters Uncertainty
Mass flow nanofluid ±0.28
Mass flow water ±0.35
Twall ±0.15
Tbulk ±0.101
∆ ±0.19
Overall heat transfer 6.23-17.50%
Q (hot nanofluid) 8.31-15.69%
Q (cold fluid ) 6.23-17.58%
3. Response Surface Methodology
It is a combined mathematical and statistical technique based on the fit of a polynomial equation (empirical models) to the experimental data. This method generates a polynomial function for response relating it to the variables involved. In doing so it deals with the variables only at specific levels (mostly -1, 0, 1). RSM generates an experimental design for model preparation. An experimental design is a specific set of experiments defined by a matrix composed of the different
level combinations of the variables studied. Different methods of determining the response surface require a different experimental design. Generally, the relationship between the response and the independent variables is unknown. The most common forms are low-order polynomials (first or second-order). The simplest model which can be used in RSM is based on a linear function:
∑ (2)
where k is the number of variables, is the constant term, represents the coefficients of the linear parameters, xi
represents the variables, and is the residual associated to the experiments.
The next level of the polynomial model should contain additional terms, which describe the interaction between the different experimental variables. This way, a model for a second-order interaction presents the following terms:
∑ ∑ (3)
In order to determine a critical point (maximum, minimum, or saddle), it is necessary for the polynomial function to contain quadratic terms according to the equation presented below:
Where, represents the coefficients of the quadratic parameter. A second-order model can significantly improve the optimization process when a first order model suffers lack of fit due to interaction between variables.
The mathematical model found after fitting the function to the data can sometimes not satisfactorily describe the experimental domain studied. So, the quality of the model fitted is evaluated by the application of analysis of variance (ANOVA). RSM regressively fits the experimental readings of the design to a model (first, second or higher order) and determines the coefficients involved (β). General designs corresponding to these models are: i. First-Order Designs: The most common first-order designs are 2k factorial (k is the number of control variables), Plackett–Burman, etc. ii. Second-Order Designs: The most frequently used second-order designs are the 3 k factorial, central composite, and the Box–Behnken designs, etc.
The application of three-level factorial designs is not frequent, and the use of this design has been limited to the optimization of two variables because its efficiency is very low for higher numbers of variables. The central composite design is still the symmetrical second order experimental design most utilized for the development of analytical procedures. The Box–Behnken design present more efficient matrices and is more economical and hence has increased
number of published works in recent years. That is, Box-Behnken design requires least number of experimental runs and hence is most economical and most suitable in case where less no. of experimental runs is performed.
Box–Behnken design
(1)Requires an experiment number according to N=2k(k-1) + cp, where k is the number of factors and (cp) is the number of the central points.
(2)ii. All factor levels have to be adjusted only at three levels (-1, 0, +1) with equally spaced intervals between these levels
4. Results and Discussion
In this experimental study the performance of the double pipe heat exchanger is analyzed by response surface methodology (RSM). Box Behnken design method is employed with 3 input parameters namely Reynolds number (A), concentration (w%) (B) and twisted ratio(y/w) (C) over the output response as overall heat transfer. DESIGN-EXPERT software is used for this analysis. Table 3 shows the range of input parameters. In RSM -1 means the minimum and +1 denotes the maximum value of each input parameters.
Table 3. Actual and Coded values for different parameters involved.
Factor Name Type Low Actual High Actual Low Coded High Coded Mean
A Re Numeric 2000 20000 -1 1 11000
B Con (w%) Numeric 0.2 0.5 -1 1 0.35
C twisted ratio (y/w) Numeric 2.5 6 -1 1 4.25
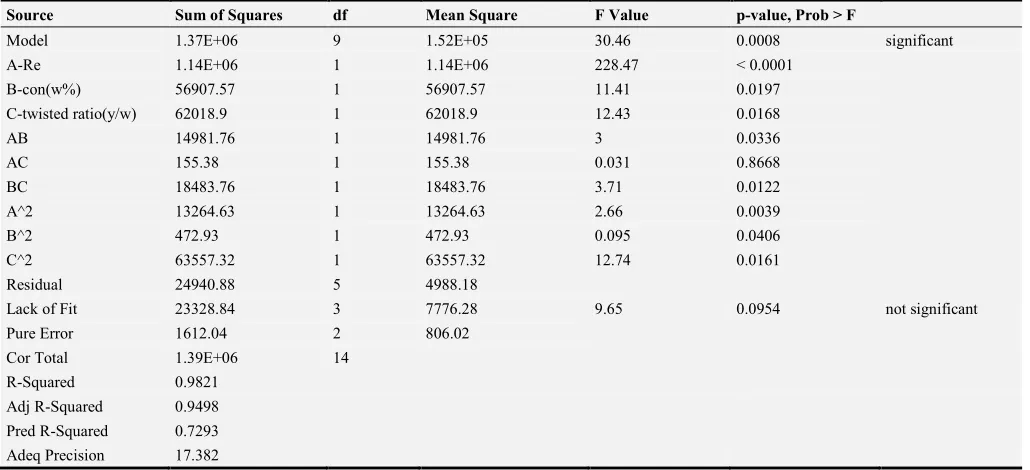
Table 4. ANOVA for Response Surface Quadratic Model – overall heat transfer coefficients.
Source Sum of Squares df Mean Square F Value p-value, Prob > F
Model 1.37E+06 9 1.52E+05 30.46 0.0008 significant
A-Re 1.14E+06 1 1.14E+06 228.47 < 0.0001
B-con(w%) 56907.57 1 56907.57 11.41 0.0197
C-twisted ratio(y/w) 62018.9 1 62018.9 12.43 0.0168
AB 14981.76 1 14981.76 3 0.0336
AC 155.38 1 155.38 0.031 0.8668
BC 18483.76 1 18483.76 3.71 0.0122
A^2 13264.63 1 13264.63 2.66 0.0039
B^2 472.93 1 472.93 0.095 0.0406
C^2 63557.32 1 63557.32 12.74 0.0161
Residual 24940.88 5 4988.18
Lack of Fit 23328.84 3 7776.28 9.65 0.0954 not significant
Pure Error 1612.04 2 806.02
Cor Total 1.39E+06 14
R-Squared 0.9821
Adj R-Squared 0.9498
Pred R-Squared 0.7293
Adeq Precision 17.382
The computed values of the overall heat transfer coefficientsare entered in the software design matrix. The Box–Behnken response surface methodology is used to
develop a best fit of the model to the experimental data, which are used to generate response surface plots. Table 4 shows the analysis of variance (ANOVA). The values of “Prob>F” less than 0.05 indicates model terms are significant. The value 0.05 shows that the regression is statistically significant at a 95% confidence level (P < 0.05). For the present case Reynolds number (A), twisted ratio(y/w) (C) are playing significant effect than the concentration (w%) (B). The square values of Reynolds number (A), twisted ratio(y/w) (C) and concentration (w%) (B) are also having significant effect on the performance of the double pipe heat exchanger. The interaction effect between Reynolds number and concentration (w%) (AB) also has significant effect. The interaction effect of concentration (w%) with twisted ratio(y/w) (BC) also made some significant effect on the efficiency. The other effect like AC is insignificant.
The “Pred R-Squared” value of 0.9821 (coefficient of determination) is in responsible agreement with “Adj R-Squared” of 0.9498. Adequate precision measures the signal to noise ratio. Here the ratio of 17.382 indicates an adequate signal. This model can be used to navigate the design space. The model F value is 30.46 and a probability value is less than 0.001 which indicates that the model is significant for to finding the overall heat transfer coefficientsof the double pipe heat exchanger. The sum of squares due to lack of fit, or more tersely a lack-of-fit sum of squares, is one of the components of a partition of the sum of squares in an analysis of variance, used in the numerator in an F-test.
Based on ANNOVA, different coefficients were estimated to develop the following empirical relation to predict the overall heat transfer coefficients of the double pipe heat exchanger. The values are Prob > F less than the 0.05 indicates that the terms are significant and values are greater than the 0.1 indicates that the insignificants. The lack of fit F value is 9.65 means the lack of fit not significant and it relative to the pure error. Non significant of lack of fit is good for model to fit. Based on the ANNOVA, the following empirical relation was developed to predict the overall heat transfer coefficients of the the double pipe heat exchanger. The df denotes the degree of freedom of the model and that value is 9. It is the number of values in the final calculation of a statistic that are free to vary. Mean squares are used in analysis of variance and are calculated as a sum of squares divided by its appropriate degrees of freedom.
Overall heat
transfer=1463.68732+0.075765(Re)-391.74643con(w%)+227.55027twisted
ratio(y/w)-0.045333(Re) con(w%)-3.95714E-004(Re)twisted
ratio(y/w)+ 258.96190con(w%) twisted ratio(y/w)-7.39969E-007 Re2+503con(w%)2-42.84082 twisted ratio(y/w)2 (5)
The working fluid in this analysis is SiO2 nanofluid. The
base fluid used in the SiO2 nanofluid is DI water. The
equation 5 valid for the experiments within the range of double pipe heat exchanger operation mentioned in the table 3.
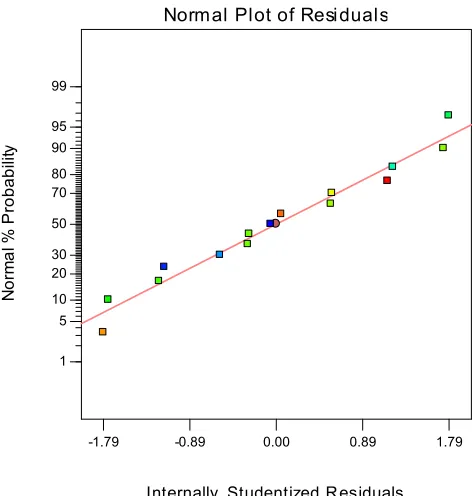
Figure 4. Normal plot of residual on overall heat transfer coefficients.
Figure 4 shows the normal plot of residuals for overall heat transfer coefficientsof the double pipe heat exchanger, which indicates that errors in the experiments are normally distributed.
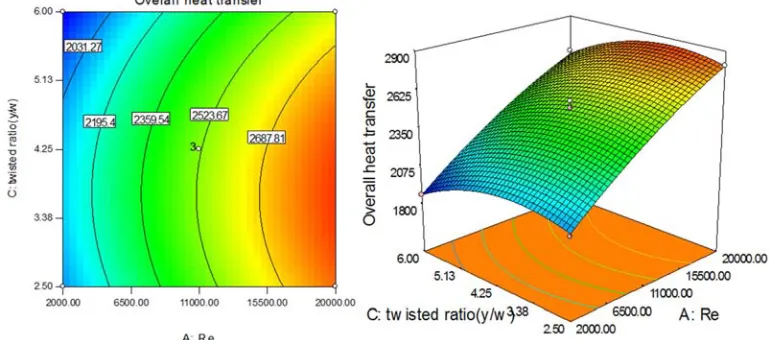
It is observed from Figurs 5-7 that the overall heat transfer coefficientsof double pipe heat exchanger increases linearly with an increase the Reynolds number in the test section. In general, the increase of nanofluid concentration results in the following consequences: (1) the increases of thermal conductivity and collision of nanoparticles which are favorite factors for heat transfer enhancement and (2) an increase of fluid viscosity which diminishes the fluid movement and thus heat transfer rate. The obtained result implies that for the present range, the effect of the increase in thermal conductivity and the collision of nanoparticles are more prominent than the increase of the fluid viscosity. It is evident from Figures 6 and 7 that when a twisted tape is inserted into a plain tube there is a significant improvement in overall heat transfer coefficients because of secondary flow, with greater enhancement being realized at higher Reynolds numbers and lower twist ratios.
From the figure 7 it Is evident that the overall heat transfer coefficients increases with the decrease twisted ratio. The overall heat transfer coefficients of the double pipe heat exchanger reaches a maximum at twisted ratio(y/w=4.25) afterwards the overall heat transfer coefficients tends to decrease. This enhancement is mainly due to the centrifugal forces resulting from the spiral motion of the fluid and partly due to the tape acting as fin. It is observed that the reduction in tape width causes reduction in overall heat transfer coefficientsas well as reduction in pressure drop.
One reason for this difference in heat transfer at high Reynolds numbers is the high viscosity of nanofluid. In general, the fluid containing rod-shaped particles, due to
Internally Studentized R esiduals
N o rm a l % P ro b a b ili ty
Norm al Plot of Resi duals
-1.79 -0.89 0.00 0.89 1.79
severe reactions, has high viscosity and high density in shear flow. Particle concentration and movement of particles in the flow are other factors that affect the heat transfer [6]. The transitional move is assumed the main mechanism for increasing the thermal conductivity of nanoparticles. The mobility of finer particles increases the coefficient of thermal conductivity of nanofluids more than the coarse particles. Twisted-tape inserts increase the heat transfer coefficients with relatively small increase in the pressure drop [3-4].
The thickness of the thermal boundary layer decides the amount of the diffusion heat transfer from wall to fluid. At lower twist ratio, the thickness of thermal boundary layer is small, causing a very small amount of diffusion heat transfer. Therefore, the overall heat transfer is mainly because of the convective currents generated by the transverse velocity. They are known to be one of the earliest swirl flow devices employed in the single phase heat transfer processes. Because of the design and application convenience they have been widely used over decades to generate the swirl flow in the fluid. Size of the new heat exchanger can be reduced significantly by using twisted tapes in the new heat exchanger for a specified heat load [8]. Thus, it provides an economic advantage over the fixed cost of the equipment. Twisted tapes can be also used for retrofitting purpose. They
can increase the heat duties of the existing double tube heat exchangers [8]. Twisted tapes with multitube bundles are easy to fit and remove and thus enable tube side cleaning in fouling situations. Inserts such as twisted tape, wire coils, ribs, and dimples mainly obstruct the flow and separate the primary flow from the secondary flows. This causes the enhancement of the heat transfer in the tube flow. Inserts reduce the effective flow area thereby increasing the flow velocity. A complete uncertainty analysis was also made to estimate the errors associated with experiments. The overall heat transfer occurring from tube to fluid is due to combined effect of conduction and convection. Tube flow can be divided into two parts- boundary flow and core flow. The boundary flow is a fluid region near the wall, beyond which, in the tube, the core flow is defined. If the secondary flow created due to flow conditions (Twist ratio and Reynolds number) disturbs only the core flow, it will promote uniform temperature in core region and thus will enhance conduction heat transfer from wall to fluid. On the contrary if secondary flow disturbs boundary flow, convection heat transfer will dominate [7-9]. Thus it is important to analyze velocity profile and temperature profile near wall and at core to understand effect of secondary flow on heat transfer at various flow conditions [16-17].
Figure 5. Response surface plots for the effect of the Reynolds number and the concentration on the overall heat transfer coefficients.
Figure 7. Response surface plots for the effect of the concentration(w%) and twisted ratio(y/w) on the overall heat transfer coefficients.
Figures 8 and 9 show the optimization plot with a desirability of 0.937 generated by RSM. It shows that the optimum value of the overall heat transfer coefficients is 2732.59 (w/m2.k) when the Reynolds number ut is 19999.42, concentration (0.5%w) and twisted ratio (y/w) 5.87.
Figure 8. Optimization plot for double pipe heat exchanger.
Figure 9. Comparison of predicted and experimental values.
The confirmation tests are conducted and the errors are tabulated in the figure 9. The findings show that the errors between the experimental and predicted values are less than 3%. It denotes that the predicted model is efficient.
5. Conclusion
In this paper, the experimental results showed the overall heat transfer coefficients of the double pipe heat exchanger and the statistical analysis results demonstrated that the effects of various operating parameters on the overall heat transfer coefficients. Empirical relation for overall heat transfer coefficients was developed to correlate dominant input parameters like Reynolds number, twisted ratio (y/w) and concentration of SiO2 nanofluid of coolant using
Response Surface Methodology. The influence of input parameters on the performance of double pipe heat exchanger was analyzed based on the developed relation by RSM. The predicted value of RSM are very closer to the experimental results and it has reduced the number of experiments, because RSM provides useful interaction between different
Actual
P
re
d
ic
te
d
Predicted vs. Actual
1800.00 2100.00 2400.00 2700.00 3000.00
variables of the system. In the desirability function approach, the value of desirability was 0.937 for the RSM model very close to The predicted RSM model is found to be capable of predictive overall heat transfer coefficients of double pipe heat exchanger’s showed a better accuracy and capability of generalization with the design of experiments.
References
[1] Choi, S. U. S. “Enhancing thermal conductivity of fluids with nanoparticles”, In: D. A. Siginer and H. P Wang (Eds), Developments and Applications of Non- Newtonian Flows, ASME FED, 231/MD, 66, pp. 99- 105, 1995.
[2] Jaafar Albadr, Satinder Tayal, Mushtaq Alasadi. “Heat transfer through heat exchanger using Al2O3 nanofluids at different concentrations”. Case Studies in Thermal Engineering 1 (2013) 38–44.
[3] D. Madhesh, R. Parameshwaran, S. Kalaiselvam. “Experimental investigation on convective heat transfer and rheological characteristics of Cu–TiO2 hybrid nanofluids”. Experimental Thermal and Fluid Science 52 (2014) 104–115. [4] Mostafa Keshavarz Moraveji, Reza Mohammadi Ardehali.
“CFD modeling (comparing single and two-phase approaches) on thermal performance of Al2O3/water nanofluid in
mini-channel heat sink”. International Communications in Heat and Mass Transfer 44 (2013) 157–164.
[5] M. A. Ahmed, M. Z. Yusoff, K. C. N, N. H. Shuaib. “The effect sofwavy-wall phase shifton thermal-hydraulic performance of Al2O3–water nanofluid flow in sinusoidal-wavy channel Studies in Thermal Engineering 4(2014)153– 165.
[6] W. H. Azmi, K. V. Sharma, P. K. Sarma c, Rizalman Mamat, Shahrani Anuar. “Comparison of convective heat transfer coefficient and friction factor of TiO2 nanofluid flow in a tube
with twisted tape inserts”. International Journal of Thermal Sciences 81 (2014) 84-93.
[7] Ali Celen, Nurullah Kayaci, Alican Çebi, Hakan Demir, Ahmet Selim Dalkılıç, Somchai Wongwises. “Numerical investigation for the calculation of TiO2–water nanofluids' pressure drop in plain and enhanced pipes”. International Communications in Heat and Mass Transfer 53 (2014) 98–108. [8] M. Chandra Sekhara Reddy, Veeredhi Vasudeva Rao.
“Experimental investigation of heat transfer coefficient and friction factor of ethylene glycol water based TiO2 nanofluid
in double pipe heat exchanger with and without helical coil inserts”, International Communications in Heat and Mass Transfer 50, (2014)68–76.
[9] K. V. Sharma, L. Syam Sundar, P. K. Sarma, “Estimation of heat transfer coefficient and friction factor in the transition flow with low volume concentration of Al2O3 nanofluid flowing in a circular tube and with twisted tape insert”, Int. Commun. Heat Mass Transf., 36 (2009), pp. 503–507 [10] L. Syam Sundar, K. V. Sharma “Turbulent heat transfer and
friction factor of Al2O3 nanofluid in circular tube with twisted
tape inserts”, Int. J. Heat Mass Transf., 53 (2010), pp. 1409– 1416
[11] G. Pathipakka, P. Sivashanmugam “Heat transfer behaviour of nanofluids in a uniformly heated circular tube fitted with helical inserts in laminar flow”, Superlattices Microstruct., 47 (2010), pp. 349–360.
[12] K. Wongcharee, S. Eiamsa-ard “Enhancement of heat transfer using CuO/water nanofluid and twisted tape with alternate axis”, Int. Commun. Heat Mass Transf., 38 (2011), pp. 742– 748.
[13] K. Wongcharee, S. Eiamsa-ard “Heat transfer enhancement by using CuO/water nanofluid in corrugated tube equipped with twisted tape”, Int. Commun. Heat Mass Transf., 39 (2012), pp. 251–257.
[14] S. Eiamsa-ard, K. Wongcharee “Single-phase heat transfer of CuO/water nanofluids in micro-fin tube equipped with dual twisted-tapes”, Int. Commun. Heat Mass Transf., 39 (2012), pp. 1453–1459.
[15] S. Suresh, K. P. Venkitaraj, P. Selvakumar “Comparative study on thermal performance of helical screw tape inserts in laminar flow using Al2O3/water and CuO/water nanofluids”, Superlattices Microstruct., 49 (2011), pp. 608–622.
[16] S. Suresh, K. P. Venkitaraj, P. Selvakumar, M. Chandrasekar “A comparison of thermal characteristics of Al2O3/water and CuO/water nanofluids in transition flow through a straight circular duct fitted with helical screw tape inserts”, Exp. Therm. Fluid Sci., 39 (2012), pp. 37–44.
[17] V. T. Perarasu, M. Arivazhagan, P. Sivashanmugam “Heat transfer of TiO2/water nanofluid in a coiled agitated vessel with propeller”, J. Hydrodyn. Ser. B, 24 (2012), pp. 942–950. [18] P. K. Nagarajan, YagnaMukkamala, P. Sivashanmugam,