R E S E A R C H
Open Access
Optical system for measuring the spectral
retardance function in an extended range
Abdelghafour Messaadi
1, María del Mar Sánchez-López
2, Pascuala García-Martínez
3, Asticio Vargas
4and Ignacio Moreno
1*Abstract
Background:Optical retarders are key elements for the control of the state of polarization of light, and their wavelength dependance is of great importance in a number of applications.
Methods:We apply a well-known technique for determinig the spectral retardance by measuring the transmission spectra between crossed or parallel polarizers. But we we develop an optical system to perform this measurement in a wide spectral range covering the visible (VIS) and near infrared (NIR) spectrum in the range from 400 to 1600 nm. Results:As a result we can measure the spectral retardance of different retarders and easily identify the kind of reterder (multiple order, zero-order, achromatic). We show results with tunable liquid-crystal retarders as well, where the technique is applied to determine the spectral retardance as a function of the applied voltage. Finally, the accuracy of the technique is verified by the generation of a birefringent spectral filter.
Conclusions:A technique to measure the spectral retardance of a linear retarder in a wide spectral range is applied to identify different types of retarders, and provide an accurate description of the spectral polarization conversion properties of these elements.
Keywords:Optical retarders, Liquid‐crystals, Spectroscopy, Filters
Background
Optical linear retarders are very useful components for any optical application requiring control of the state of polarization [1]. High quality retarders are usually fabri-cated with anisotropic optical materials such as quartz or calcite. Lower cost retarders are fabricated with birefringent polymers, having additionally the advantage of being produced with much larger areas. Tunable retarders can be fabricated with liquid crystal (LC) materials, where the application of a relative low voltage yields a large variation of the effective retardance, due to the tilt of the liquid-crystal director. Liquid crystal retarders (LCR) can be manufactured in the form of a single retarder element, or in the form of one or two-dimensional arrays, as in the liquid-crystal on silicon (LCOS) displays [2]. Other tunable retarders are fabri-cated with electro-optic materials, such as lithium
niobate (LiNbO3). They require higher voltages and have much smaller areas than LC retarders, but can be switched at much faster rates [3]. Therefore, these tunable retarders are becoming very useful in all kind of applications that require programmable control of the intensity, the phase, or the state of polarization of an input light beam, thus becoming key components in advanced optical instruments for optical microscopy, interferometry, polarimetry or optical communications.
Usually, linear retarders are designed introducing a specific retardance (typically a half-wave or a quarter-wave) for a given operating wavelength. However, characterization of their spectral retardance properties can be very valuable for several reasons: 1) the retarder can be used at wavelengths different to the original design; 2) the retarder can be applied to build spectral birefringent filters, which are based on the wavelength variation of the retardance [4], 3) it allows the simple identification of the ordinary and extraordinary neutral axes of the retarder [5], and 4) the retardance modula-tion of tunable LC retarders can be characterized [6, 7]. * Correspondence:[email protected]
1Departamento de Ciencia de Materiales, Óptica y Tecnología Electrónica,
Universidad Miguel Hernández, 03202 Elche, Spain
Full list of author information is available at the end of the article
In addition, the spectral retardance function can provide very useful information about the fabrication character-istics of the retarder, allowing a simple identification of multiple-order, low-order or zero-order retarders, as well as achromatic retarders.
Several works have demonstrated different techniques for the spectral retardance characterization. A usual tech-nique consists in inserting the retarder in between two lin-ear polarizers, which are oriented at ±45° with respect to the retarder neutral axes. The system is illuminated with a light source with broadband spectrum, and the transmis-sion is analyzed with a spectrometer [6–10]. The transmit-ted spectrum typically shows an oscillatory dependence with wavelength from which the spectral retardance func-tion can be retrieved. Similar spectral methods sequen-tially rotate the polarizers to achieve more data [11, 12]. In addition, this kind of spectral measurements provide a simple test to identify whether the retarder presents multiple-reflection Fabry-Perot interferences [13].
Most of the works mentioned above use visible (VIS) light. However, there is an increasing interest in extending the spectral range in the near infra-red (NIR) range, for applica-tions such as optical fiber communicaapplica-tions, with its trans-parency window centered at 1550 nm [14], or biomedical imaging, where the therapeutical windows in the ranges of 650–950 nm (first window) or 1100–1350 nm (second win-dow) are conventionally used for tissue imaging, and deeper IR windows seem to have potential great interest [15].
Here we apply the above mentioned technique of meas-uring the transmittance spectra between crossed or parallel polarizers to determine the spectral retardance function [6–12], but we use an optical calibration system developed for extending the measurement range to wavelengths from 450 nm to 1600 nm. The system incorporates a thermal broadband light source or a super-continuum laser, two broadband beam-splitter polarizers, and two spectrometers that operate in the VIS and in the NIR band regions respectively. As a result, we can determine the spectral
retardance function of different retarders in a very wide spectral range by fitting the measured and the simulated transmission curves. In some cases, a Cauchy-like disper-sion relation can be applied, which has been proved to give good approximations far from the absorption bands of an-isotropic materials [6, 7, 10, 12].
We apply the developed system to different types of retarders such as multiple-order, zero-order and achro-matic retarders. We show how their spectral characteris-tics allow a very simple identification of these different types of retarder designs. In all cases we determine the spectral retardance function, and we also include some interesting configurations that can be obtained by simply placing two retarders.
Methods
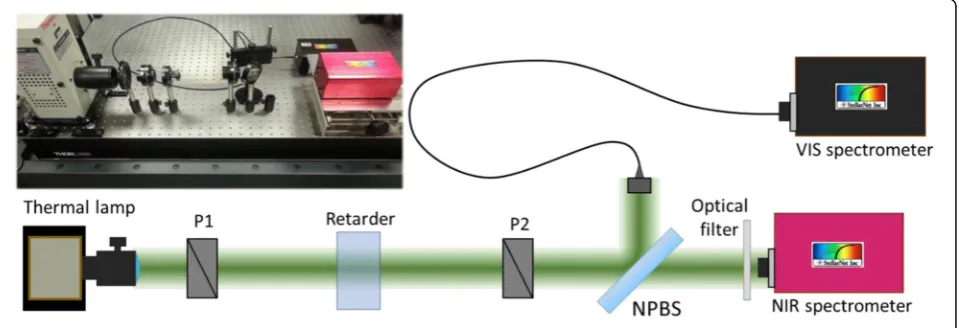
Figure 1 shows a scheme of the optical system, including a picture in the inset. We use a quartz tungsten halogen lamp from Oriel, model 66882, with a power that can be adjusted from 10 to 250 watts. It provides white light of continuous broadband spectrum that covers the wave-length range from 400 to 1600 nm. The housing includes a fused silica condenser that can be adjusted to provide a collimated output beam with a diameter of 33 mm.
As linear polarizers (P1 and P2) we use two high-quality calcite Glan-Taylor cube polarizers from Edmund Optics, covering a spectral range from 350 to 2200 nm, with a nominal extinction ratio less than 5 × 10⁻⁶. This kind of polarizers is required since common commercial polaroid sheets do not act properly as polarizers in the IR range. They have been mounted on rotatable mounts, so the angle of the transmission axis can be rotated con-tinuously. The retarder to be characterized is placed in between the two polarizers. Then, the transmitted light is divided in two beams by means of a B270 Glass Polka Dot beam-splitter from Thorlabs. Again, this kind of beam-splitter is required since it operates in a wide range of wavelengths from 350 nm to 2.0μm. These two
beams are analyzed with two different spectrometers. The beam reflected by the beam-splitter is captured with a STN-F600-UVVIS-SR optical fiber that is connected to a VIS spectrometer from Stellar-Net, STN-BLK-C-SR model, which measures the spectrum in the range from 200 nm to 1080 nm with a resolution of 2 nm. The second beam is directly sent to another spectrometer from Stellar-Net, model STE-RED-WAVE-NIR-512-25, which measures the spectrum from 900 nm to 1700 nm, with a resolution of 3 nm. In this case we do not use a fiber to avoid absorption bands in the IR region. Finally, in order to avoid second-order contribution from the visible light that enters this IR spectrometer, we include a filter in front of the slit entrance, which filters the visible spectrum.
The retarder is inserted between two parallel or crossed linear polarizers, with the principal c-axis oriented with a relative angle of 45° with respect the transmission axes of the polarizers. In this situation, the normalized transmis-sion output is given by [4]:
Tpar¼ cos2 φ
2 ; Tcros ¼ sin
2 φ
2 ; ð1Þ
where subindices“par”and“cros”refer to having the two polarizers parallel or crossed respectively. Here,ϕdenotes the wave-plate retardance. These relations assume ideal retarders and polarizers, where no other polarization phe-nomena different than linear retardance occurs. This is a reasonable approximation for linear retarders, and no add-itional polarimetric measurements are required.
In order to normalize the experimental spectral data, the intensity of the transmitted light is measured in two ways: one first measurement with parallel polarizers,
Ipar(λ), and a second with crossed polarizers,Icros(λ). The retarder is inserted in between the polarizers with the principal axis rotated 45° to polarizer P1. Then, data are normalized for each wavelength as:
Tpar¼
Ipar
IparþIcros;
Tcros¼
Icros
IparþIcros: ð
2Þ
This normalization makes the experimental data directly comparable to Eqs. (1). Again, note that this kind of normalization ignores possible spectral variations in the transmission/extinction of the analyzer, and therefore high quality polarizers must be employed. Our goal here is to measure the spectral retardance function, i.e., the function ϕ(λ) which describes the dependence of the retardance with wavelengthλ. For that purpose the functionϕ(λ) that best fits the curvesTpar(λ) andTcros(λ) must be determined.
In fact, different types of retarders show very different spectral retardance functions [16]. Therefore, these spectral measurements are of interest to easily identify the kind of retarder. For instance, a simple retarder composed of a sin-gle layer of uniaxial plate, the retardance is given by
φ¼ðke−koÞ d¼
2π
λ ðne−noÞ d; ð3Þ
wherekeandkoare the wavenumbers for the extraordin-ary and ordinextraordin-ary waves,ne and noare the extraordinary and ordinary indices of refraction respectively, andd de-notes the thickness of the plate. In multiple-order re-tarders, the thicknessdis large, and the total retardance for the design wavelength is
φ¼m2πþδ; ð4Þ
where mis the order of the retarder, and δ denotes the modulo 2π retardance. For these multiple-order re-tarders, the function ϕ(λ) change very rapidly and the retarder suffers from larger retardance variations with temperature and wavelength. These variations are re-duced significantly with zero-order retarders, where the retardance is directly the design value,ϕ=δ, i.e., m= 0, and consequently the functionϕ(λ) changes slowly.
In some applications it is of interest to use retarders with a retardance that does not change with wavelength. Achro-matic retarders are made by placing together two retarder layers of different materials with opposite dispersion rela-tions [17, 18]. The difference in thickness and refractive index of these two anisotropic layers can be adjusted to provide the same retardance for two separated wavelengths, andϕ(λ) only shows a very small amount of deviation from this value in between. Alternatively, Fresnel rhombs are re-tarders with almost perfect wavelength independent retar-dance [19], since they are not based on a material’s birefringence, but on the difference in phase-shift for thes
andppolarized components in a total internal reflection. All these different types of retarders exhibit very differ-ent spectral retardance functions, that can be easily visu-alized in the spectrometer, as shown next.
Results and discussion
In this section we show results of the spectral retardance measured for different retarders.
Multiple-order and zero-order retarders
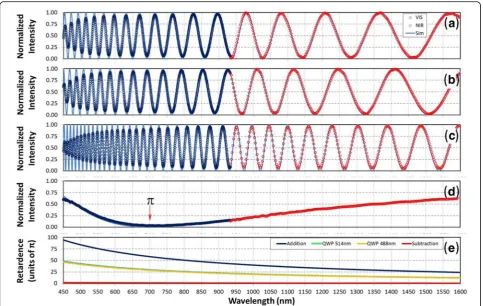
We start by using two different quartz quarter-wave plate (QWP) multiple order retarders, designed for wavelengths of 514 nm and 488 nm respectively. We denote them as QWP514 and QWP488 respectively. Figure 2(a) and (b) show the normalized dataTpar(λ) for these two retarders. Blue and red points denote the data captured with the VIS and NIR spectrometers respectively.
expected in a multiple-order retarder. The number of complete oscillations for QWP488is slightly larger than the total oscillation for QWP514, and the total retardance vari-ation is around 36πradians in the covered spectral range for the two retarders. Another interesting aspect to note is that, although the design wavelength is located at the lower extreme of the measured wavelength range, the oscillatory behavior is maintained up to the other extreme at 1600 nm. This denotes that these retarders operate properly in the entire spectral range, although they are normally commercialized for a single specific designed wavelength.
We added two other curves in Fig. 2(c) and (d). Here the two retarders are placed in between the polarizers. In Fig. 2(c) the two retarders are aligned with the fast axis in the same orientation, while in Fig. 2(d) the sec-ond one is rotated 90° with respect to the first one. Thus, in Fig. 2(c) the total retardance is the addition ϕ(λ) =ϕ1(λ) +ϕ2(λ), while in Fig. 3(d) the total retar-dance is the subtraction ϕ(λ) =ϕ1(λ)−ϕ2(λ). Note that the retardance addition doubles the spectral oscillation. On the contrary, when the retardances are subtracted, a very slow oscillation remains because the two retarders have small thickness difference. A retardance difference of π radians is obtained for the wavelength of
700 nm. Note that this last case mimics a zero-order retarder. And this result shows how the spectral method is a very simple technique to clearly distinguish between multiple-order and zero-order waveplates.
These results show an interesting limiting factor. Note how the amplitude of the oscillations is reduced in the low part of the spectrum. This is due to the resolution limit of the spectrometer. As the retardance varies so fast in this re-gion, so does the spectral transmission. Therefore, the limited size of the pixel detector cannot detect this rapid oscillation, and zero and one transmission are not properly detected.
Nevertheless, these experiments can be used to fit the spec-tral retardance function which can then be adjusted according to a microscopic physical model, as for instance the Cauchy-type series that are usually a good approximation far from the material absorption bands [20]. The experimental curves in Fig. 2(a) and (b) were thus fitted to a numerical simulation of Eq. (1) assuming a spectral dependence ofϕ(λ) as:
φ λð Þ ¼AλþB
λ3þ
C
λ5þDλ: ð5Þ
The first three terms correspond to a third order Cauchy approximation for the refractive indices in Eq. (2), while the
last term provides good results for quartz in the IR region [10]. A numerical search for the constantsA, B,C, andD
that minimize the difference between simulation and ex-perimental data was performed for the two retarders. This is done by numerically evaluating the mean absolute error (MAE) between the normalized transmission experimental data and the simulated data, and seeking for the values that minimize this difference. This was programmed in Micro-soft Excel and was solved with the SOLVER routine, which employs a generalized reduced gradient algorithm (https:// support.microsoft.com/en-us/kb/214115).
Since we have used two quartz waveplates from the same supplier, purchased at the same time, we can assume exactly the same retardance dispersion for the two retarders, with a simple multiplicative factor. Therefore, we have considered the retardance for QWP514 as ϕ514(λ) following the relation in Eq. (5), and we have considered the retardance for QWP488 fol-lows a relationϕ488(λ) =tϕ514(λ), wheretis a multiplicative fac-tor that takes into account the small amount of thickness difference between the two plates. Thus, the numerical fit con-sists in a single search of the A, B, C, and Dconstants for
ϕ514(λ) and the constantt, that simultaneously match for the four curves in Fig. 2. This way we obtain a more confident result than simply fitting the result for a single retarder. Figure 2(a), (b), (c) and (d) show the simulated curves as well, revealing a very good agreement with the experimental data. The corre-sponding spectral retardance functions are shown in Fig. 2(e). The spectral retardance is very similar for the two waveplates, since the thickness difference parameter ist= 0.9657.
Achromatic retarders and Fresnel rhombs
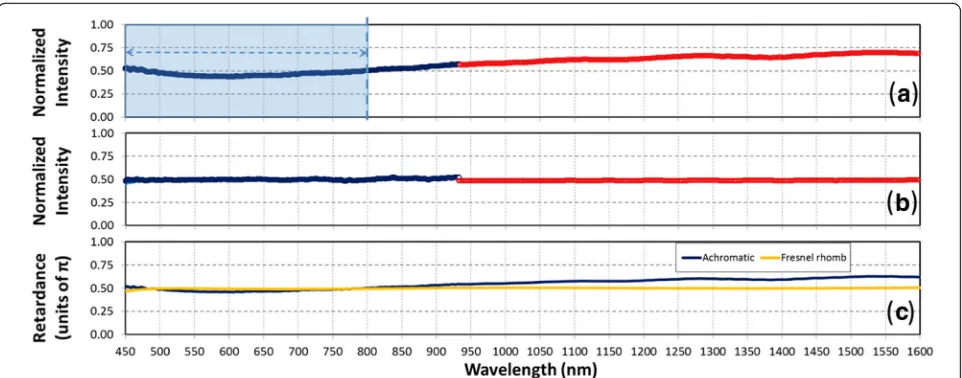
A second interesting example involves using retarders with flat spectral retardance functions. We consider here two ex-amples: an achromatic QWP retarder from Thorlabs, model
AQWP05M-600, designed for the range 400–800 nm, and a quarter-wave Fresnel rhomb also from Thorlabs, model FR600QM, designed for the range 400–1550 nm. Figure 3 shows the corresponding experimental data for the normal-ized intensity transmissionTpar. In these cases, the spectral oscillations present in the previous retarders do not appear, and the normalized transmission is approximately constant at the value Tpar= 0.5, as expected for a QWP. But for the achromatic retarder, this is approximately true only in the spectral range of design, while the Fresnel rhomb shows a much better flat transmission in the wide spectral range. The VIS spectral region between 450 and 800 nm, where the achromatic QWP retarder operates, has been marked in Fig. 3(a). The two extremes of this regions shows the exact normalized transmission of 50 %, and it shows only a small variation for wavelengths in between. On the contrary, for wavelengths larger than 800 nm, the normalized transmission is slowly but progressively increasing, thus showing the devi-ation from the quarter-wave retarddevi-ation at these wavelengths. Figure 3(b) displays the corresponding experimental data for the Fresnel rhomb. In this case a perfect flat normalized transmission Tpar= 0.5 is obtained in the complete spectral range, showing the superior behavior of this retarder in providing a wavelength-independent quarter-wave retardance. Finally, Fig. 3(c) shows the de-rived spectral retardances ϕACRH(λ) and ϕFR(λ) for the achromatic retarder and the Fresnel rhomb respectively.
Liquid-crystal tunable retarders
As a final example we consider a liquid crystal retarder (LCR). These are tunable retarders where the retarder layer is made of nematic liquid crystal, showing max-imum retardance when the device is off and the liquid crystal director is aligned to the plane of the retarder.
When a voltage is applied to the device electrodes, the liquid-crystal director tilts and the effective retardance is reduced.
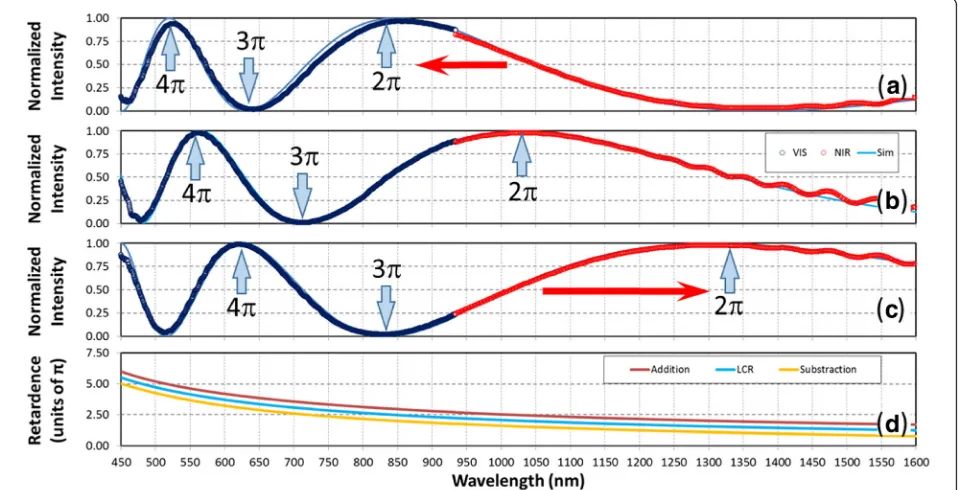
In this work we consider a LCR device from ArcOptix [21]. Figure 4 shows the measurement for this retarder. Again, the oscillatory behavior in the normalized inten-sity as in Fig. 2 is observed. But the number of oscilla-tions is much lower since the LCR is a low-order retarder. Secondary oscillations are observed in the IR range from 1400 to 1600 nm. This is due to a Fabry-Perot interference effect at the LC layer, as studied in Ref. [13]. For simplicity, we ignore here this secondary effect, and we will consider the retarder simpler approximation. A fit of the experimental data to the spectral retardance function in Eq. (5) was performed. The locations of the maxima and minima indicate the wavelengths for which the retardance is an integer multiple of π radians. These points are indicated in Fig. 4(b), beingϕ= 2πfor 1030 nm,ϕ= 3πfor 710 nm, andϕ= 4πfor 560 nm.
However, in order to make a more precise spectral retardance fit, we combined the LCR with the QWP Fresnel rhomb. The reason for this combination is re-lated to the fact that measurements show the maximum accuracy around quarter-wave retardance values (i.e., where the normalized transmission is 50 %) [10, 12]. The QWP Fresnel rhomb introduces an additional π/2 dance that can be added or substracted to the LCR retar-dance depending on their relative orientation. In Fig. 4(a) the LCR and the Fresnel rhomb are oriented such that
their retardances add, and therefore the oscillations are shifted to lower wavelengths. In Fig. 4(b), the LCR is the only retarder in the system. Finally, in Fig. 4(c) the LCR is rotated by 90°, and therefore the retardances subtract. In this case the oscillations shift to higher wave-lengths. In both cases the shift introduced by the Fresnel rhomb transforms the maxima and minima in Fig. 4(b) into points at 50 % transmittance, therefore improving the accuracy at these wavelengths. Note that an equivalent technique has been used to meas-ure the retardance of half-wave retarders with mono-chromatic light [22].
Figure 4(d) shows the retardance that best simul-taneously fits the three curves in Fig. 4(a), (b) and (c). Again, a spectral response given by Eq. (5) is as-sumed for the LCR spectral retardance ϕLCR(λ). The Cauchy dispersion relation assumed in this equation for the refractive indices has been shown to be a good approximation for liquid-crystal materials [23, 24]. Figures 4(b) shows the theoretical curve together with the experimental data, and the agreement is ex-cellent. Figure 4(a) and (c) show the theoretical curves derived using Eq. (1) for ϕLCR(λ) +ϕFR(λ) and ϕLCR(λ)-ϕFR(λ) respectively, again with excellent agreement with the experimental data. The simultan-eous fit of the three curves in Fig. 4 thus provides a very reliable procedure to accurately determine the LCR retardance function.
In the results in Fig. 4, the LCR is off. But LCR de-vices are of interest mainly because the retardance
can be controlled via an applied voltage. Normally, in paral-lel aligned nematic LCR devices, the maximum retardance occurs in the absence of voltage, and the application of voltage reduces the retardance due to the tilt of the liquid-crystal director [7]. Figures 5(a)-(d) show the spectral trans-mittance and retardance for the LCR without applied volt-age, and when a 1.6 KHz square-amplitude signal with polarity inversion is applied, with peak to peak voltages Vpp = 1 V, Vpp = 1.5 V and Vpp = 2 V respectively. The first result that becomes apparent is the shift of the oscillations to the left part of the graphs (lower wavelengths) due to the reduction of the retardance. Because the peak to peak voltage can be tuned continuously, we can follow the shift of the maxima, and therefore identify where integer values ofπradians are obtained, as indicated in the figures.
In Fig. 5(b), (c) and (d), the spectral retardance was derived by fitting the experimental data to a function ϕ(V,λ) =g(V)ϕ(V= 0,λ), where ϕ(V= 0,λ) is the LCR spectral retardance without applied voltage (result in Fig. 4(d)), and g(V) is a voltage transfer function that can take values between 1 and 0, and which allows describing the spectral retardance modulation with a single value [7]. For every voltage, the value g(V) that best fits the experimental data is retrieved, obtaining values g(Vpp=1 V) = 0.732, g(Vpp=1.5 V) = 0.467 and
g(Vpp=1 V) = 0.294 respectively. Note that all cases again show a very good agreement between the experimental data and the numerically fitted curve. The evolution of the spectral retardance with voltage is given in Fig. 5(e). Note that the retardance in Fig. 5(c) (Vpp= 2 V) is slightly less than half of the retardance in Fig. 5(a) (Vpp= 0). We will use these re-sults in the next section.
Spectral birefringent filter
One of the interesting uses of the spectral properties of retarders is their application to build birefringent filters [25], i.e., spectral filters based on the variations in the state of polarization for different wavelengths caused by the birefringence dispersion. They have become more interesting with the development of liquid-crystal tech-nology since they can be tuned, and nowadays we can find commercial tunable spectral filters based on this technology [26, 27]. The successful realization of such filters depends critically on the correct characterization of the spectral retardance of the retarders used to com-pose the filter. Therefore, in order to confirm the validity of the previous results, this last section of the paper shows as an example the classical Lyot-Ohmann (LO) birefrin-gent filter [28] made by combining two LCR retarders.
The LO filter is generated by cascading various polarizer– retarder – polarizer subsystems, where the retarder is ori-ented at 45° relative to the parallel polarizers, and where the retardance in each consecutive subsystem doubles that of the previous subsystem. Each polarizer–retarder–polarizer subsystem generates an oscillatory spectrum, such as those we have presented in the previous sections. A subsystem with double retardance provides a spectrum with doubled oscillations. Therefore, cascading various subsystems gener-ates a maximum transmission only at the wavelengths where all subsystems coincide to have maximum transmission. In order to properly generate the filter, it is important that the retarders are made with the same material, to ensure that all retarders show the same type of retardance dispersion.
We have generated a LO filter by using two LCR de-vices as that calibrated in Fig. 5. The system is therefore composed of a first polarizer, LCR1, a second polarizer, LCR2 and a third polarizer. The three polarizers are ori-ented at 45° to the vertical direction, while the LC dir-ector of the LCR devices is vertically oriented. The advantage of using LCR devices is that the LO filter can be tuned to different wavelengths [29, 30]. And if com-bined with other types of filters is able to provide nar-rowband multispectral tunable filters [31].
Figure 6 shows our experimental results for the LO fil-ter with two stages (LCR1 and LCR2). In this case, since our LCR devices have (only approximately) the same thickness, we have to play with the applied voltage to re-duce the retardance of one of them to become half the retardance of the other. In Fig. 6(a), LCR1 is left without applied voltage (V1= 0), so its transmission between polarizers is that in Fig. 5(a). The device LCR2 is then tuned to provide half the retardance, i.e.,ϕLCR1= 2ϕLCR2.
This is achieved by applying a voltage V2= 2.07 volts, thus yielding a transmission between polarizers as shown in Fig. 6(b). We adjusted the maximum transmittance to be located at the wavelength of 565 nm, the same wavelength where there is a maximum in Fig. 6(a). Therefore, the combination of the two elements in cascade to generate a LO filter provides a single transmission band around 565 nm, as can be seen in Fig. 6(c). Note that the retarder with lower retardance (in this case LCR2) fixes the free spec-tral range of the filter (wavelength range between consecu-tive maxima). In this case, since the retardance of LCR2 must be reduced significantly, only one single maximum is observed in the entire wavelength range from 450 to 1600 nm, and the IR has been completely removed. This type of filter might be useful to highly remove the IR con-tent and only transmit the visible range.
Conclusions
In summary, we have applied a classical spectral tech-nique for measuring the retardance of linear retarders, but in a very wide spectral range from 450 to 1600 nm. For that purpose, we developed an optical system that uses two spectrometers, one for the VIS range and an-other for the NIR range. With this system we measured the spectral retardance function of different types of crystal retarders as well as of LCRs. The measured spec-tral content allows a very simple identification of the type of retarder according to its order (multiple, low or zero-order retarders). Also, the wavelength shifts of the oscillations observed in the spectral transmittance allows a simple identification of situations where the retardance increases or decreases, that can be useful with fixed re-tarders, and specially with variable LCRs.
We have provided some useful tricks to be applied in the fitting procedure of the experimental data in order to derive an accurate spectral retardance function. For instance, the combination of two retarders made of the same material (thus having exactly the same spectral birefringence dispersion) helps to obtain additional curves by adding or subtracting retardance, as we showed in Fig. 3. Or the combination of a retarder under evaluation with a Fresnel rhomb retarder that adds/ subtracts a constant shift of one quarter oscillation, which is useful to achieve an accurate measurement in all the spectral range (in opposition to a single measure-ment, which shows less accuracy at the maxima and minima of the spectral transmittance curve). Finally, we have confirmed the accuracy of the spectral mea-surements by demonstrating the realization of a clas-sical birefringent Lyot-Ohmann filter. As a result of the correct calibration of the spectral retardance of the LCRs involved in the filter, the spectral transmit-tance was predicted with great accuracy.
Funding
This work received financial support from Ministerio de Economía y Competitividad and FEDER funds (grant ref.: FIS2015-66328-C3-3-R). A. Vargas acknowledges financial support from Fondecyt (grant ref.: 1151290).
Authors’contributions
All coauthors contributed to the paper. AM contributed with the realization of the optical system, taking the measurements data, and analyzing them. MMS-L contributed in the design of the experiments, the analysis of the results, and writing the manuscript. PG-M participated in the design of the experiments and in the discussion and analysis of the results. AV participated in the realization of the experimental system, and designed the procedure for taking the experimental data. Finally, IM contributed in the design of the experiments, the analysis of the results, and the preparation of the manuscript. All authors read and approved the final manuscript.
Competing interests
The authors declare that they have no competing interests.
Author details
1Departamento de Ciencia de Materiales, Óptica y Tecnología Electrónica,
Universidad Miguel Hernández, 03202 Elche, Spain.2Departamento de Física y Arquitectura de Computadores, Instituto de Bioingeniería, Universidad Miguel Hernández, 03202 Elche, Spain.3Departament d’Òptica, Universitat de València, 46100 Burjassot, Spain.4Departamento de Ciencias Físicas, Universidad de La Frontera, Temuco, Chile.
Received: 28 July 2016 Accepted: 24 October 2016
References
1. Collett, E.: Field Guide to Polarization. SPIE Press, Bellingham (2005). 2. Zhang, Z., You, Z., Chu, D.: Fundamentals of phase-only liquid crystal on
silicon (LCOS) devices. Light: Sci Appl3, e213 (2014)
3. Davis, C.C.: Lasers and Electro-Optics. Cambridge University Press, Cambridge (2002).
4. Velásquez, P., Sánchez-López, M.M., Moreno, I., Puerto, D., Mateos, F.: Interference birefringent filters fabricated with low cost commercial polymers. Am. J. Phys.73, 357–361 (2005)
5. Sánchez-López, M.M., Vargas, A., Cofré, A., Moreno, I., Campos, J.: Simple spectral technique to identify the ordinary and extraordinary axes of a liquid crystal retarder. Opt. Commun.349, 105–111 (2015)
6. Wu, S.T., Efron, U., Hess, L.D.: Birefringence measurements of liquid crystals. Appl. Opt.23, 3911–3915 (1984)
7. Vargas, A., Donoso, R., Ramírez, M., Carrión, J., Sánchez-López, M.M., Moreno, I.: Liquid crystal retarder spectral retardance characterization based on a Cauchy dispersion relation and a voltage transfer function. Opt. Rev. 20, 378–384 (2013)
8. Nagib, N.N., Khodier, S.A., Sidki, H.M.: Retardation characteristics and birefringence of a multiple-order crystalline quartz plate. Opt. Laser Technol. 35, 99–103 (2003)
9. Emam-Ismail, M.: Spectral variation of the birefringence, group birefringence and retardance of a gypsum plate measured using the interference of polarized light. Opt. Laser Technol.41, 615–621 (2009)
10. Wang, W.: Determining the retardation of a wave plate by using spectroscopic method. Opt. Commun.285, 4850–4855 (2012) 11. Safrani, A., Abdulhalim, I.: Spectropolarimetric method for optic axis,
retardation, and birefringence dispersion measurement. Opt. Eng. 48, 053601 (2009)
12. Abuleil, M.J., Abdulhalim, I.: Birefringence measurement using rotating analyzer approach and quadrature cross points. Appl. Opt.53, 2097–2104 (2014) 13. Vargas, A., Sánchez-López, M.M., García-Martínez, P., Arias, J., Moreno, I.:
Highly accurate spectral retardance characterization of a liquid crystal retarder including Fabry-Perot interference effects. J. Appl. Phys.115, 033101 (2014)
14. Hetch, J.: City of Light: the story of Fiber Optics. Oxford University Press, Oxford (1999).
15. Sordillo, L.A., Pu, Y., Pratavieira, S., Budansky, Y., Alfano, R.R.: Deep optical imaging of tissue using the second and third near-infrared spectral windows. J. Biomed. Opt.19, 056004 (2014)
16. Barbarow, W.: A wave plate for every application. Photonics Spectra43(7), 54–55 (2009)
17. Hariharan, P.: Achromatic and apochromatic half wave and quarter wave retarders. Opt. Eng.35, 3335–3337 (1996)
18. Abuleil, M.J., Abdulhalim, I.: Tunable achromatic liquid crystal waveplates. Opt. Lett.39, 5487–5490 (2014)
19. Mawet, D., Hanot, C., Leanerts, C., Riaud, P., Defréfre, D., Vandormael, D., Loicq, J., Fleury, K., Plesseria, J.Y., Surdej, J., Habraken, S.: Fresnel rhombs as achromatic phase shifters for infrared nulling interferometry. Opt. Express 15, 12850–12865 (2007)
20. Abdulhalim, I.: Dispersion relations for liquid crystals using the anisotropic Lorentz model with geometrical effects. Liq. Cryst.33, 1027–1041 (2006) 21. ArcOptix, Variable phase retarder: http://www.arcoptix.com/variable_phase_
retarder.htm (Visited 2016, June 10th)
22. Wang, Z.P., Li, Q.B., Tan, Q., Huang, Z.J., Shi, J.H.: Novel method for measurement of retardance of a quarter-wave plate. Opt. Laser Technol. 36, 285–290 (2004)
23. Wu, S.T.: Birefringence dispersions of liquid crystals. Phys. Rev. A 33, 1270–1274 (1986)
24. Li, J., Wen, C.H., Gauza, S., Lu, R., Wu, S.T.: Refractive indices of liquid crystals for display applications. J. Displ. Technol.1, 51–61 (2005)
25. Wu, S.T.: Design of a liquid crystal based tunable electro-optic filter. Appl. Opt.28, 48–52 (1989)
26. Meadowlark Optics, Selectable Bandwidth Tunable Optical Filter: http:// www.meadowlark.com/(Visited 2016, June 10th)
27. Thorlabs Inc., Liquid Crystal Tunable Filters: http://www.thorlabs.de/(Visited 2016, June 10th)
28. Yeh, P.: Some applications of anisotropic layered media, Ch. 10 in Optical Waves in Layered Media. John Wiley & Sons (2005).
29. Staromlynska, J., Rees, S.M., Gillyon, M.P.: High-performance tunable filter. Appl. Opt.37, 1081–1088 (1998). https://www.osapublishing.org/ao/abstract. cfm?uri=ao-37-6-1081.
30. Aharon, O., Abdulhalim, I.: Liquid crystal Lyot tunable filter with extended free spectral range. Opt. Express17, 11426–11433 (2009)