Arid Soil Research and Rehabilitation. Volume 8. pp. 19-31 0890-3069/94 S10.00 + .00 Printed in the UK. All rights reserved.
Cottage Cheese (Acid) Whey Effects on
Sodic Soil Aggregate Stability
G. A. LEHRSCH C. W. ROBBINS
USDA-Agricultural Research Service Soil and Water Management Research Unit Kimberly, Idaho, USA
C. L. HANSEN
Department of Nutrition and Food Sciences Utah State University
Logan, Utah, USA
Whey applications reduce a sodic soil's exchangeable sodium percentage (ESP) and sodium adsorption ratio (SAR) and increase its infiltration rate. Whey's effects on aggregate stability (AS), however, have been less well documented. A greenhouse study was conducted to determine: ( I ) AS response to whey additions, (2) the profile depth to which surface-applied whey affected AS, and (3) the relationship between AS and SAR for an illitic soil. Greenhouse lysimeters packed with a Freedom silt loam
(Xerollic Calciorthid) received either 0, 25, 50, or 100 mm of whey (equivalent to 0,
253, 505, and 1010 Mg ha - ' of liquid whey). After drying, the surface 150 mm was removed, mixed, and replaced. Barley (Hordeum vulgare L. `Ludd') was then planted and grown to maturity by irrigating weekly. After harvest, AS was measured by wet sieving. A companion field study was conducted to determine the effects of whey applications and flood irrigations on AS. In Declo silt loam (Xerollic Calciorthid), 2
x 2 m basins received 0, 25, 50, or 100 mm of whey, followed by 100, 75, 50, or 0 mm
of water, respectively. One week later, each basin was cultivated (to z = 100 mm) and smoothed. After four 150-mm irrigations, AS was measured on the 0- to 10-, 10- to 50-, and 50- to 150-mm depth increments. Greenhouse results indicated that AS increased significantly with whey additions, though only in the tilled 0- to 150-mm depth incre-ment. Over two ranges, AS increased linearly with SAR decreases resulting from whey applications. In the upper 50 mm of soil in the field basins, AS also increased linearly from 33 to 75% with whey additions up to 50 mm. Cottage cheese whey improved the
AS of sodic soil horizons into which it was incorporated.
Keywords land reclamation, salinity, sodicity, soil structure, tillage
Received 10 May 1993; accepted 30 July 1993. This article is not subject to U.S. copyright laws.
This article is a contribution from the USDA-ARS, Kimberly, Idaho. The authors thank Heidi Crockett, Larry Freeborn, Paula Jolley, Scott Jones, and Deb Watkins for soil sampling, sample preparation, laboratory analyses, and preliminary data handling. Appreciation is extended to the Western Dairy Foods Research Center for financially supporting a portion of this research.
Address correspondence to Dr. G. A. Lehrsch, USDA-ARS, Soil and Water Management Unit, 3793 N. 3600 E., Kimberly, ID 83341-5076.
The most difficult impediment to the reclamation of sodic soils is slow infiltration into the soil's dispersed, often puddled surface. A sodic soil by definition has a saturation paste extract electrical conductivity (EC e) 4 dS rn-1 and a sodium adsorption ratio (SAR) > 13 (Richards, 1954). High pH (usually > 8.5) and high carbonate ion and sodium concen-trations in the soil solution cause calcium to precipitate and high levels of sodium to be exchanged onto clay particles. This sodium, in turn, causes clays to disperse, soil structure to be destroyed, and soil surfaces to crust. Infiltration rates into and hydraulic conduc-tivities through such soils are very low (Robbins & Gavlak, 1989).
Though the reclamation process can be expensive and difficult, sodic soils can be reclaimed if drainage is available. To reclaim such soils, Na + on the exchange complex must be replaced with another cation, preferably Ca 2+ . Excess Na± is then leached from the soil profile, or at least the crop root zone, by irrigating with low Na + water. Chemical amendments often added to calcareous sodic soils include elemental sulfur, sulfuric acid, or ferrous sulfate. Noncalcareous soils can be reclaimed with gypsum or some other calcium salt. Manure, aged alfalfa (Medicago sativa L.) hay, straw, or sawdust can be added to increase infiltration rates and porosity (Robbins & Gavlak, 1989). All amend-ments must, however, be incorporated into the upper portion of the profile to be effective (Robbins & Gavlak, 1989).
A sodic soil's infiltration rate can be increased and its clay dispersion decreased by adding acidic cottage cheese whey (Jones et al., 1993). Whey is the liquid by-product of cheese production. The production of hard or cheddar-type cheeses generates sweet whey (pH range from 5.8 to 6.6) while the production of soft or cottage cheese generates acid whey (pH 5). The more acidic nature of the latter is a consequence of the addition of either lactic or a mineral acid (equivalent to 3 g of phosphoric acid per kg milk) to coagulate the milk. To reduce expenses, cottage cheese nx- nufacturers commonly utilize bacteria that convert lactose to lactic acid, which, in turn, coagulates the milk. Acid whey has an electrical conductivity (EC) of 6 to 10 dS m -I , an SAR of approximately 3, and contains 40 to 50 g kg-I of readily decomposable organic matter (Robbins & Lehrsch,
1992).
Acid whey, because it is often viewed as a waste product, may be an economically attractive amendment for sodic soil reclamation, providing transportation distances are short. In the US, 1991 production of 366,000 Mg of creamed and low-fat cottage cheese (US Crop Reporting Board, 1992) generated approximately three million Mg of acid whey (Jones et al., 1993). Though most whey is fed to poultry or livestock, a substantial portion is considered a waste product and disposed of in sewage treatment facilities or by land application (Watson et al., 1977), nearly always at a cost to the cheese producer. Acid whey cannot be economically dehydrated; thus, its large volume makes handling and disposal troublesome. Small producers, in particular, find it difficult to market whey and dispose of the remainder (Jones et al., 1993).
Whey Effects on Sodic Soil Aggregate Stability 21
reclaimed site. In addition, micronutrients in the applied whey (Radford et al., 1986) should be available to crops.
Acid whey can also improve the physical condition of sodic soil (Robbins & Lehrsch, 1992). Addition of whey soluble salts to the soil solution should reduce the diffuse double-layer thicknesses of clay domains, thus encouraging clay flocculation (Lehrsch et al., 1993). This improved aggregation will increase the proportion of larger soil pores thereby increasing the flux density of both water and air through the soil profile (Hillel, 1982). Stimulation of aerobic microbiological activity by adding and incorporating whey lactose will produce polysaccharides that will stabilize aggregates (Allison, 1968). Bridges of divalent cations and organic matter (Edwards & Bremner, 1967) will bond soil particles to one another, also increasing aggregate stability.
Problems may occur, though, if too much whey is applied. High whey application rates and/or use of excessively saline irrigation water (EC > 1.2 dS m -1 ) could increase root zone salinity (Jones et al., 1993; Robbins & Lehrsch, 1992; Sharratt et al., 1962). Excessive whey applications could also decrease infiltration rates in the short term due to organic overloading (McAuliffe et al., 1982; Watson et al., 1977) and thus hinder sodium leaching from the profile.
Organic overloading in particular can make management and/or reclamation difficult. Two sweet whey applications, each 200 mm or more, by Watson et al. (1977) decreased infiltration rates by 13 to 67%. McAuliffe et al. (1982) found saturated hydraulic con-ductivities to decrease by approximately 50% within two days after they applied only 35 mm of a dilute sweet whey. The hydraulic conductivities did increase, however, one to three weeks after the second whey application. Additional research on the use of acid whey for reclaiming both saline-sodic and also sodic soils has been recommended (Rob-bins & Lehrsch, 1992).
Application of whey, even to nonsodic soil, has often increased aggregation and improved soil structure. Kelling and Peterson (1981), working in the field on a Wisconsin soil with little or no sodium, found that whey applications of 50 to 600 mm improved aggregation, though the 50-mm rate did so nearly as well as the higher rates. In a greenhouse, an application of 25 mm of whey improved aggregation as much as did an application of 22.4 Mg ha-` of maize (Zea mays L.) stover. Watson et al. (1977) measured up to a four-fold increase in infiltration rates into a fallow, nonsodic soil about three months after a surface application of sweet whey. They attributed the marked infiltration increases to improved soil structure.
This current study is a follow-up investigation to the small column laboratory study of Robbins and Lehrsch (1992). In the 1992 study, aggregate stability tended to increase with acid whey additions, though increasing significantly (from 11 to 22%) only after 80 mm was added. Additional research under cropped and field situations was recommended. The aggregate stability results reported in this paper were obtained via the experiments described by Jones et al. (1993). Changes in salt concentrations, pH, and exchangeable cations, along with some infiltration differences, were reported by Jones et al. (1993). Changes that occurred in aggregate stability as a consequence of whey additions were not presented.
were to: (1) measure aggregate stability response to cottage cheese whey after one grow-ing season; (2) determine the profile depth to which whey applied on the soil surface, then incorporated, affected aggregate stability; and (3) quantify aggregate stability as a function of SAR. The objective of a companion field study was to determine the effects of whey applications and flood irrigations on the aggregate stability of sodic soil.
Materials and Methods
Greenhouse
In a semi–temperature-controlled greenhouse (15 to 35°C), approximately 0.87 m of the A horizon (z = 0-150 mm) of a Freedom silt loam (fine-silty, mixed, mesic Xerollic
Calciorthid) were placed in the bottom of each of twelve 1.22-m deep and 0.30-m
diameter lysimeters. Selected soil physical and chemical properties are given in the second line of Table 1. This soil was selected because of its sodic nature (Robbins, 1986) and low soluble salt content. With very little leaching, the salts are removed and the surface horizon becomes dispersed, characteristic of a sodic soil. The soil, having never been irrigated and in storage since 1987, was sieved through a 6-mm sieve before being placed in each lysimeter. A second lot of Freedom silt loam, retrieved on 10 June 1991 from the original field, was sieved and approximately 0.18 m was added to the top of each lysi-meter. Properties of this lot of soil are also given in Table 1. The lysimeter walls were then tapped to reduce the total soil depth to 1.02 m and achieve a dry bulk density of 1.4 g cm -3 . Each lysimeter thus had a total pore volume of 35 L (equivalent to 485 mm of water).
The cottage cheese whey used contained 1.58 g P, 21 mmol Ca, 3.7 mmol Mg, 16 mmol Na, and 42 mmol K per kg. The EC was 7.7 dS m -1 , the pH was 3.3, and the SAR was 3. The density of the liquid whey, 1.01 g cm - 3 , was nearly identical to that of water. On day 0 (11 June 1991), liquid whey in treatments of 0, 25, 50, or 100 mm, equivalent to 0, 253, 505, and 1010 Mg ha-1 of liquid whey, were surface-applied to randomly chosen lysimeters.
Six days later, a tillage operation was simulated by first removing the crust of whey solids along with the uppermost 150 mm of soil from each lysimeter and allowing it to air-dry. After the solids were thoroughly mixed with the underlying now-dry soil, the mix was crushed to pass a 6-mm sieve, returned to its respective lysimeter, and then vibrated until it settled to its previous depth.
After the soil and whey mix was returned to each lysimeter, an 85-mm preplant irrigation was made. This water (as well as that later applied to the lysimeters) had an SAR of 1.5, EC of 0.41 dS m 1 , and pH of 7.6. On the following day, day 7, barley (Hordeum
vulgare L., cv. Ludd) was planted and later thinned to 11 plants per lysimeter. To each
lysimeter, 10 L of water was added on day 16 and 28, 5 L on day 34, and 10 L on day 41. Thereafter, on days 48, 55, 62, 69, 76, and 83, water was applied to each lysimeter at a rate of 1.25 times the evapotranspiration measured (Robbins & Willardson, 1980) from that lysimeter. The barley from the control and 25-mm whey treatments, after it died due to poor air and water relations, was harvested on day 85. Mature barley was harvested from the 50- and 100-mm whey treatments on day 98. Thereafter, sufficient water was added to each lysimeter to bring its cumulative leachate volume to approximately 0.5 pore volumes (Jones et al., 1993).
ea
Er z
a. O
0 00
a.
7
U 0
U
OD o
O
00
00
0) 1..)
E E E
O 00
Ltj
en rn 00
—
•
N N— 7t-N
C
O , .
Cr
U w
Cn 00 00
— 00 00 00 00
0 0 0 — - N N
N
00 N N
N
O N
N - N
N NO
O
I. V') V") kr)
I
•
IV7
E E '7
O o
-to -o 0
• 1-) 3
u,w
a
O O
U V cl!.)
O tts
00 coo 00
aggregates. Those aggregates were then slowly wetted to a water content of 0.30 g g -1 over a 30-min period using a nonheating vaporizer. Thereafter, they were sieved in distilled water for 3 min (Kemper & Rosenau, 1986; Lehrsch et al., 1991). Aggregate stability was reported as the weight percent of aggregates that remained stable after wet sieving.
In the statistical analysis, a repeated measures design (with soil depth as the repeated measure) was appropriate since, in any particular plot, the aggregate stability measured in one depth increment could well be correlated with the aggregate stability measured in an adjacent depth increment. The experimental design was completely random, with whey depth as the factor of interest and with three replications. Whey means were separated using Fisher's protected LSD test with a significance probability of 5%. When appropriate for an individual depth increment, the response of aggregate stability to whey additions was modeled using simple linear regression. To model the relationship between aggregate stability and SAR, we used piecewise linear regression (Neter et al., 1989) with the minimum residual sums of squares technique (Draper & Smith, 1981) to establish the breakpoint.
Field
The field site, never cultivated nor irrigated, was on a Declo silt loam (coarse-loamy, mixed, mesic Xerollic Calciorthid) near the outlet of Rock Creek Canyon, 14.5 km south of Hansen, Idaho. Selected soil properties are given in Table 1. After rototilling to z = 150 mm, four 2 x 2 m basins were constructed by placing a plastic liner down to the tillage depth around the perimeter of each nonreplicated basin. The liner was supported on its outer side with an earthen dike that allowed ponding of both whey and subsequent irrigations.
On 21 June 1991 (day 0 for the field experiment), shortly after the initial rototilling operation, each basin received 0, 25, 50, or 100 mm of whey, followed by 100. 75, 50, or 0 mm of well water, respectively. The well water had an SAR of 1.7, an EC of 0.7 dS and a pH of 6.6. When the whey and water were applied, burlap bags covered the plots to minimize soil surface disturbance.
Seven days after the whey was applied, each basin was lightly tilled (to z = 100 mm) with a hand cultivator and smoothed to simulate a tillage operation. A flood irrigation of 150 mm of water was applied to each basin on days 11, 20, 27, and 53. For the first, second, and fourth irrigations, the water applied was well water, while for the third irrigation, the water applied was canal water, with an SAR of 0.65, an EC of 0.5 dS m -1 , and a pH of 8.2.
Six days after the last irrigation, the soil was sampled in triplicate from the 0- to 10-. 10- to 50-, and 50- to 150-mm depths in all basins. After measuring the water content of each of these samples. its aggregate stability was subsequently measured using the pro-cedures described above. Aggregate stability changes as a function of the whey applied were examined for each soil depth increment.
Results and Discussion
Greenhouse
0.2
0.8
20 40 60 0
0.0
80
o_- 0.4
CI
0
0.6
0 0 mm WHEY • 25 mm WHEY • 50 mm WHEY
3 100 mm WHEY
Whey Effects on Sodic Soil Aggregate Stability 25
AGGREGATE STABILITY (%)
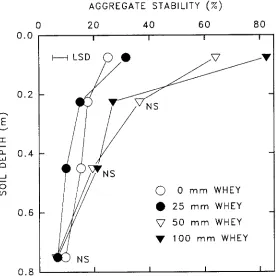
Figure 1. Aggregate stability by soil depth as affected by whey applications to a Freedom silt loam.
significant interaction between the amount of whey applied and soil depth. Thus, each depth increment was studied separately.
For the 0- to 150-mm depth increment, plotted at its midpoint of 75 mm, aggregate stability increased significantly with each addition of whey. Sharratt et al. (1959) found water-stable aggregates to increase in number with weekly whey applications up to 287
Mg ha - though they added a mixture of both sweet and acid whey. The greatest increases in stability occurred when 50 mm or more of whey were applied to the Freedom silt loam (Figure 1).
Whey additions did not significantly affect aggregate stability below 150 mm, the depth of incorporation. Figure 1 does reveal, however, a trend of an increase in aggregate stability in the 0.15- to 0.3- and 0.3- to 0.6-m soil depths when 50 mm or more of whey were applied to the soil surface and then incorporated throughout the uppermost 150 mm of the profile. It may be that sufficient Ca was leached into these horizons to depress the diffuse double layer as well as replace, on the clay's exchange complex, the more highly hydrated Na ions. Once released, the Na was leached. Jones et al. (1993) found that, compared to the control, 21% more Na was leached from the 50-mm whey treatment and 83% more Na from the 100-mm whey treatment. Unfortunately, the data available (Jones et al., 1993) are insufficient to determine if the trend toward increased aggregate stability below 150 mm was caused by lowered SAR, increased EC U , or both. Below 0.6 m (Figure
100
80
60
40
20
0
organic materials from whey decomposition on soil particle surfaces (Lehrsch et al., 1991), where it helped bind primary particles to one another. Microbiological activity, stimulated by the addition and mixing of proteins from the whey (Robbins & Lehrsch, 1992), likely produced polysaccharides that also stabilized aggregates (Allison, 1968). As the soil dried, bonding agents such as CaCO 3 were probably precipitated at particle-to-particle contact points (Lehrsch et al., 1991). Any or all of these processes would tend to increase aggregate stability in the tilled layer (Figures 1 and 2).
Reductions in SAR, ESP, and saturated paste pH with whey additions to this layer (Jones et al., 1993) probably also contributed to this improvement in the soil's physical condition. Based on the pH changes they measured, both the dilute H 3 PO4 and the organic acids from the whey neutralized the Na 2CO 3 and NaHCO3 present in this soil. The decrease in soil solution pH after whey was added probably caused the dissolution of calcium carbonate in the soil (Table 1). This dissolution, along with the Ca added in the whey, increased the Ca concentration in the soil solution. Jones et al. (1993) saw evidence of this increased Ca concentration by measuring decreases in SAR and ESP in the 0- to 150-mm depth increment. Higher soil solution Ca concentrations, in turn, likely increased clay flocculation.
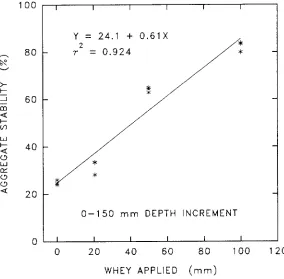
In the upper 150 mm of the profile, aggregate stability increased linearly from 24 to 83% with whey additions (Figure 2). It is possible that, as even more whey is applied, stability would continue to increase but at a decreasing rate, approaching an asymptote near 90%, most likely. For reference, under natural conditions, the aggregate stability of
0 20 40 60 80 100 120
WHEY APPLIED (mm)
Figure 2. Aggregate stability as a function of whey application for the 0- to 150-mm soil depth
100
80
60
40
20
0
Whey Effects on Sodic Soil Aggregate Stability 27
non–air-dried samples of semiarid, nonsodic soils of the US Pacific Northwest seldom exceeds 90% (Bullock et al., 1988; Lehrsch & Jolley, 1992).
Figure 2 suggests that whey applications greater than 100 mm would increase ag-gregate stability above 83%. While that may occur, problems not related to soil structure would likely arise (Jones et al., 1993). Salts may increase, reaching concentrations toxic to vegetation (Sharratt et al., 1962). Moreover, the soil may become organically over-loaded so that suspended solids and/or microbiological growth may clog pores at or near the soil surface, reducing infiltration rates and hydraulic conductivities (McAuliffe et al.,
1982).
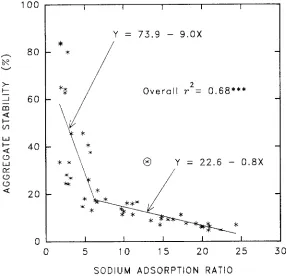
In this study, however, Jones et al. (1993) found that acid whey applications of up to 100 mm did not adversely affect soil hydraulic properties. As alluded to above, SAR calculated using soluble cation concentrations measured in the saturation paste extract of bulk soil samples was inversely related to soil aggregate stability (Figure 3). Aggregate stability changed little until SAR dropped to 6.25. Thereafter, with each unit decrease in SAR, aggregate stability increased by nine percentage points. The piecewise model shown in Figure 3 was highly significant, explaining over 68% of the variation in aggregate stability of the soil from the lysimeters. In contrast, Lebron and Suarez (1992) found no substantive relationship between aggregate stability and SAR within groups of similar soils they studied. Also, Goldberg et al. (1988) found that SAR was a poor predictor of aggregate stability for a group of 34 soils, though they measured aggregate stability in a slightly different manner. In any case, to increase the stability and thus improve the tilth
0 5 10 15 20 25 30 SODIUM ADSORPTION RATIO
Figure 3. Relationship between aggregate stability and sodium adsorption ratio for a Freedom silt
of the high-illite, sodic, Freedom silt loam, a management goal should be to lower SAR below 6, at least to the 2-3 range (Figure 3).
While the establishment of a critical SAR value for an illitic soil was not a specific objective of our study, the findings shown in Figure 3 do suggest that the critical value is much less than the traditional 13. Indeed, Figure 3 indicates that the value may be near six. The critical value, however, may be a function of clay type, among other properties. For soils containing predominantly expanding-lattice, 2:1 clays such as montmorillonite, a value of 13 is reasonable (Richards, 1954), while for soils high in nonexpanding-lattice, 2:1 clays, such as illite, a value closer to 5 may be more appropriate. Oster and Shainberg (1981) noted that illitic soils were more readily dispersed than montmorillonitic soils. Subsequently, Goldberg and Forster (1990) concluded that the illite fraction of a soil's clay content played a dominant role in determining its dispersive behavior with respect to SAR. McIntyre (1979) studied 71 Australian soils, of which 41 contained predominantly illite. He measured physical properties and ESP, which for most arid soils is approxi-mately numerically equal to SAR up to about 30 (Richards, 1954). McIntyre (1979) concluded that an ESP of 5, rather than 15, should be used to denote the value above which physical properties are deleteriously affected. Shainberg et al. (1981) also agreed that an ESP of 5 would be detrimental if high-quality water were to be used to irrigate certain soils. For illitic soils, such as the Freedom in southern Idaho, a critical value near six has been found, in practice, to be appropriate.
Field
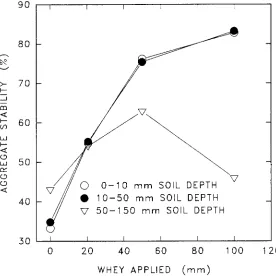
Whey additions followed by simulated tillage and four flood irrigations also increased aggregate stability in the Declo silt loam (Figure 4). Aggregate stability increased linearly with whey additions up to 50 mm for every soil depth increment. A similar linear increase was found in the greenhouse experiment as well (Figure 2).
The increase in aggregate stability per unit of whey applied was greater, however, in the 0- to 10- and 10- to 50-mm soil increments than in the 50- to 150-mm soil increment (Figure 4). In the upper depths, wetting and drying after each of the four flood irrigations was more pronounced throughout the season. These processes encourage both aggregate formation and aggregate stabilization (Lehrsch et al., 1991). Moreover, only the upper half of the 50- to 150-mm soil depth increment was tilled after the whey was applied in June. Thus, in this deepest increment, stability increases were confounded somewhat by non-uniform tillage of the increment. Also, since less water likely moved into this deepest increment, fewer Ca 2+ and Mg2+ ions were added to it.
Unexpectedly, aggregate stability in the 50- to 150-mm soil depth increment de-creased as the whey inde-creased from 50 to 100 mm. Chemical differences are in part responsible. Data from Jones et al. (1993) reveals that, from the 50- to 100-mm whey treatment, EC, decreased by nearly 43%, from 2.1 to 1.2 dS m - I , while the Ca++ con-centration in the saturation extract decreased by more than 32%, from 4.3 to 2.9 mmol Moreover, the K+ concentration in the saturation extract decreased from 8.0 to 5.7 mmol L.-I . Potassium readily replaces exchangeable Na + in many calcareous soils (Robbins & Carter, 1983). Sharratt et al. (1959) also detected deleterious effects of high whey appli-cations (> 85 mm) on the stability of aggregates.
9 0
80
30
70
60
50
40
0 0-10 mm SOIL DEPTH
• 10-50 mm SOIL DEPTH
V' 50-150 mm SOIL DEPTH
Whey Effects on Sodic Soil Aggregate Stability 29
0 20 40 60 80 100 120
WHEY APPLIED (mm)
Figure 4. The aggregate stability of three soil depth increments as affected by whey applications
to basins in a field of Declo silt loam.
(McAuliffe et al., 1982). If the whey application (or rainfall) rate exceeds the conductivity of the profile's most-limiting horizon, anaerobic conditions may arise with attendant reductions in soil aggregation (Watson et al., 1977).
In the uppermost 50 mm of the profile, however, no decreases in aggregate stability were seen with increasing whey applications. Indeed, Figure 4 reveals that aggregate stability was similar in both the 0- to 10- and 10- to 50-mm soil depth increments. Thus, aggregate stability responses to whey are apparently uniform within portions of soil profiles tilled after whey is surface-applied.
Additional research is needed to better characterize the physical and hydraulic prop-erties of both sodic and nonsodic soils to which whey, either acid or sweet, has been applied. Physical property changes occurring at and below the tillage depth are not well known. Whey movement through preferential flow channels deeper into soil profiles is of interest, particularly since groundwater quality could be adversely affected by such flow (Kelling & Peterson, 1981; Peterson et al., 1979). Lastly, to irrigate reclaimed or amended soil efficiently, we must quantify changes in infiltration and unsaturated hydraulic con-ductivity as a consequence of land application of whey.
Conclusions
Third, decreases in SAR as a consequence of whey additions were associated with ag-gregate stability increases, particularly evident after the SAR dropped below 6. In sum-mary, cottage cheese whey appears to be an effective amendment to improve the aggregate stability of sodic soil horizons into which it is incorporated.
References
Allison, F. E. 1968. Soil aggregation-some facts and fallacies as seen by a microbiologist. Soil Science 106:136-143.
Bullock, M. S., W. D. Kemper, and S. D. Nelson. 1988. Soil cohesion as affected by freezing, water content, time, and tillage. Soil Science Society of America Journal 52:770-776.
Draper, N. R., and H. Smith. 1981. Applied Regression Analysis, 2nd ed. John Wiley & Sons, New York.
Edwards, A. P., and J. M. Bremner. 1967. Microaggregates in soils. Journal of Soil Science 18:64-73.
Goldberg, S., and H. S. Forster. 1990. Flocculation of reference clays and arid-zone soil clays. Soil Science Society of America Journal 54:714-718.
Goldberg. S., D. L. Suarez, and R. A. Glaubig. 1988. Factors affecting clay dispersion and aggregate stability of arid-zone soils. Soil Science 146:317-325.
Hillel, D. 1982. Introduction to Soil Physics. Academic Press, New York.
Jones, S. B., C. W. Robbins, and C. L. Hansen. 1993. Sodic soil reclamation using cottage cheese (acid) whey. Arid Soil Research and Rehabilitation 7:51-61.
Kelling, K. A., and A. E. Peterson. 1981. Using Whey on Agricultural Land-a Disposal Alterna-tive. Serial No. A3098. Coop. Ext. Program, Univ. of Wisconsin, Madison, Wisconsin. Kemper, W. D., and R. C. Rosenau. 1986. Aggregate stability and size distribution, pp. 425-442,
in A. Klute, ed.. Methods of Soil Analysis, Part 1. Physical and Mineralogical Methods. 2nd ed. Soil Science Society of America, Madison, Wisconsin.
Lebron, I., and D. L. Suarez. 1992. Variations in soil stability within and among soil types. Soil Science Society of America Journal 56:1412-1421.
Lehrsch, G. A., and P. M. Jolley. 1992. Temporal changes in wet aggregate stability. Transactions of the American Society of Agricultural Engineers 35:493-498.
Lehrsch, G. A., R. E. Sojka, D. L. Carter, and P. M. Jolley. 1991. Freezing effects on aggregate stability affected by texture, mineralogy, and organic matter. Soil Science Society of America Journal 55:1401-1406.
Lehrsch, G. A., R. E. Sojka, and P. M. Jolley. 1993. Freezing effects on aggregate stability of soils amended with lime and gypsum, pp. 115-127, in J. W. A. Poesen and M. A. Nearing, eds., Soil Surface Sealing and Crusting. Catena Verlag, Supplement 24 Cremlingen.
McAuliffe, K. W., D. R. Scotter, A. N. MacGregor, and K. D. Earl. 1982. Casein whey wastewater effects on soil permeability. Journal of Environmental Quality 11:31-34.
McIntyre, D. S. 1979. Exchangeable sodium, subplasticity and hydraulic conductivity of some Australian soils. Australian Journal of Soil Research 17:115-120.
Neter, J., W. Wasserman, and M. H. Kutner. 1989. Applied Linear Regression Models, 2nd ed. Richard D. Irwin, Inc., Homewood, IL.
Oster, J. D., and I. Shainberg. 1981. Predicting the hydraulic properties of sodic soils, pp. 195-201, in Proceedings, International Symposium on Salt Affected Soils, Karnal, India, 18-21 February
1980. Central Soil Salinity Research Institute, Karnal.
Peterson, A. E., W. G. Walker, and K. S. Watson. 1979. Effect of whey applications on chemical properties of soils and crops. Journal of Agricultural and Food Chemistry 27:654-658. Radford, J. B., D. B. Galpin, and M. F. Parkin. 1986. Utilization of whey as a fertilizer replacement
for dairy pasture. New Zealand Journal of Dairy Science and Technology 21:65-72. Richards, L. A., ed. 1954. Diagnosis and Improvement of Saline and Alkali Soils. USDA
Whey Effects on Sodic Soil Aggregate Stability 31
Robbins, C. W. 1985. The CaCO 3 -0O3-H,0 system in soils. Journal of Agronomic Education 14:3-7.
Robbins, C. W. 1986. Sodic calcareous soil reclamation as affected by different amendments and crops. Agronomy Journal 78:916-920.
Robbins, C. W., and D. L. Carter. 1983. Selectivity coefficients for calcium-magnesium-sodium-potassium exchange in eight soils. Irrigation Science 4:95-102.
Robbins, C. W., and R. G. Gavlak. 1989. Salt- and Sodium-Affected Soils. Cooperative Extension Service Bulletin No. 703, College of Agriculture, University of Idaho, Moscow.
Robbins, C. W., and G. A. Lehrsch. 1992. Effects of acidic cottage cheese whey on chemical and physical properties of a sodic soil. Arid Soil Research and Rehabilitation 6:127-134. Robbins, C. W., and L. S. Willardson. 1980. An instrumented lysimeter system for monitoring salt
and water movement. Transactions of the American Society of Agricultural Engineers 23:109-111.
Shainberg, 1., J. D. Rhoades, and R. J. Prather. 1981. Effect of low electrolyte concentration on clay dispersion and hydraulic conductivity of a sodic soil. Soil Science Society of America Journal 45:273-277.
Sharratt, W. J., A. E. Peterson, and H. E. Calbert. 1959. Whey as a source of plant nutrients and its effect on the soil. Journal of Dairy Science 42:1126-1131.
Sharratt, W. J., A. E. Peterson, and H. E. Calbert. 1962. Effect of whey on soil and plant growth. Agronomy Journal 54:359-361.
Summers, K. A., and M. R. Okos. 1982. Partial demineralization of cottage cheese whey using a heat treatment process. Journal of Food Science 47:1645-1648.
US Crop Reporting Board. 1992. Production of dairy products, United States, 1990-1991, p. 6, in The Board, Dairy Products. US Government Printing Office, Washington, D.C.