Influence of Soil Properties and Test Conditions on
Sorption and Desorption of Testosterone
Rui Ma
1; Tian C. Zhang, F.ASCE
2; Shannon L. Bartelt-Hunt, M.ASCE
3; Yong Qi
4; William L. Kranz
5;
Daniel D. Snow
6; Terry L. Mader
7; Charles A. Shapiro
8; David P. Shelton
9; Simon J. van Donk
10;
David D. Tarkalson
11; and Steve Ensley
12Abstract:In this study, batch sorption and desorption experiments were conducted for testosterone using four agricultural soils and five clay minerals. Significant differences in sorption behavior were observed between abiotic and biotic systems. The Freundlich sorption coefficientKfðμg=gÞ=ðμg=mLÞn ranged from 8.53 to 74.46 for soils and from 35.28 to 1,243 for clays. The maximum sorp-tion capacity (μg=g) of soils ranged from 25.25 to 440.61 for soils and from 168.46 to 499.84 for clays. Correlation of the sorption model parameters with the soil properties indicated that both clay content and soil organic matter are important variables in predicting testosterone sorption behavior. Observed testosterone desorption from agricultural soils ranged from approximately 14 to 100% after three desorption cycles, and the desorption percentage decreased as the initial testosterone concentration decreased. It was determined that the temperature, ionic strength, water/soil ratio, and soil depth influenced the sorption and desorption of testosterone. Desorption significantly increased with the soil depth (p<0.05) and with the increase in the water/soil ratio. Temperature had an inverse effect on the sorption capacity of the soils tested. Thermodynamic calculations showed that the enthalpy change (ΔH0) of the soils tested ranged from 12.9 to 20.7kJ=mol, indicating a weak interaction between the testosterone and soil. The authors’results suggest that additional studies on how soil particles with different size fractions affect hormones’fate and transport are needed to determine the potential risk of testosterone leaching or runoff. DOI: 10.1061/(ASCE)EE.1943-7870.0000937.© 2015 American Society of Civil Engineers.
Author keywords:Sorption; Desorption; Hormone; Testosterone; Soil; Fate and transport.
Introduction
As one of the reproductive androgenic hormones, testosterone is produced by different animals in livestock production and thus can be potentially widespread in the environment. As it is a pre-cursor to major estrogens such as estrone and estradiol (Kim et al. 2007), when it is released into the environment, testosterone can metabolize to produce other potent metabolites to cause adverse health impacts to aquatic organisms (Kirk et al. 2002;Lange et al. 2002;Casey et al. 2004). Testosterone is moderately hydrophobic, with a logarithmic octanol-water partition coefficient (LogKow) of approximately 3.32 and a solubility (18–25mg=L) that is greater than most steroid estrogens (Hanselman et al. 2003). Testosterone has been detected in groundwater (Wicks et al. 2004;Swartz et al. 2006;Arnon et al. 2008), surface waters (Koplin et al. 2002), soils (Finlay-Moore et al. 2000), and sediments (Campbell et al. 2006). Although sorption and degradation of testosterone in the environ-ment have been extensively studied (Lee et al. 2003;Casey et al. 2004;Sangsupan et al. 2006; Arnon et al. 2008; Ma 2009), the current knowledge cannot fully explain the occurrence and persist-ence of testosterone in the environment (Bartlet-Hunt et al. 2012; Biswas et al. 2013a).
Sorption of testosterone in soils and sediments has been re-ported to be rapid and linear or slightly nonlinear, with rere-ported linear sorption coefficientKd(liquid and solid phase partition co-efficient) values ranging from 0.5 to 1,200L=kg and Freundlich sorption coefficient (Kf) values ranging from 14 to59.1ðμg=gÞ= ðμg=mLÞn (Lee et al. 2003;Casey et al. 2004; Sangsupan et al. 2006), where bothKdandKf reflect the sorption capacity of tes-tosterone onto soils. Although sorption sometimes reduces the bioavailability of chemicals (Chung et al. 1998), Lee et al. (2003) 1Research Associate, Ecological Environment Institute, Chinese
Academy for Environmental Planning, Ministry of Environmental Protection, 8 Dayangfang BeiYuan Rd., Chaoyang District, Beijing 100012, China.
2Professor, Dept. of Civil Engineering, Univ. of Nebraska—Lincoln at Omaha Campus, Omaha, NE 68182-0178 (corresponding author). E-mail: [email protected]
3Associate Professor, Dept. of Civil Engineering, Univ. of Nebraska— Lincoln at Omaha Campus, Omaha, NE 68182-0178.
4Graduate Research Assistant, Dept. of Civil Engineering, Univ. of Nebraska—Lincoln at Omaha Campus, Omaha, NE 68182-0178.
5Professor, Haskell Agricultural Laboratory, Univ. of Nebraska, Concord, NE 68728.
6Research Associate Professor, Water Sciences Laboratory, Univ. of Nebraska, Lincoln, NE 68583.
7Professor, Haskell Agricultural Laboratory, Univ. of Nebraska, Concord, NE 68728.
8Professor, Haskell Agricultural Laboratory, Univ. of Nebraska, Concord, NE 68728.
9Professor, Haskell Agricultural Laboratory, Univ. of Nebraska, Concord, NE 68728.
10Assistant Professor, West Central Research and Extension Center, Univ. of Nebraska—Lincoln, North Platte, NE 69101.
11Research Soil Scientist, USDA-ARS NW Irrigation and Soils Research Lab, Kimberly, ID 83341.
12Clinician, College of Veterinary Medicine, Iowa State Univ., Ames, IA 50011.
Note. This manuscript was submitted on October 4, 2013; approved on December 8, 2014; published online on January 20, 2015. Discussion per-iod open until June 20, 2015; separate discussions must be submitted for individual papers. This paper is part of theJournal of Environmental
En-gineering, © ASCE, ISSN 0733-9372/04015006(9)/$25.00.
found that, among the soils being tested, most degradation of testos-terone occurred in the soil that had the greatest organic carbon and greatest sorption. However, a study of testosterone sorption in five soils did not identify strong correlations between sorption and soil properties, such as soil texture, surface area, organic matter, and par-ticle size (Casey et al. 2004). It is known that soil microorganisms can degrade testosterone rapidly and effectively, as the half-lives of testosterone range from 0.3 to 7.3 days (Hakk et al. 2005;Lorenzen et al. 2005;Fan et al. 2007). However, limited information is avail-able on the effects of abiotic versus biotic conditions under similar test conditions (e.g., using sterile or nonsterile soils). Furthermore, once testosterone is desorbed from soil and enters the aqueous phase, its natural attenuation should be very slow because its degradation rate is0.001ð1=dÞ(Wicks et al. 2004). These studies imply that both sorption and desorption play important roles in the persistence of testosterone in the environment. To date, however, studies on desorption immediately after sorption of testosterone have been lim-ited. Filling this knowledge gap would allow the authors to estimate the distribution of testosterone in the soil, surface runoff, or leachate under different conditions (e.g., after storm events) and to predict its fate and transport in the soil environment.
The objective of this study was to determine the sorption and desorption of testosterone under several conditions (e.g., different soils/testing materials, soil from different depths, temperature, ionic strength, and water/soil ratio). It is anticipated that the results of this study will be used to predict the fate and behavior of testosterone in the soil-water environment.
Methods and Materials
In this study, the authors used four agricultural soils and five clay materials (three were purchased and two were created from one of the agricultural soils) to conduct the following tests: (1) kinetic tests to identify the equilibrium time that was needed for the sorption and desorption tests, (2) sorption tests for isotherms, and (3) desorp-tion tests. Sorpdesorp-tion tests were conducted under different condidesorp-tions, including (1) at three different temperatures (6, 24, and 35°C), (2) with or without adding the biocide (sodium azide, NaN3), and (3) at different ion strengths. Desorption tests were conducted at 24°C with different ion strengths and water/soil ratios. Details for the kinetic tests are described in Ma (2009), and details of the sorp-tion and desorpsorp-tion tests are described in the following secsorp-tions.
Chemicals and Sorbents
Testosterone, sodium azide, calcium chloride, ethyl ether, and ace-tonitrile were obtained from Sigma-Aldrich (St. Louis, Missouri). All chemicals had a purity >98%. 14C-labeled testosterone was obtained from American Radiolabeled Chemicals (St. Louis, Missouri). Unlabeled testosterone stock solutions (100mg=L) were prepared with high performance liquid chromatography (HPLC)-grade methanol and stored in a −20°C freezer before use;14C-labeled testosterone series of stock solutions with different activity levels of 0.1–50μci were prepared in solutions of methanol and ultrapure water (resistance of 18Ωm) and were stored in a
−4°C refrigerator (Ma 2009).
Soils obtained from North Platte, Nebraska (NP soil) and Haskell Agricultural Lab near Concord, Nebraska (HAL soil) were sampled at three depths (0–15, 15–31, and 31–61 cm) using a Giddings soil probe (Giddings Machine Company, Windsor, Colorado). The NP soil was a Cozad silt-loam soil (coarse-silty, mixed, mesic Fluventic Haplustoll), and the HAL soil was a Nora silty clay loam (fine-silty, mixed, mesic Udic Haplustoll). These soils were used because this study was part of a large project at these
two sites (Bartlet-Hunt et al. 2012;Biswas et al. 2013b;Van Donk et al. 2013). The other two agricultural soils (Iowa Light and Iowa Dark) were obtained from the surface of agricultural fields in Iowa. Iowa Light was a Rinda silty clay loam soil (fine, smectitic, mesic Vertic Epiaqualfs). Iowa Dark was a Dickinson sandy loam soil (coarse-loamy, mixed, superactive, mesic Typic Hapludolls). These soils were chosen because the authors have used them in several other studies and are very familiar with their other properties. These four soils were air-dried and passed a 2-mm sieve before use.
Reference clays (SWy-2 montmorillonite and KGa-1 b kaolin) were purchased from the Source Clay Projects at Purdue University (West Lafayette, Indiana). Wyoming bentonite CG-50 was pur-chased from American Colloid Company, Chicago, Illinois. All clays were used as received.
To extract HAL Clays 1 and 2 from the HAL topsoil (0–15 cm), soil was collected that passed a 2-mm sieve and then was washed three times (with a water/soil ratio of 100 g of soil to 1 L of water) to remove dissolved organic matter (DOM). For each washing, the soil slurry was allowed to settle for 24 h, and then the supernatant was decanted. After the third wash, the sediment was mixed with 1 L of tap water for resuspension and then allowed to settle. The supernatant of this slurry was siphoned and collected as Clay 1 after 4 h of settling or as Clay 2 after 12 h of settling. The supernatant containing Clay 1 or 2 was then air-dried at 23–1°C. The particle size distribution was 0.9–2 μm for Clay 1 and 0.6–0.9 μm for Clay 2, as per the measurements with a Zetasizer (Nano ZS90, Malvern, U.K.). Table1provides the selected properties of the soil and clays.
Sorption and Desorption Tests
Sorption experiments were conducted at 6, 24, and 35°C on all the soils and clays. Sorption isotherms were conducted in 10-mL glass reactors. Each reactor was loaded with 1 g of dry soil or 0.05 g of clay and 10 mL of ultrapure water containing 0.01M CaCl2. Treatments were created by combining unlabeled and14C-labeled testosterone to form a desired initial testosterone concentration (100ng=L–2mg=L). Sorption experiments were conducted at
Table 1.Selected Properties of Soils and Clays
Soilaor clay name OMb (%) Clay (%) Silt (%) Sand (%) Sa (m2=g)c
CECd (meq=100g)
HAL 0–15 2.2 20 62 18 12.61 13.9
HAL 15–31 2 20 65 15 13.52 16.9
HAL 31–61 1.3 25 62 13 17.40 17.5
NP 0–15 1.8 12 55 33 13.37 12.3
NP 15–31 1.3 10 60 30 14.12 13.2
NP 31–61 0.7 10 55 35 13.22 15.8
Iowa Dark 1.11 10 13 77 1.71 13.8
Iowa Light 1.21 35 60 5 23.03 36.2
Kaolin 0 NAe NA NA 10.05 2.0
Montmorillonite 0 NA NA NA 31.82 76.4
Bentonite 0 NA NA NA NA 85.2
HAL Clay 1 1.97 100 0 0 52.21 NDf
HAL Clay 2 1.97 100 0 0 77.66 ND
aSoil name: HAL = Nora silty clay loam (fine-silty, mixed, mesic Udic Haplustoll); NP = Cozad silt-loam soil (coarse-silty, mixed, mesic Fluventic Haplustoll); Iowa Dark = Dickinson sandy loam soil; Iowa Light = Rinda silty clay loam soil.
bOM = organic matter. cS
a= surface area.
dCEC = cation exchange capacity. eNA = not applicable.
fND = not determined.
the ionic strengths of 0.06–1 M (adjusted with NaCl). In the abiotic experiments,200mg=L NaN3was added to the reactors. The batch reactors were sealed with Teflon-lined caps and rotated top to bottom (360°=5s) for certain time intervals (e.g., 24 or 48 h). At the end of the time interval, triplicate reactors were removed and centrifuged. A 500-μL aliquot was removed from each reactor and placed in a 20-mL scintillation vial with a 5-mL Ultima Gold (PerkinElmer, Waltham, Massachusetts) scintillation cocktail to test for radioactivity. Radioactivity levels were determined by scin-tillation counting using a 2,500-TR liquid scinscin-tillation counter (Packard, Downers Grove, Illinois). The difference between the in-itial and final radioactivity in the liquid phase was attributed to sorption. The experimental data were fit to linear, Freundlich, and Langmuir isotherm models. Table2provides the results.
Prior to batch studies, kinetic sorption experiments were per-formed to determine the required equilibration period. An equili-bration period of 24 h was used for experiments with NP and HAL soils and 48 h for experiments with clays. After sorption, the sorbent phase was extracted using the method described in Lorenzen et al. (2005). The extracts and the liquid phase were an-alyzed using a high-performance liquid chromatograph (Waters Alliance 2695 HPLC, Waters Corporation, Milford, Massachusetts) and a mass spectrometer (Finnegan LCQ Ion Trap MS, Thermo Scientific, San Jose, California). Further details of the analytical methods are provided in Ma (2009).
Desorption tests were conducted at 24°C by first decanting the liquid phase in the batch reactor that had reached equilibrium in the sorption tests and then adding 10 mL of a solution containing 0.01 M of CaCl2and 200mg=L of NaN3. Seven different initial concentrations (100ng=L–2mg=L) were used to investigate the effect of the initial testosterone concentration on the desorption percentage. The reactors were equilibrated for 24 h—the time for reaching one-cycle desorption equilibrium as tested in the
kinetic study described by Ma (2009). This will be referred to as the Cycle 1 desorption test. After the Cycle 1 test, the liquid phase in the reactor was replaced with 10 mL of a solution con-taining 0.01 M of CaCl2 and 200mg=L of NaN3 for the Cycle 2 test. In this study, three cycles of desorption tests were conducted for each reactor. After each cycle, the reactors were centrifuged (2,000 g for 40 min), and an aliquot of 500μL was taken to test for radioactivity.
At the end of the desorption experiments, the solid phase remain-ing in the reactor was extracted and analyzed by high performance liquid chromatography/mass spectrometry (HPLC/MS) to confirm the testosterone mass balance. The effects of ionic strength (0.06– 1.0 M, adjusted with NaCl) and the water/soil ratio (0.1–1g=mL) on 14C-labeled testosterone desorption were also investigated to allow the development of a family of desorption curves.
Data Analysis
The data obtained from the sorption and desorption tests were fit to linear, Freundlich, and Langmuir models
Linear∶S¼KdC ð1Þ
Langmuir∶S¼qmC=ð1=bþCÞ ð2Þ
Freundlich∶S¼KfCn ð3Þ
where S = concentration of the hormone adsorbed on the soil (mg=g);Kd= linear sorption coefficient (L=g);C= hormone aque-ous concentration (mg=L); qm = maximum sorption capacity (μg=g); b = sorption equilibrium constant (L=mg); Kf = Freundlich sorption coefficient [ðμg=gÞ=ðμg=mLÞn]; and n = Freundlich intensity parameter (unitless). The temperature Table 2.Parameters of Testosterone Isotherm Fitted by Three Models
Soil
Linear Langmuir Freundlich
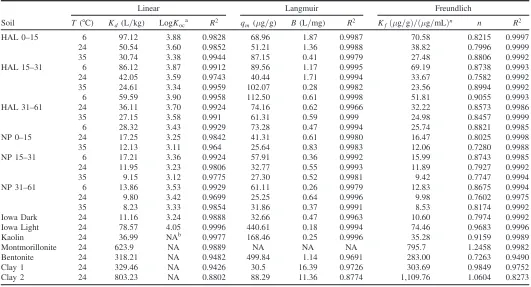
T (°C) Kd(L=kg) LogKoca R2 qm(μg=g) B(L=mg) R2 Kfðμg=gÞ=ðμg=mLÞn n R2
HAL 0–15 6 97.12 3.88 0.9828 68.96 1.87 0.9987 70.58 0.8215 0.9997
24 50.54 3.60 0.9852 51.21 1.36 0.9988 38.82 0.7996 0.9999
35 30.74 3.38 0.9944 87.15 0.41 0.9979 27.48 0.8806 0.9992
HAL 15–31 6 86.12 3.87 0.9912 89.56 1.17 0.9995 69.19 0.8738 0.9993
24 42.05 3.59 0.9743 40.44 1.71 0.9994 33.67 0.7582 0.9992
35 24.61 3.34 0.9959 102.07 0.28 0.9982 23.56 0.8994 0.9992
6 59.59 3.90 0.9958 112.50 0.61 0.9998 51.81 0.9055 0.9993
HAL 31–61 24 36.11 3.70 0.9924 74.16 0.62 0.9966 32.22 0.8573 0.9986
35 27.15 3.58 0.991 61.31 0.59 0.999 24.98 0.8457 0.9999
6 28.32 3.43 0.9929 73.28 0.47 0.9994 25.74 0.8821 0.9985
NP 0–15 24 17.25 3.25 0.9842 41.31 0.61 0.9980 16.47 0.8025 0.9998
35 12.13 3.11 0.964 25.64 0.83 0.9983 12.06 0.7280 0.9988
NP 15–31 6 17.21 3.36 0.9924 57.91 0.36 0.9992 15.99 0.8743 0.9985
24 11.95 3.23 0.9806 32.77 0.55 0.9993 11.89 0.7927 0.9992
35 9.15 3.12 0.9775 27.30 0.52 0.9981 9.42 0.7747 0.9994
NP 31–61 6 13.86 3.53 0.9929 61.11 0.26 0.9979 12.83 0.8675 0.9994
24 9.80 3.42 0.9699 25.25 0.64 0.9996 9.98 0.7602 0.9975
35 8.23 3.33 0.9854 31.86 0.37 0.9991 8.53 0.8174 0.9992
Iowa Dark 24 11.16 3.24 0.9888 32.66 0.47 0.9963 10.60 0.7974 0.9992
Iowa Light 24 78.57 4.05 0.9996 440.61 0.18 0.9994 74.46 0.9683 0.9996
Kaolin 24 36.99 NAb 0.9977 168.46 0.25 0.9996 35.28 0.9159 0.9989
Montmorillonite 24 623.9 NA 0.9889 NA NA NA 795.7 1.2458 0.9982
Bentonite 24 318.21 NA 0.9482 499.84 1.14 0.9691 283.00 0.7263 0.9490
Clay 1 24 329.46 NA 0.9426 30.5 16.39 0.9726 303.69 0.9849 0.9752
Clay 2 24 803.23 NA 0.8802 88.29 11.36 0.8774 1,109.76 1.0604 0.8273
aCalculated using
Kd=ðOM=1.72Þ. bNA = not applicable.
influence on the ΔG0, ΔH0, and ΔS0 values is calculated as follows (Ma 2009):
ΔG0¼−RTlnKd ð4Þ
ΔG0¼ΔH0−TΔS0 ð5Þ
whereΔG0(kJ=mol),ΔH0(kJ=mol), andΔS0(kJ=mol) = Gibbs free energy change, enthalpy change, and entropy change, respec-tively, in the sorption process;T= temperature (K); andR= ideal gas constant [J=ðK molÞ]. The data were tested for significant dif-ferences using a Student’s t-test for two sample means with unequal variances. Two-tail p values of less than 0.05 were considered significant (Ma 2009).
Results and Discussion
Sorption Isotherms
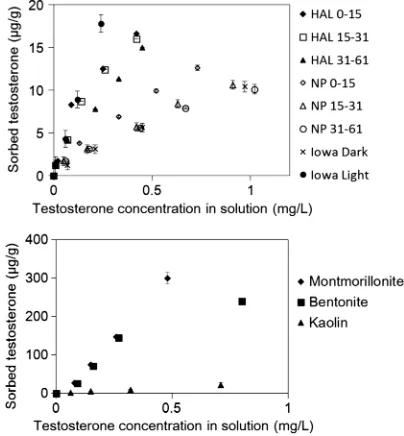
The best-fit lines for testosterone sorption to NP and HAL soils and clays were determined to be slightly nonlinear (Fig.1and Table2). The Freundlich sorption coefficient Kf ranged from 8.53 to 74.46ðμg=gÞ=ðμg=mLÞnfor soils and from 35.28 to1,243ðμg=gÞ= ðμg=mLÞnfor clays (Table2). These results are consistent with the Freundlich coefficients of 10.3 to42ðμg=gÞ=ðμg=mLÞnfor testos-terone sorption on a silt-loam soil reported by Gineys et al. (2012) and 59.1ðμg=gÞ=ðμg=mLÞn reported by Das et al. (2004). The maximum sorption capacity of soils calculated from the Langmuir model ranged from 25.25 to440.61μg=g for soils and from 168.46 to499.84μg=g for clays (Table2). Lee et al. (2003) reported that the Drummer soil (silt loam) had the highest sorption capacity among the investigated soils because of its fine texture, resulting in a high surface area, which is consistent with the authors’findings that clay and silt loam have a relatively higher sorption capacity on testosterone compared with sandy loam. Also, the clays were ob-served to have a larger testosterone sorption capacity when com-pared to the whole soils, which is likely attributable to the larger surface area of clays compared to other soil fractions. Clay 2 and montmorillonite exhibited very high testosterone sorption capacity
(highKf), which is possibly due to testosterone diffusing into the interlamellar spaces of the clay (Shareef et al. 2006).
Because testosterone is neutral in aqueous solutions at neutral pH ranges, the cation exchange capacity (CEC) is not believed to affect sorption. This is verified by the low correlation coefficient (R2¼0.1465) for a linear regression between CEC andKf (data not shown). The authors also observed variable logKocvalues as a function of soil type, indicating that other soil properties, such as clay or sand content and organic matter (OM), might be important in predicting testosterone sorption. Regression analysis indicated that sorption (Kf) is related to sand (R2¼0.8472; inverse corre-lation), clay (R2¼0.7999), and OM (R2¼0.5200). The positive correlation between clay content and testosterone sorption is pre-sumably due to the partitioning of testosterone onto clay mineral surfaces through hydrophobic interactions with siloxane (─Si─O─Si─) groups (van Emmerik et al. 2003). Interestingly, the Kf values of Clays 1 and 2 are much greater than those of the HAL 0–15 soil, which indicates the potential of colloid-facilitated transport of testosterone if the clay particles are released into runoff or leachate during a storm event.
Table3summarizes the recovery of testosterone and the forma-tion of a testosterone metabolite 4-androstene-3,17-dione in sorp-tion experiments conducted with and without a biocide (NaN3). The amount of the testosterone metabolite detected in the abiotic reactors was less than that in the biotic reactors. Microbial trans-formation of testosterone via dehydrogenation and potentially by actinobacteria has been previously reported in soils and livestock manure (Das et al. 2004;Yang et al. 2009). Additionally, the mass recovery of testosterone and metabolites is greater in the abiotic reactors (95–97% recovery) and is indicative of good quality control.
Desorption
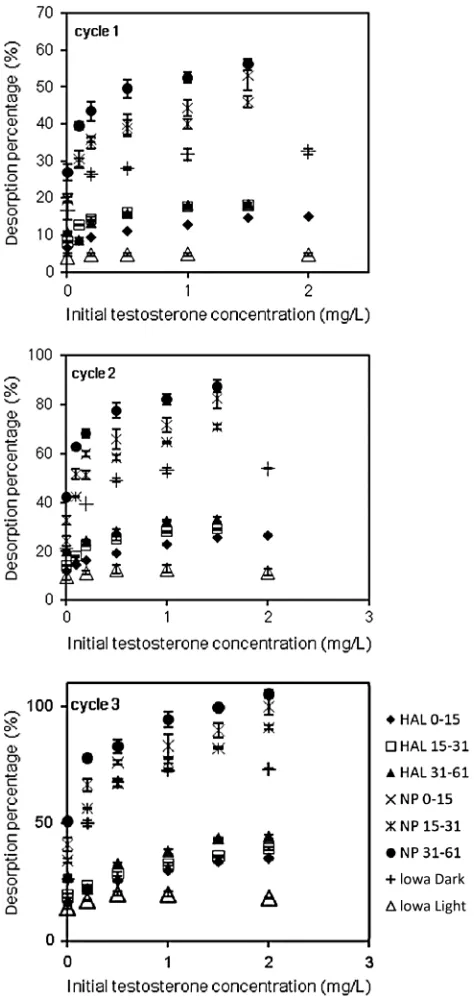
After Cycle 3, the accumulated desorption percentages ranged from 16.3 to 44.3% for the HAL soils, from 34.3 to 102.4% for the NP soils, from 26.2 to 72.2% for the Iowa Dark soil, and from 14.1 to 18.2% for the Iowa Light soil (Fig.2). Generally, desorption per-centages with the same initial concentration are in a decreasing order as NP soils>Iowa Dark soil>HAL soils>Iowa Light soil, which is consistent with the reverse order of the sorption strength. For all soils, the testosterone desorption percentages decreased significantly with a decrease in the initial liquid testosterone concentration (Fig.2), which indicates the necessity of using a wide range of testosterone concentration to conduct sorption and desorp-tion tests, particularly at low concentradesorp-tions. Reported testosterone concentrations in the environment are in the range of5–2,520ng=L (Kolpin et al. 2002; Das et al. 2004; Bhandari et al. 2009). Table 3.Total Mass of 4-Androstene-3,17-Dione and Testosterone after Sorption Equilibrium and Mass Recovery with and without Adding NaN3 in Batch Reactors
Test condition
4-androstene-3, 17-dione (μg)a
Testosterone (μg)b
Mass recovery (%)
HAL 0–15 with NaN3 1.66−0.01c 17.41–0.32 95.09–1.65 HAL 0–15 no NaN3 6.65–0.24 5.79–0.14 66.60–1.22 NP 31–61 with NaN3 0.56–0.03 18.64–0.10 97.19–0.14 NP 31–61 no NaN3 1.89–0.06 13.37–0.09 90.52–0.29
aAfter sorption equilibrium, total 4-androstene-3,17-dione mass in both liquid and solid phase.
bAfter sorption equilibrium, total testosterone mass in both liquid and solid phase.
cStandard deviation ( n¼3).
Fig. 1.Sorption isotherms of testosterone to soils and clays at 24°C; error bars indicate1standard deviation (n¼3)
Therefore, the results of the authors’desorption tests indicate that testosterone desorption in the environment will be relatively low, particularly if the testosterone is sorbed in the top soil or by soils with a high clay content. For example, the Iowa Light soil had relatively low desorption percentages (Fig.2) because it had the lowest sand content and the greatest clay content among the soils in the experiment. The Iowa Dark soil had lower desorption than the NP 31–61 soil (Fig.2), which may be due to the greater OM content of the Iowa Dark soil. A greater OM content is believed to
cause stronger binding of testosterone (Carroll et al. 1994), leading to less desorption.
Desorption from the NP soils was greater than from the HAL soils at each initial concentration. This was the result of the NP soils having more sand content than the HAL soils (Table1), and sorp-tion on the sandy soil tends to be more reversible. Addisorp-tionally, the desorption percentages significantly increased with the soil depth (p<0.05). This may be because the OM content decreases with increasing depth. One exception is that there are no significant differences in the desorption percentages (p ranged from 0.052 to 0.134) between the NP 0–15 and 15–31 soil (Fig.2). While the NP 0–15 soil had a greater OM content than the NP 15–31 soil, the NP 15–31 soil had less sand content (Table1).
The desorption hysteresis coefficient (H) is calculated based on the ratio of the desorption and sorption isotherm parameters (H¼nd=ns) (Yuan and Xing 2001), where nd and ns are the Freundlich intensity parameter nfor desorption and sorption, re-spectively. In general, ifH≈1, there is no (or very limited) desorp-tion hysteresis in the sorpdesorp-tion/desorpdesorp-tion processes, and a larger H value (toward 1) corresponds to a lower degree of hysteresis. According to the literature, desorption hysteresis is usually due to (1) irreversible binding of chemicals to the OM or clay mineral of soil aggregates (Bhandari et al. 1996), and (2) entrapment of sorbed molecules in mesoporous and microporous structures within mineral structures and the OC matrix of soil aggregates (Carroll et al. 1994; Farrell et al. 1994; Weber et al. 1998). A desorption process with an Hvalue much lower than 1 must be associated with irreversible thermodynamic change, which is often dictated by the location difference of the OM and mineral (Yuan and Xing 2001;Li et al. 2013). In this study, no desorption hysteresis was found (Table4) for all the soils (H≈1), except Iowa Light, which had anHvalue of approximately 0.7509 and thus had desorption hysteresis. To the authors’knowledge, noHvalues of testosterone have been reported previously, but Li et al. (2013) re-ported that the desorption hysteresis of17α-ethinyl estradiol (EE2) was observed in all sorbents withHvalues of 0.173–0.673. While most of the authors’Hvalues are close to 1, the authors did observe that sorption is partially reversible (14–100% after three desorption cycles) (Fig.2), indicating that it is possible for the authors’soils (except Iowa Light) to achieve 100% desorption with more desorp-tion cycles. The environmental implicadesorp-tion of this result is that, for these soils, testosterone transport is more likely to occur under the condition of frequent storm events.
Impact of Environmental Factors
Temperature has an inverse effect on the sorption capacity of the soils tested (Fig. 3), even though Langmuir’s maximum sorption Table 4.Freundlich Parameters for Sorption and Desorption of Soils at 24°C and Desorption Hysteresis
Soil
Parameter
LogKoc Kfs ns Kfd nd Ha
HAL 0–15 3.60 38.82 0.7996 44.53 0.8068 1.0090 HAL 15–31 3.59 33.67 0.7582 42.87 0.8185 1.0795 HAL 31–61 3.70 32.22 0.8573 41.50 0.9349 1.0905 NP 0–15 3.25 16.47 0.8025 20.97 0.8293 1.0334 NP 15–31 3.23 11.89 0.7927 14.62 0.8118 1.0241 NP 31–61 3.42 9.98 0.7602 9.77 0.7969 1.0483 Iowa Dark 3.24 10.60 0.7974 17.98 0.8762 1.0988 Iowa Light 4.05 74.46 0.9683 212.45 0.7271 0.7509
aDesorption hysteresis
H¼nd=ns.
Fig. 2.Desorption percentages of testosterone from soils after deso-rption Cycles 1, 2, and 3 at 24°C as a function of varied initial testos-terone concentrations that are used in previous sorption tests; percentages were calculated based on the amount of testosterone pre-sorbed in the sorption step; error bars stand for1standard deviation (n¼3)
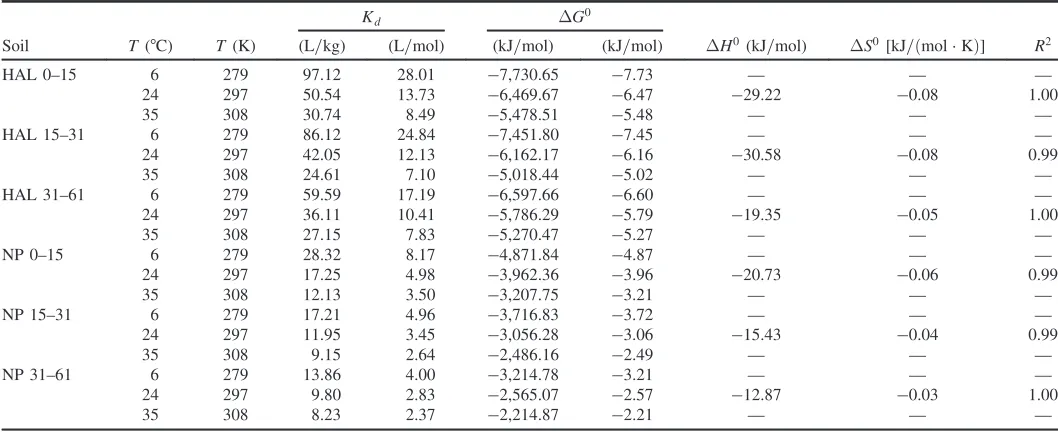
capacity,qm, increases with temperature (Table2). The linear sorp-tion coefficient Kd and Freundlich sorption coefficient Kf de-creased significantly (p ranged from 0.0021 to 0.0412 for Kf) with an increasing temperature of between 6 and 35°C (Table2), with the exception of the NP 31–61 soil at 24 and 35°C (p¼0.061). Table5indicates that all ΔH0 values are negative, indicating that sorption of testosterone to soil is exothermic. Physisorption is typically associated with ΔH0 in the range of 5–20k=mol and is believed to be an overall weak interaction. Chemisorption is typically associated with much higher enthalpy values in the range of100–400kJ=mol and is regarded as a strong
binding (Xu et al. 2008). The enthalpy change data of the NP soil and HAL 31–61 soil were in the range of 12.9–20.7kJ=mol (Table5), which suggests that a physical sorption of testosterone dominates in the sandy NP soil. Calculated enthalpy changes for the HAL 0–15 and HAL 15–31 soils were approximately 30kJ=mol (Table5), which suggests that both physical and chemi-cal sorption processes were present, but physichemi-cal sorption appeared to be dominant.
Soil depth has an inverse effect on the sorption of testosterone for both the HAL and NP soils (Fig.1and Table2), resulting in a decrease inKfwith an increase in soil depth [Fig.4(a)]. The top
(a) (b) (c)
(d) (e) (f)
Fig. 3.Sorption isotherms of testosterone at 6, 24, and 35°C in (a) HAL 0–15; (b) HAL 15–31; (c) HAL 31–61; (d) NP 0–15; (e) NP 15–31; (f) NP 31–61 soils
Table 5.Calculation of Thermodynamic Parameters
Soil T(°C) T (K)
Kd ΔG0
ΔH0 (kJ=mol) ΔS0 [kJ=ðmol · KÞ] R2
(L=kg) (L=mol) (kJ=mol) (kJ=mol)
HAL 0–15 6 279 97.12 28.01 −7,730.65 −7.73 — — —
24 297 50.54 13.73 −6,469.67 −6.47 −29.22 −0.08 1.00
35 308 30.74 8.49 −5,478.51 −5.48 — — —
HAL 15–31 6 279 86.12 24.84 −7,451.80 −7.45 — — —
24 297 42.05 12.13 −6,162.17 −6.16 −30.58 −0.08 0.99
35 308 24.61 7.10 −5,018.44 −5.02 — — —
HAL 31–61 6 279 59.59 17.19 −6,597.66 −6.60 — — —
24 297 36.11 10.41 −5,786.29 −5.79 −19.35 −0.05 1.00
35 308 27.15 7.83 −5,270.47 −5.27 — — —
NP 0–15 6 279 28.32 8.17 −4,871.84 −4.87 — — —
24 297 17.25 4.98 −3,962.36 −3.96 −20.73 −0.06 0.99
35 308 12.13 3.50 −3,207.75 −3.21 — — —
NP 15–31 6 279 17.21 4.96 −3,716.83 −3.72 — — —
24 297 11.95 3.45 −3,056.28 −3.06 −15.43 −0.04 0.99
35 308 9.15 2.64 −2,486.16 −2.49 — — —
NP 31–61 6 279 13.86 4.00 −3,214.78 −3.21 — — —
24 297 9.80 2.83 −2,565.07 −2.57 −12.87 −0.03 1.00
35 308 8.23 2.37 −2,214.87 −2.21 — — —
Note:R2 = linear fitting parameters of equation.
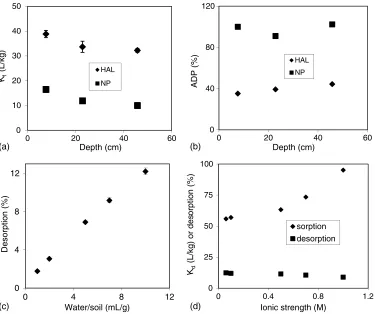
15 cm of soil had the greatest sorption capacity. All depths were significantly different from each other (p<0.05) regarding sorption. In contrast, Fig.2shows that the desorption percentages significantly increased with the soil depth (p<0.05). Fig. 4(b) shows that, for the HAL soil, the accumulated desorption percent-age (ADP) after three desorption test cycles increased with soil depth. One exception was noted between the NP 0–15 and NP 15–31 soils, as the NP 15–31 soil had less sand content than the NP 0–15 soil (Table1). Therefore, both OM and soil compo-nents affect the sorption and desorption of testosterone. Fig.4(c) shows that the water/soil ratio was another important factor; when it increased, desorption increased almost linearly, indicating a potential risk of testosterone leaching or surface runoff. Sorption increased with an increase in ion strength, while the opposite oc-curred for desorption [Fig.4(d)]. This may be due to the salting-out effect—that is, when the ion strength increases, the solubility of testosterone in the solution decreases, resulting in an increase in sorption.
Environmental Implications
To the authors’ knowledge, no previous studies have evaluated both the sorption and desorption of testosterone in soils. Never-theless, this study may be viewed as a preliminary study, as the results of this study still cannot be utilized to explicitly define the fate and transport of testosterone or other hormones in different environmental settings. For example, it is unclear how soil par-ticles (e.g., clay) with high sorption capacities of hormones affect
the hormones’ fate and transport. Factors such as soils or clay minerals from different sources, soil depth, temperature, ionic strength, and the water/soil ratio are very important in determining the fate and transport of testosterone in the environment. The au-thors’results indicate that the topsoil had a greater sorption capac-ity than the subsurface soil because of the higher OM content in the topsoil; deeper soils have less sorption and tend to desorb more testosterone. Therefore, if testosterone penetrates through the topsoil (e.g., 0–15 cm), it might have greater potential to pass through the deeper soil and hence leach to the groundwater. Tem-perature increases may decrease the soil sorption of testosterone and therefore increase the potential of testosterone leaching. Under field conditions, the ionic strength in the soil/water system may be lower than that used in the lab (0.061 M), especially during a storm event, which decreases sorption and increases desorption of testosterone. The water/soil ratio in the laboratory studies tended to be greater than that in field conditions. However, in a storm event, the water/soil ratio will increase, which may in-crease the concentration of testosterone in surface runoff or leachate.
Conclusions
This study provides information on the sorption and desorption of testosterone onto and from soils and clay minerals under the influ-ence of several factors. The Freundlich sorption coefficient Kf [ðμg=gÞ=ðμg=mLÞn] ranged from 8.53 to 74.46 for soils and from 0
10 20 30 40 50
0 20 40 60
Kf
(L/kg)
Depth (cm) (a)
HAL
NP
0 40 80 120
0 20 40 60
ADP (%)
Depth (cm) (b)
(c) (d)
HAL
NP
0 4 8 12
0 4 8 12
Desorption (%)
Water/soil (mL/g)
0 25 50 75 100
0 0.4 0.8 1.2
Kd
(L/kg) or des
orption (%)
Ionic strength (M) sorption desorption
Fig. 4.Effects of (a) the soil depth (7.62, 22.86, and 45.72 cm) onKf(the Freundlich sorption parameter); (b) the soil depth on ADP (after three cycles of desorption tests, %) of NP soils at 24°C; (c) the water/soil ratio on testosterone desorption; (d) ion strength on testosterone’s sorption (represented by the soil-water distribution coefficientKd) and desorption (represented by % of one-cycle desorption test); error bars stand for standard deviation (n¼3)
35.28 to 1,243 for clays. The maximum sorption capacity (μg=g) of soils ranged from 25.25 to 440.61 for soils and from 168.46 to 499.84 for clays. The sorption mechanism is believed to be domi-nated by a combination of hydrophobic partitioning into OM domains and sorption onto soil mineral surfaces. In general, tem-perature has an inverse effect on the sorption capacity of the soils tested. On the basis of the interpretation of the thermodynamic data, the interaction between soil and testosterone may be a weak physisorption supplemented by a strong chemisorption. Soil depth has an inverse effect on the sorption of testosterone for both the HAL and NP soils. The top 15 cm of soil had the greatest sorption capacity, andKf decreased with the soil depth. A large portion of testosterone sorption was found to be reversible based on three cycles of desorption—14 to 100% of the adsorbed testosterone desorbed from the tested soils. Sandy soils had greater potential for testosterone desorption. In addition, more sorbed testosterone in the solid phase will lead to a greater desorption percentage. The desorption percentage decreased as the initial testosterone concentration decreased. Desorption significantly increased with the soil depth (p<0.05) and with the increase in the water/soil ratio. The authors’results indicate that the topsoil had a greater sorption capacity than the subsurface soil because of the higher OM content in the topsoil; deeper soils have less sorption and tend to desorb more testosterone. However, additional studies are needed to determine the potential risk of testosterone leaching or runoff.
Acknowledgments
The authors thank Dr. Mitiku Mamo for his help with field sam-pling and Dr. James A. Smith at the University of Virginia for soil surface area tests. This research was made possible through support from the USEPA Science to Achieve Results (STAR) program (EPA-G2006-STAR-M1) and the National Science Foundation (Award ID: 1067537).
References
Arnon, S., et al. (2008).“Transport of testosterone and estrogen from dairy-farm waste lagoons to groundwater.”Environ. Sci. Technol., 42(15), 5521–5526.
Bartelt-Hunt, S. L., et al. (2012). “Effect of growth promotants on the occurrence of steroid hormones on feedlot soils and in runoff from beef cattle feeding operations.” Environ. Sci. Technol., 46(3), 1352–1360.
Bhandari, A., et al., eds. (2009).Contaminants of emerging environmental
concern, ASCE, Reston, VA.
Bhandari, A., Novak, J. T., and Berry, D. F. (1996). “Binding of 4-monochlorophenol to soil.” Environ. Sci. Technol., 30(7), 2305–2311.
Biswas, S., et al. (2013a). “Current knowledge on the environmental fate, potential impact, and management of growth promoting steroids used in the US beef cattle industry.”J. Soil Water Conserv., 68(4), 325–336.
Biswas, S., et al. (2013b).“Use of a surrogate to evaluate the impact of tillage on the transport of steroid hormones from manure-amended agricultural fields.”Trans. ASABE, 56(4), 1379–1385.
Campbell, C. G., Borglin, S. E., Green, F. B., Grayson, A., Wozei, E., and Stringfellow, W. T. (2006). “Biologically directed environ-mental monitoring, fate, and transport of estrogenic endocrine dis-rupting compounds in water: A review.” Chemosphere, 65(8), 1265–1280.
Carroll, K. M., Harkness, M. R., Bracco, A. A., and Balcarcel, R. R. (1994). “Application of a permeant/polymer diffusional model to the desorption
of polychlorinated biphenyls from Hudson River sediments.”Environ. Sci. Technol., 28(2), 253–258.
Casey, F. X. M., Hakk, H., Simunek, J., and Larsen, G. L. (2004).“Fate and transport of testosterone in agricultural soils.” Environ. Sci. Technol., 38(3), 790–798.
Chung, N. H., and Alexander, M. (1998).“Differences in sequestration and bioavailability of organic compounds aged in dissimilar soils.”Environ. Sci. Technol., 32(7), 855–860.
Das, B. S., Lee, L. S., Rao, P. S. C., and Hultgren, R. P. (2004).“Sorption and degradation of steroid hormones in soils during transport: Column studies and model evaluation.” Environ. Sci. Technol., 38(5), 1460–1470.
Fan, Z. S., Casey, F. X. M., Hakk, H., and Larsen, G. L. (2007).“ Persist-ence and fate of 17 beta-estradiol and testosterone in agricultural soils.” Chemosphere, 67(5), 886–895.
Farrell, J., and Reinhard, M. (1994).“Desorption of halogenated organics from model solids, sediments, and soil under unsaturated conditions: 2. Kinetics.”Environ. Sci. Technol., 28(1), 63–72.
Finlay-Moore, O., Hartel, P. G., and Cabrera, M. L. (2000).“17ß-estradiol and testosterone in soil and runoff from grasslands amended with broiler litter.”J. Environ. Qual., 29(5), 1604–1611.
Gineys, N., Giroud, B., Gineys, M., and Vulliet,, E. (2012).“Retention of selected steroids on a silt-loam soil.”J. Environ. Sci. Health, 47(13), 2133–2140.
Hakk, H., Millner, P., and Larsen, G. (2005).“Decrease in water-soluble 17ß-estradiol and testosterone in composted poultry manure with time.” J. Environ. Qual., 34(3), 943–950.
Hanselman, T. A., Graetz, D. A., and Wilkie, A. C. (2003).“Manure-borne estrogens as potential environmental contaminants: A review.”Environ. Sci. Technol., 37(24), 5471–5478.
Kim, I., Yu, Z. Q., Xia, B. H., and Huang, W. L. (2007).“Sorption of male hormones by soils and sediments.”Environ. Toxicol. Chem., 26(2), 264–271.
Kirk, L. A., Tyler, C. R., Lye, C. M., and Sumpter, J. P. (2002).“Changes in estrogenic and androgenic activities at different stages of treat-ment in wastewater treattreat-ment works.” Environ. Toxicol. Chem., 21(5), 972–979.
Kolpin, D. W., et al. (2002). “Pharmaceuticals, hormones, and other organic wastewater contaminants in U.S. streams, 1999–2000: A national reconnaissance.” Environ. Sci. Technol., 36(6), 1202–1211.
Lange, I. G., Daxenberger, A., Schiffer, B., Witters, H., Ibarreta, D., and Meyer, H. H. D. (2002). “Sex hormones originating from different livestock production systems: Fate and potential disrupting activity in the environment.”Anal. Chim. Acta., 473(1–2), 27–37.
Lee, L. S., Strock, T. J., Sarmah, A. K., and Rao, P. S. C. (2003).“Sorption and dissipation of testosterone, estrogens, and their primary transforma-tion products in soils and sediment.”Environ. Sci. Technol., 37(18), 4098–4105.
Li, J., Fu, J., Xiang, X., Wu, M., and Liu, X. (2013).“Kinetics, equilibrium, and mechanisms of sorption and desorption of 17α-ethinyl estradiol in two natural soils and their organic fractions.”Sci. Total Environ., 452–453, 404–410.
Lorenzen, A., Chapman, R., Hendel, J. G., and Topp, E. (2005).“ Persist-ence and pathways of testosterone dissipation in agricultural soil.” J. Environ. Qual., 34(3), 854–860.
Ma, R. (2009). “Sorption and desorption of testosterone in agricultural soils.”M.S. thesis, Univ. of Nebraska—Lincoln, Lincoln, NE.
Sangsupan, H. A., Radcliffe, D. E., Hartel, P. G., Jenkins, M. B., Vencill, W. K., and Cabrera, M. L. (2006).“Sorption and transport of 17ß-estradiol and testosterone in undisturbed soil columns.” J. Environ. Qual., 35(6), 2261–2272.
Shareef, A., Angove, M. J., Wells, J. D., and Johnson, B. B. (2006). “Sorption of bisphenol A, 17a-ethyny lestradiol and estrone to mineral surfaces.”J. Colloid Interface Sci., 297(1), 62–69.
Swartz, C. H., et al. (2006).“Steroid estrogens, nonylphenol ethoxylate metabolites, and other wastewater contaminants in groundwater
affected by a residential septic system on Cape Cod, MA.”Environ. Sci. Technol., 40(16), 4894–4902.
Van Donk, S. J., et al. (2013). “Transport of steroid hormones in the vadose zone after land application of beef cattle manure.” Trans.
ASABE, 56(4), 1327–1338.
Van Emmerik, T., Angove, M. J., Johnson, B. B., Wells, J. D., and Fernandes, M. B. (2003).“Sorption of 17 beta-estradiol onto selected soil minerals.”J. Colloid Interface Sci., 266(1), 33–39.
Weber, W. J., Jr., Huang, W. L., and Yu, H. (1998).“Hysteresis in the sorp-tion and desorpsorp-tion of hydrophobic organic contaminants by soils and sediments: 2. Effect of soil organic matter heterogeneity.”J. Contam. Hydrol., 31(1–2), 149–165.
Wicks, C., Kelley, C., and Peterson, E. (2004). “Estrogen in a karstic aquifer.”Ground Water, 42(3), 384–389.
Xu, K., Haper, W. F., and Zhao, D. Y. (2008). “17α-ethinylestradiol sorption to activated sludge biomass: Thermodynamic properties and reaction mechanisms.”Water Res., 42(12), 3146–3152.
Yang, Y.-Y., Borch, T., Young, R. B., Goodridge, L. D., and Davis, J. G. (2009).“Degradation kinetics of testosterone by manure-borne bacteria: Influence of temperature, pH, glucose amendments, and dissolved oxygen.”J. Environ. Qual., 39(4), 1153–1160.
Yuan, G. S., and Xing, B. S. (2001).“Effects of metal cations on sorption and desorption of organic compounds in humic acids.”Soil Sci., 166(2), 107–115.